Weekly Analyze of the Crypto Investing in October, 2022Date: Oct 24,2022-Oct 28,2022
The crypto market has seen a rebound this week.
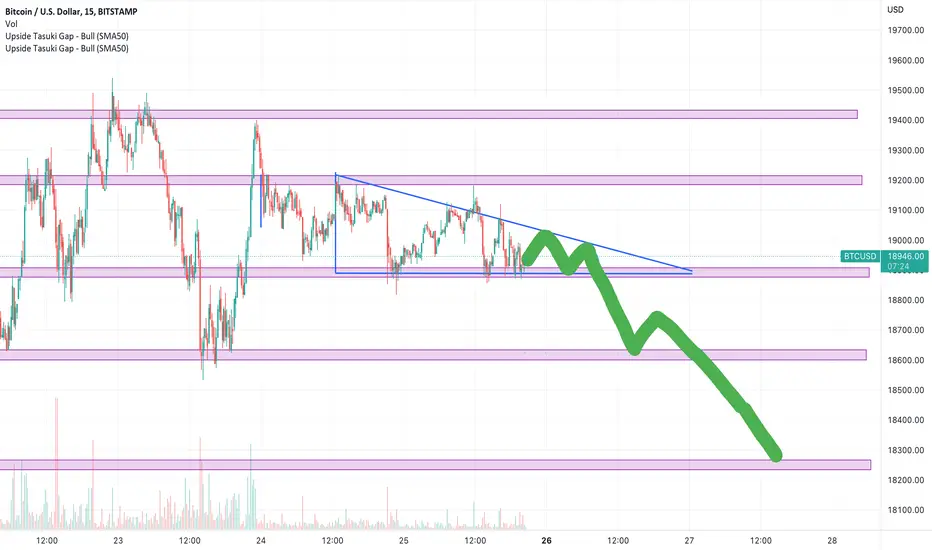
The BTC weekly line maintains a slow upward shift in the center of gravity, but it is similar to previous weeks. At present, it has started to fall again after the amplitude reaches 10%, so it is not ruled out that this week will also end with a small entity.
The daily line was in a narrow range at the lower edge of the range and then chose to break up after many days, breaking the trend moving average suppression and the band high, forming an upward trend.
At present, the Fibonacci 61.8% line of this segment is encountered. In terms of form, it can be regarded as a confirmation of stepping back after breaking through the box. After adjustment, if it stabilizes above 20500, it is expected to continue to rise next week.
The support range is 19500–19700, and the resistance range is 21300–21800.
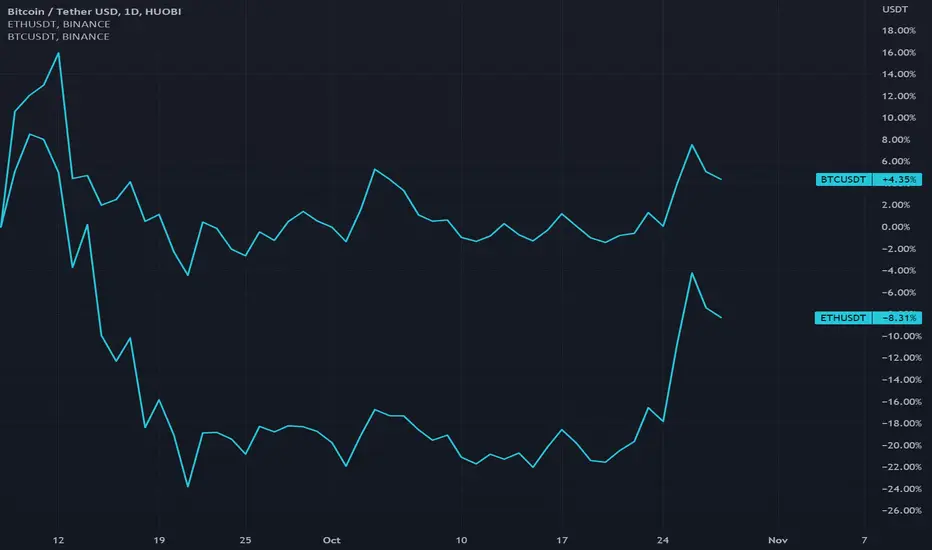
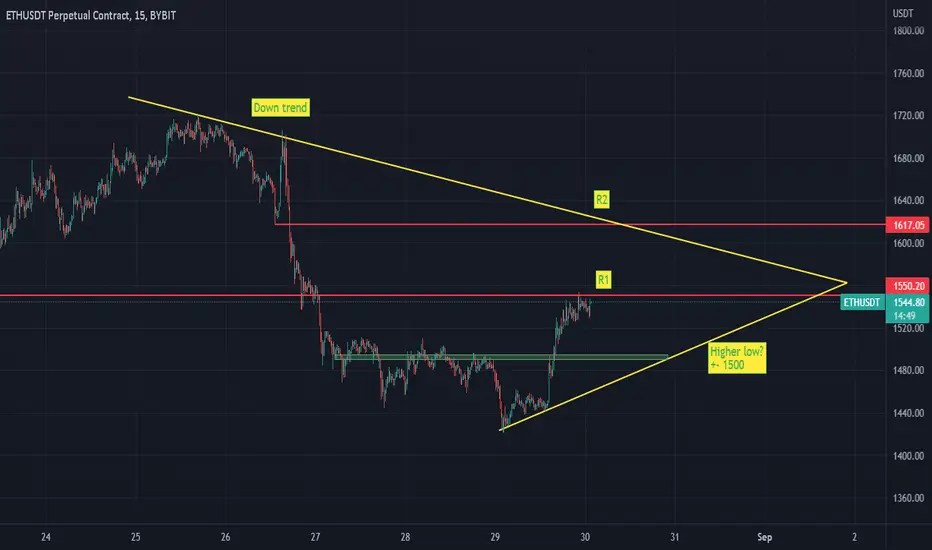
The exchange rate of ETH against the broader market has shown signs of strength, and the weekly surge has been large, which can be focused on. After the daily line broke through, the trend was relatively smooth, and there was a strong consolidation above the range of 1450–1480. The defensive range is 1400–1420, and the pressure range is 1620–1660.
Vtrading is a crypto trading platform providing smart coin trading strategies for every trader. If you are using Vtrading smart crypto trading bots, the Grid and Martin strategy are suggested for spot market, and the SMT strategy with small positions for futures market.
(All for reference only, plz invest rationally)
Eth-usdt
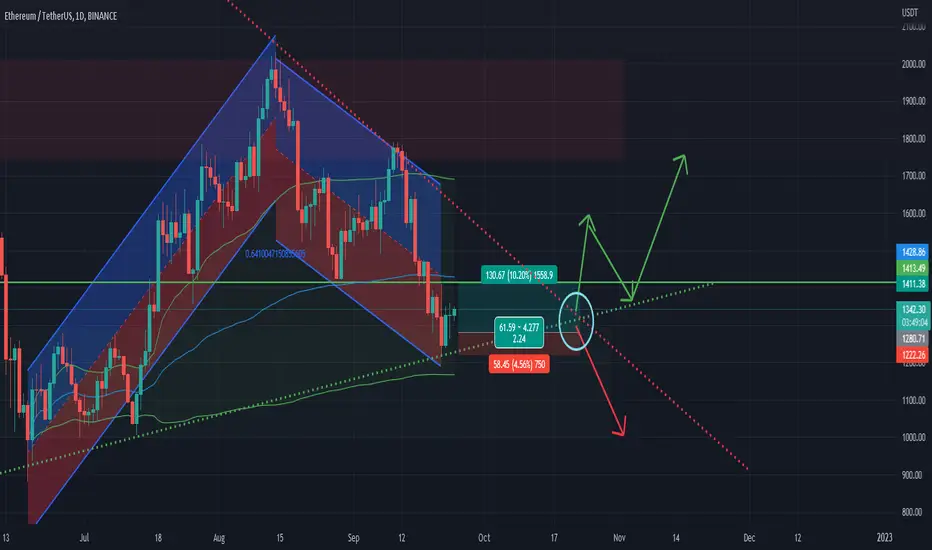
ETHUSDT longWe are about to see an important movement in the next 2 weeks. Breakout will decide if we make new short term bullish or bearish wave. You can not predict too far in markets nowadays, stick to day trading styles if possible.
Before waiting for breakout of triangle, you can try buying ETH now, but you will have to risk 1:1 to get this trade done or wait 1 more day if it pulls down to ~1280 again, Stop loss at the previous low 1210 and Take profit around 1415. ~ 1:2 RR
This is not a financial advise - just an idea, do not trade what you can not afford to lose. Cryptocurrency markets are highly volatile and risky.
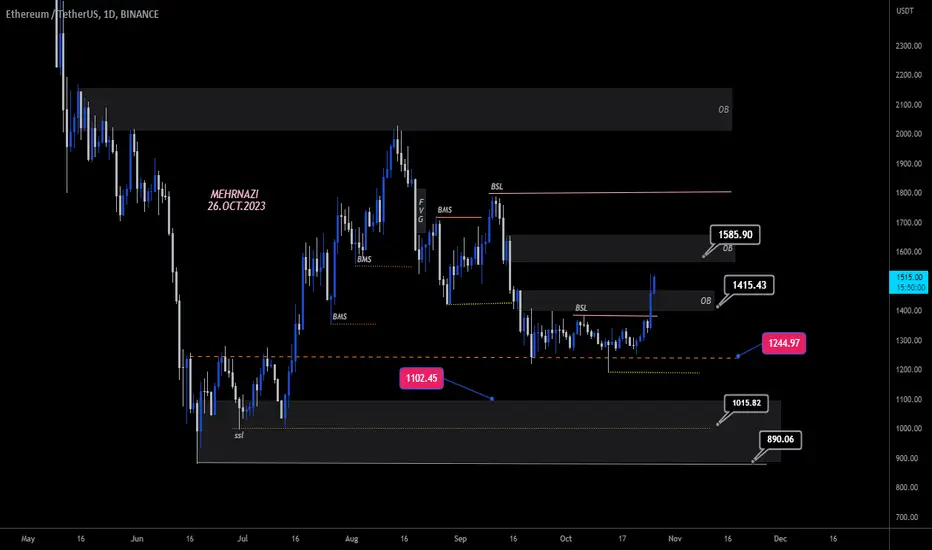
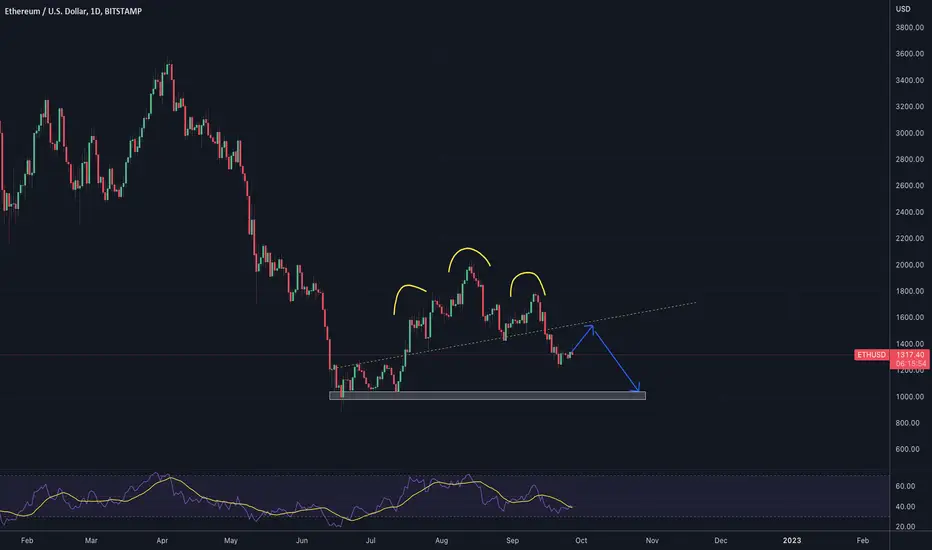
💁♀️ ETHUSDT / 1D 💁♀️Hi
💹Currently, the price is trading in the range of $1516. We may see a correction in the supply area of $1557/$1650.
Important resistance range $1557/$1650❗
It is important to maintain the range of $1240. ‼ ❗
Important support range $1100 / $1000 / $890 ⚠️
what do you think about it? I'M glad to know your idea..😊
ETHUSDTSTOPLOSS IS MUST
HOPE YOU LIKE MY SIGNALS SHARE WITH FRIENDS WITH STOPLOSS
PAIR ETH
Wait for the Breakout or breakdown Without confirmation of market no trade wait for confirmation
Also Make sure place trade when the 2nd candle after breaking zone breaks the body of previous break candle
LETS HIT THE Target
Control your emotion if you are trader

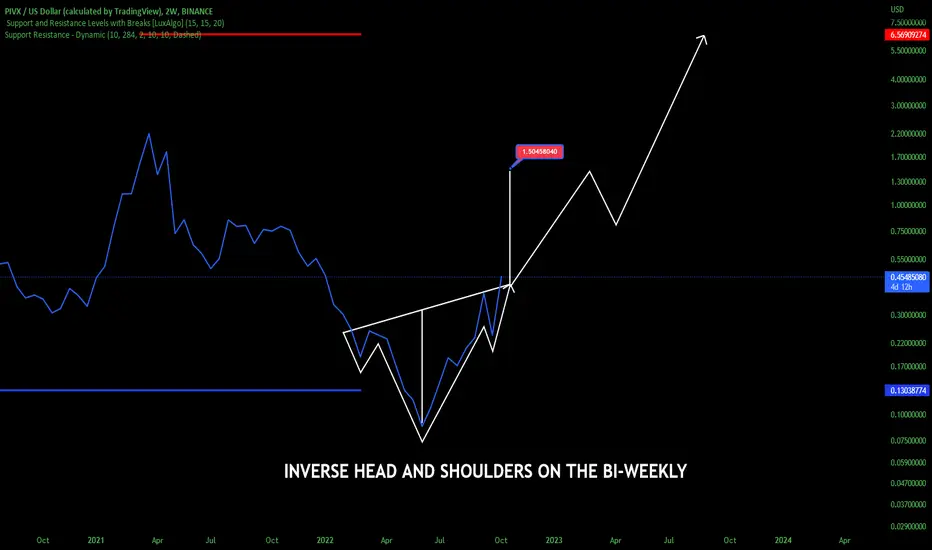
PIVX Inverse Head & Shoulders Measured Move At Least $1.50PIVX formed almost a perfect inverse head and shoulders on the BI Weekly chart. Price action has closed above the neckline. A measured move of at least $1.50 is coming with a possible move up to previous highs to follow. PIVX is being accumulated, and the buy orders have been increasing exponentially on the exchanges. Something is in the works for PIVX and its being accumulated under everyone's nose. PIVX total supply is not very high so get your hands on some before it hits double digits. I think PIVX time to shine is coming. This is not trading or financial advice this is just my opinion. Thank you.
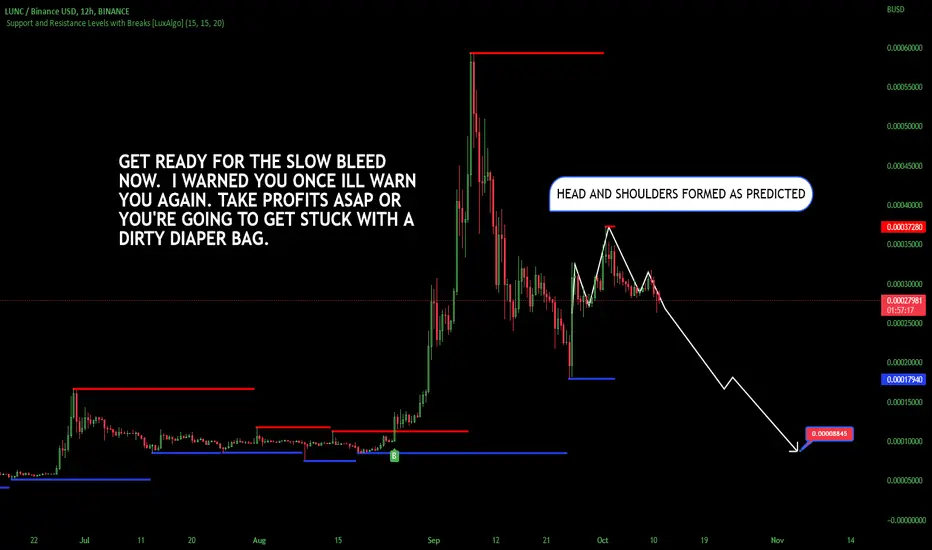
LUNA CLASSIC HEAD & SHOULDERS FORMED AS PREDICTED > SLOW BLEED!LUNC is moving exactly as I predicted in my last chart (ill link it below for you non-believers). The head and shoulders has formed and LUNC is trading below it now. The neckline is broken and the price is hanging on by a thread at this point. A huge drop is coming for the measured move, down to at least .00018 and then a bounce there at the dynamic support level up to about maybe .00024. Then a quick drop back below .00018 and then a slow bleed to major support around .00009 and wicks lower to .00008 is very possible once the panic selling starts and the staked coins start to become un-staked and sold. Anyone who is staking LUNA is screwed in my opinion cause it takes something like 20 days to unstake and by the time they get them the price will be .00009 if they are lucky. LUNA CLASSIC will never burn the coins everyone is hoping it will burn. All this burn talk and Binance burn is to literally keep the suckers hanging on so the big fellas can dump it on their chin. Oh and for USTC to re-pegg it needs to be trusted and used as a stablecoin, that will never happen so drop that idea right out of your heads right now. Shame on LUNA for screwing you all the first time but, Shame on you all for getting screwed twice in a row with this sh!tcoin! Also for all the you-tubers out there pumping this piece of horsesh!t, phuck you too, you're all sh!tbags for screwing over innocent people so you can get your damn clicks, karma is a MF. Get phucked!
THIS IS NOT TRADING OR FINANCIAL ADVICE THIS IS JUST MY OPINION. GIVE ME A BOOST AND FOLLOW IF YOU WOULD LIKE TO SUPPORT MY WORK. THANK YOU AND GOOD LUCK OUT THERE.
THIS IS MY PREVIOUS CHART I MADE SAYING THAT THE PRICE ACTION WAS NOT GOING TO FORM NEW HIGHS WHEN EVERYONE WAS SCREAMING LUNC NEW BULL RUN. I SAID INSTEAD IT WOULD FORM A HEAD AND SHOULDERS AND THEN CONTINUE THE DROP.
ETH USDT LONG SWING | ETHUSDT | LONG @ 1270 - 1285 | TP @ 1290, 1295, 1300, 1305, 1310 | SL @ 1180 | PATTERN = DOUBLE TOP BREAKOUT | COINBASE |
Swing trade idea. Kindly follow targets and stop loss. Will update with new targets once all 5 are achieved. Mostly trading with PNF charts, MACD, RSI, Stoch, BPI, Cipher, MA/EMA, Support/Resistance on hourly timeframes and higher time frames
BINANCE:ETHUSDT BITSTAMP:ETHUSD COINBASE:ETHUSD BYBIT:ETHUSDT KUCOIN:ETHUSDT FTX:ETHPERP BINANCE:ETHPERP FTX:ETHUSD
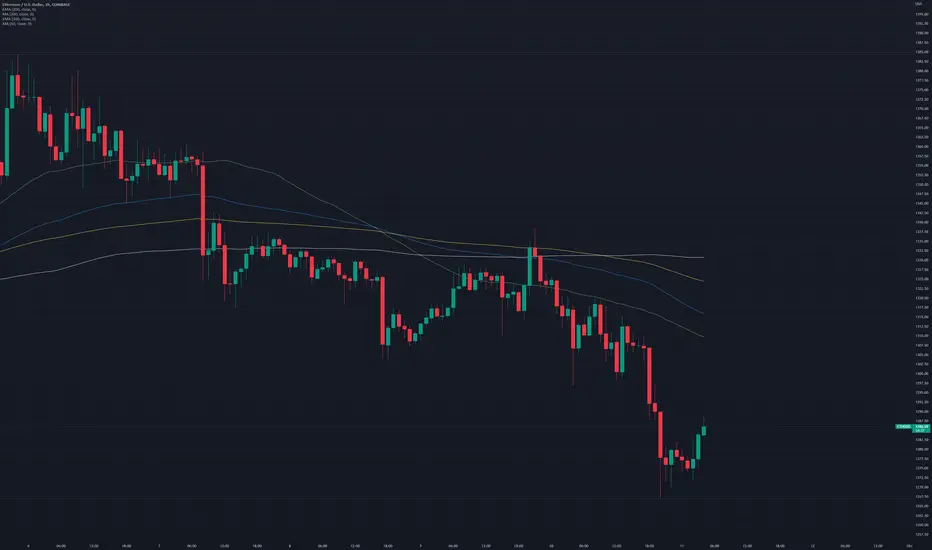
Quick ETH PlayQuick ETH short-term play.
DISCLAIMER:
This is not financial advice. Trade at your own risk.
TERROR LUNA CLASSIC In Freefall Down to .00013 Wicks to .000088LUNA classic has been in free-fall since reaching its high. It broken through all major support and the downtrend continues. There is a drive of hidden bullish divergence on the hourly so a bounce today and tomorrow up to .00026-.000275 is possible and likely before being rejected at resistance again and continuing its downward journey. There is no real support after .0002, so once .0002 breaks and we get into the .0001's then the panic selling will occur and we will drop fast down to the next major support around .000144. I don't think .000144 will hold for long before LUNA slams down to really strong support around .00011. A stray wick could push down to as far as .000095-.000089.
This is not trading or financial advice this is just my opinions and speculations based on TA and FA of my own.
MACD ON THE DAILY : STRAIGHT DOWN
RSI ON THE DAILY : STRAIGHT DOWN

Down, down, down 8 pm - 12 pm ESTDescending triangle. Down this evening between 8 pm and 12pm EST. See Chart
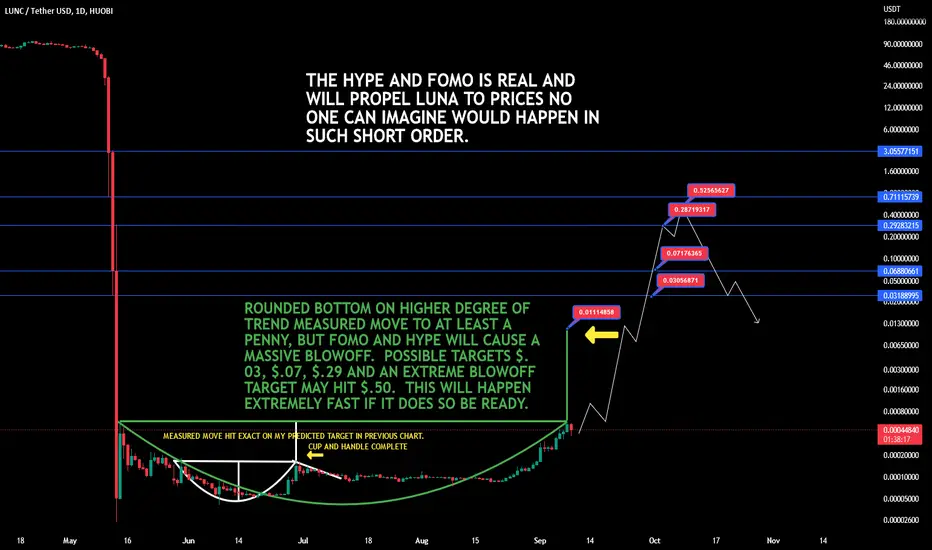
TERRA LUNA CLASSIC About to Go Parabolic! $.50 Cents IncomingLuna has been on a tear lately. I made a chart back in June showing a cup and handle pattern with a measured move target of about .00055 (ill link the chart below). Luna hit the target and is now in a small consolidation, but I don't think its going to go much lower in this small correction before continuing to the upside. There is a nice rounded bottom pattern that has formed as well and .0006 ish will validate this pattern and a measured move to about $.01 a penny looks very possible and I think possibly in the next couple weeks. There is also a possibility that with the fomo and hype that would hit when Luna actually hits a penny, it will bring in all the skeptics and the blow off could shoot Luna to 25 or even 50 cents. Do not think that can happen? Ask the Doge and Shib doubters how their comments aged when people who literally invested a couple hundred dollars became millionaire over night, literally! Some big things are happening for Luna, and some big players are getting in. Do not forget that CZ of Binance is salty over the Luna collapse. He lost $1.6 BILLION DOLLARS in the collapse. SO what if he has multiple billions, do you know how much a billion dollars actually is? I'm sure he wants his money back and then some and he is going to get it. Do not forget about those wallets accumulating Luna in the trillions a couple months back. What if CZ or some other major holder comes out and says they want to burn 5 trillion coins, its very possible. Vitalik Buterin burned about 40% of the total shib supply suddenly one day and the price of Shib went bananas. Anyways good luck out there and be safe. This is not trading or financial advice this is just my opinion. Thank you
ETHW & ETC AWESOME FRACTAL! MIGHT WANNA LOAD UP ON ETHWI went back to when Ethereum Classic originally forked from Ethereum back in the day and wanted to see what the price action was like then to see if I could compare it to the new fork ETHW. What do you know the fractal looks eerily similar just on different time frames. Might be a good potential long here on ETHW. This is not trading or financial advice this is just my opinion. Thank you.

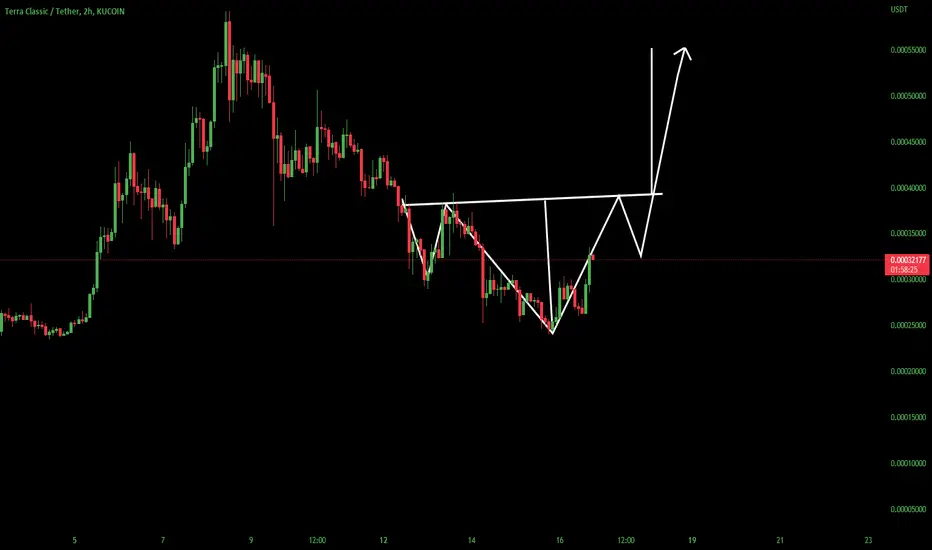
LUNA CLASSIC LUNC Possible Larger Inverse Head And Shoulders!Luna is in a current run playing out a measured move of the inverse head and shoulders I showed in the other charts I did. I just noticed that if the support and resistance plays play out like I think then Luna will be forming a much larger inverse head and shoulders on a higher degree of trend. That measured move would bring it to the previous high at minimum. This looks like a possible path for Luna Classic. Gotta be quick with this one it moves fast ladies and gentlemen. This is not trading or financial advice this is just my opinion. if you like ideas like this and frequent updates then give me a like and follow for more. Good luck out there everyone. Thank you
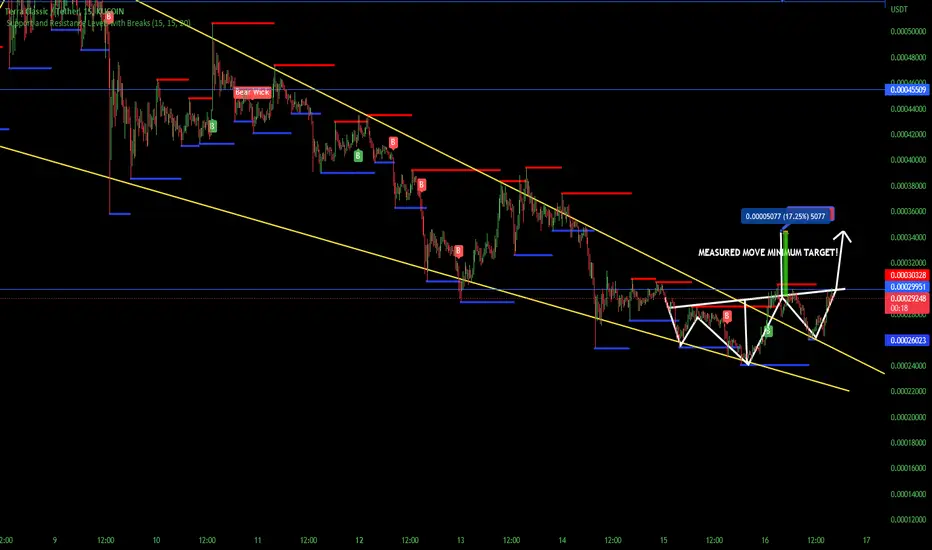
LUNAC Luna Classic The Move Is Happening Now Neckline Broken!Luna is in the move to play out the measured move of the inverse head and shoulders. My minimum target is .000345 with an extended target to around .00038. The daily is still just starting its run so at these levels expect small corrections. At the .00038 level if we dont break and close above .000384 then a pull back to .000345 is likely. If we stop at .000345 and lose strength then a pullback back down to .000308 or so will probably play out. Not trading or financial advice, follow me for more updates. Thank you
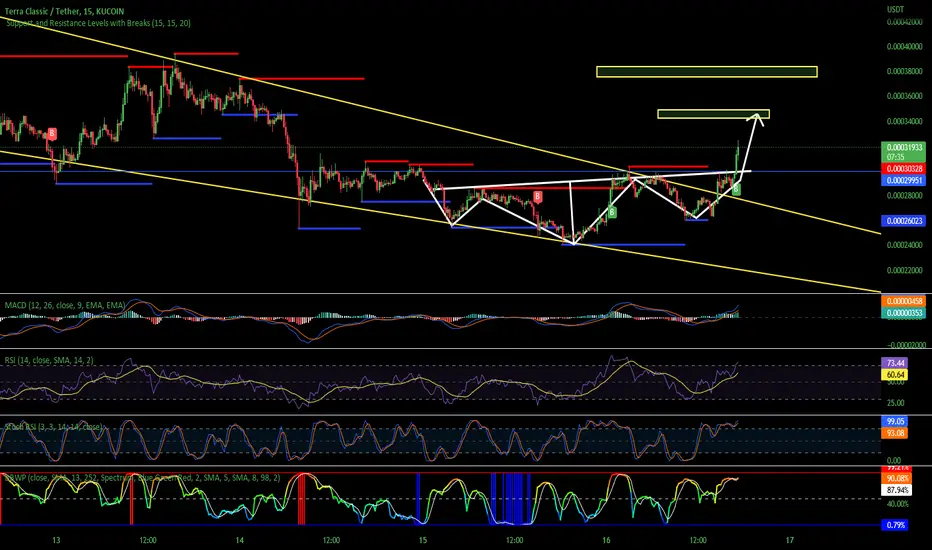
LUNA CLASSIC LUNAC Right Shoulder Complete, Break .0003 EASY $$Luna classic has completed the right shoulder on the inverse head and shoulders. A break of .0003 and we will see a minimum target of .000345 with possible higher targets of .000375. I think if we manage to find solid support around .00039 then this rally will continue to complete the measured move of the giant falling wedge/flag with a measured move to previous highs, minimum. Follow me for more updates. This is not financial or trading advice this is just my opinion. Thank you and good luck.
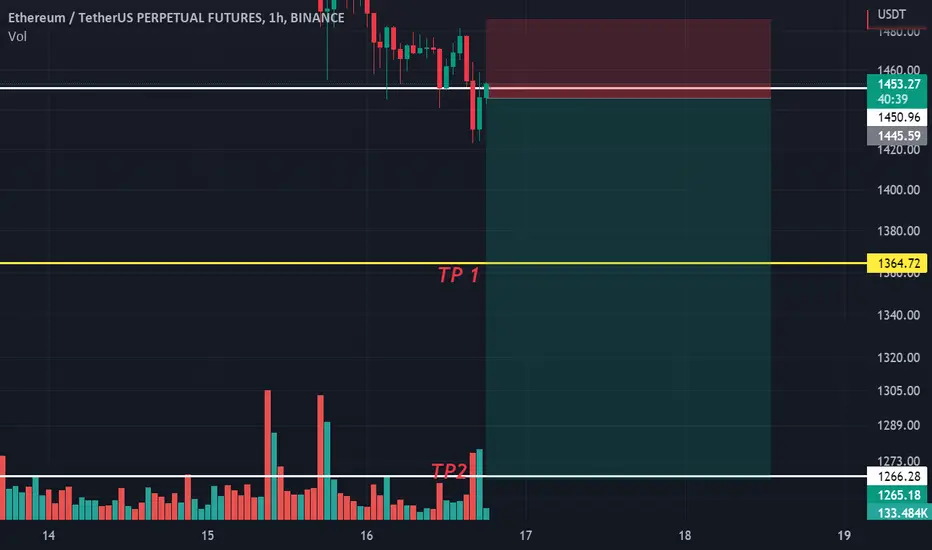
ETH USDT SHORT SIGNAL Ethusdt has broked important suport and we hope we will see 1365 and 1265
but remember we can't be sure in this market
thank you all
feisal mohammad reza
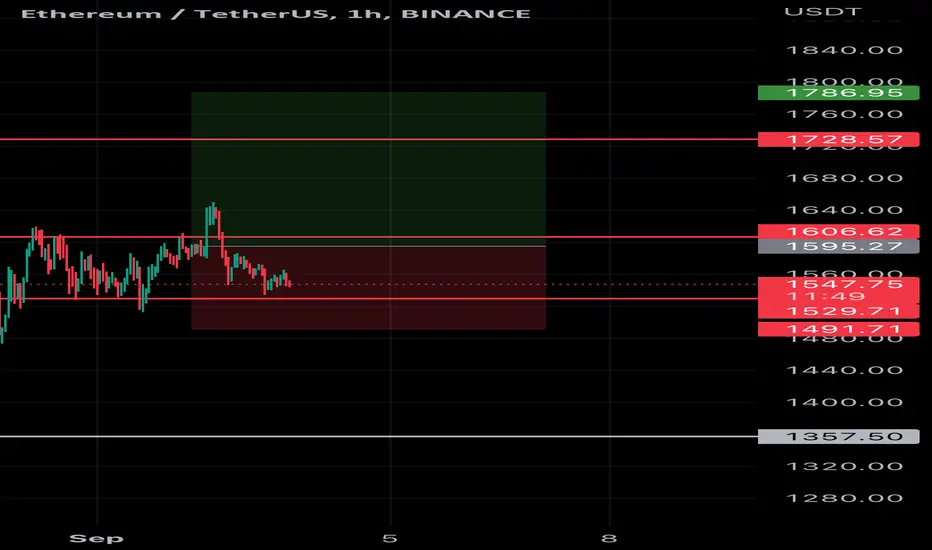
EHT USUDT S/R ETHERUM SUPPORT AND RESISTANCE LINS
support and resistance time M W D
entry trigger yellow lines

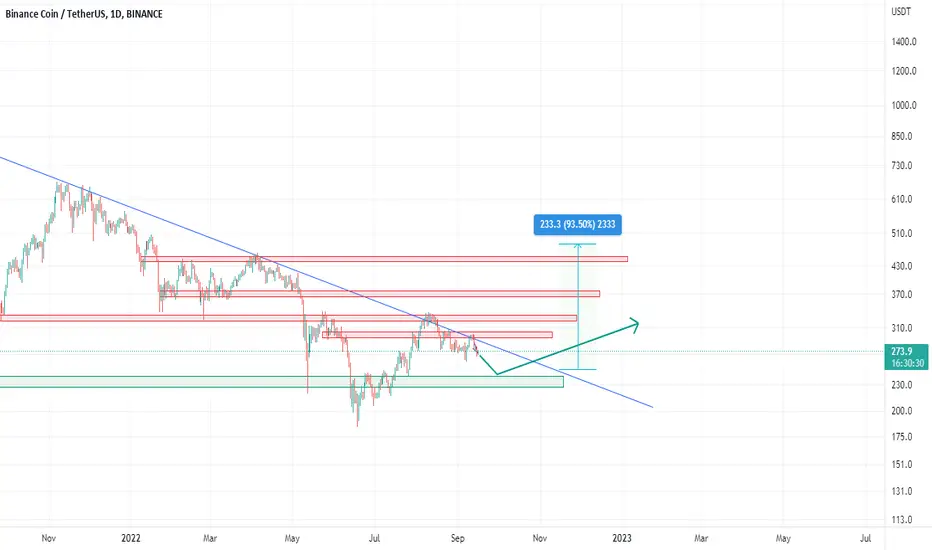
ETH MOVEMENT UPDATE Eth is again in buying range. In my view Eth is stronger BTC.All major resistance and support are mentioned in graph.All the movement is mentioned decided by these Support and Resistance
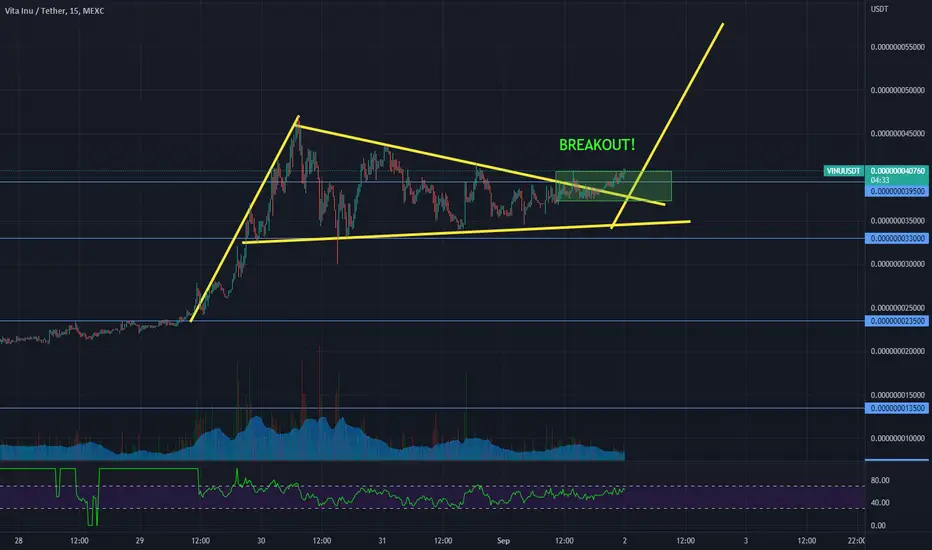
VITA INU (VINU) - BREAKOUTBullish pennant has just broken to the upside. Is a momentum play targeting 55000 based on the previous upside range.
RLC - THE NEW INCREASE TIME RLC Seems to be ready for new increase - on the low time frame
Its one of the interesting coins at the moment.
Targets.
Possibility between 10% -55 %
# No any idea of this channel is a finance idea.

Can you chart USDT.D?AUG 9th USDT.D analysis
5.96 was a big measured move from the previous bear flag and we can see 2 consolidations for a double bottom bounce. Big daily/weekly wedge to watch still especially with CPI data which will affect all markets likely tomorrow.
It went sideways long enough after the bear flag break towards the right side and wedge resistance even though we are seeing lower highs on the bigger swing. A backtest here of the breakout.
Much like the VIX, you can argue that it's not something you chart but you can compare the movement and see there is a large inverse relationship between this and BTC. Use it as a tool to supplement your other analysis!
