K.I.S.S => ETHHello TradingView Family / Fellow Traders. This is Richard, also known as theSignalyst.
📉 ETH Market Update – Keeping It Simple 📉
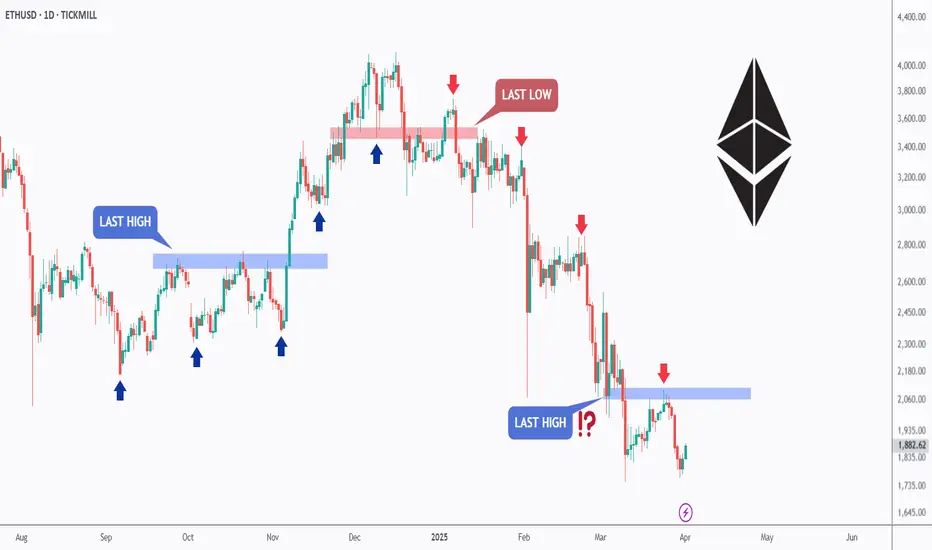
Since breaking below its last major low in December 2024, Ethereum (ETH) has been stuck in a bearish trend.
But don’t lose hope, bulls! 🐂
For the long-awaited altseason to kick off, ETH needs to flip the script and break above its last major high — currently sitting at $2,100.📈
Until then, patience is key. 🧘♂️
📚 Always follow your trading plan regarding entry, risk management, and trade management.
Good luck!
All Strategies Are Good; If Managed Properly!
~Rich
ETH
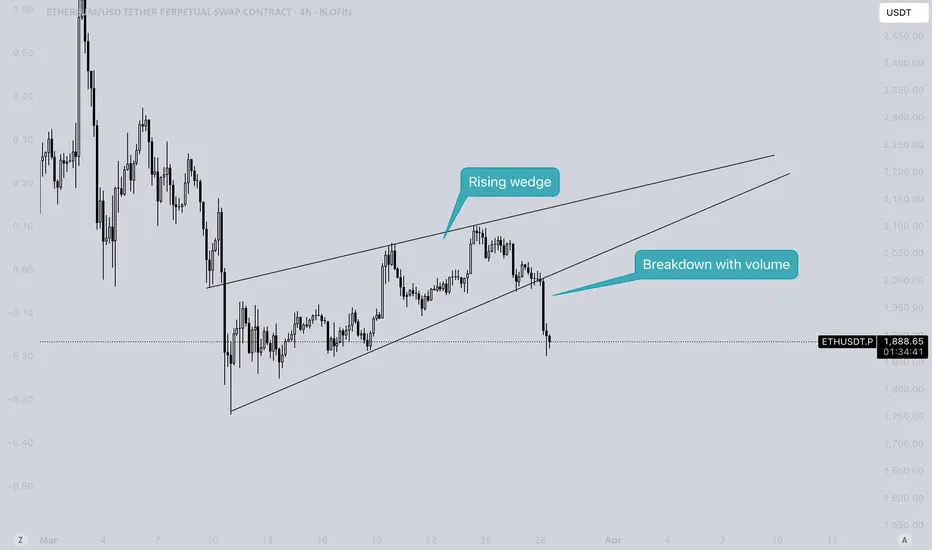
ETH - When will this downtrend finally stop?Ethereum (ETH) has been stuck in a prolonged downtrend, and the bearish scenario is now playing out. On the 4-hour chart, ETH recently broke below its rising trend line after forming a rising wedge that typically signals further downside. This breakdown confirms the potential for further downside.
At the same time, on the weekly timeframe, ETH has perfectly retested its resistance and failed to push higher, reinforcing overall market weakness. With failing to break resistance it is likely that ETH could face continued weakness and move towards the weekly support area at 1500.
Thanks for your support.
- Make sure to follow me so you don't miss out on the next analysis!
- Drop a like and leave a comment!
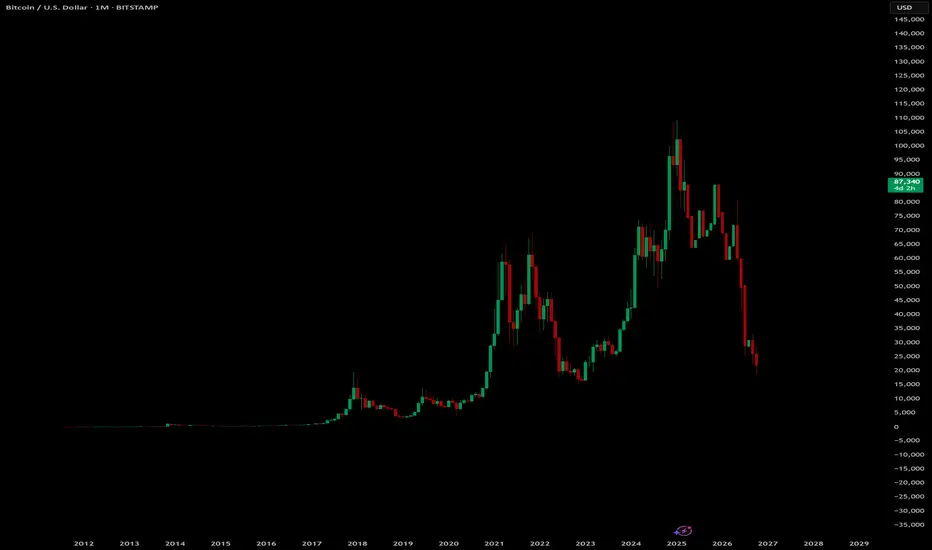
Ethereum Not Dead- i know some peoples think ETH will go to 250$ or 500$, so wait for it...
- I've always maintained that I'm not a fan of ETH because of its scalability limitations and centralization, for that reason ETH needs some messy L1...L2...etc..
- That said, my opinion doesn’t matter much, ETH is here to stay. The Ethereum ecosystem hosts thousands of projects; I’d say it’s too big to fail.
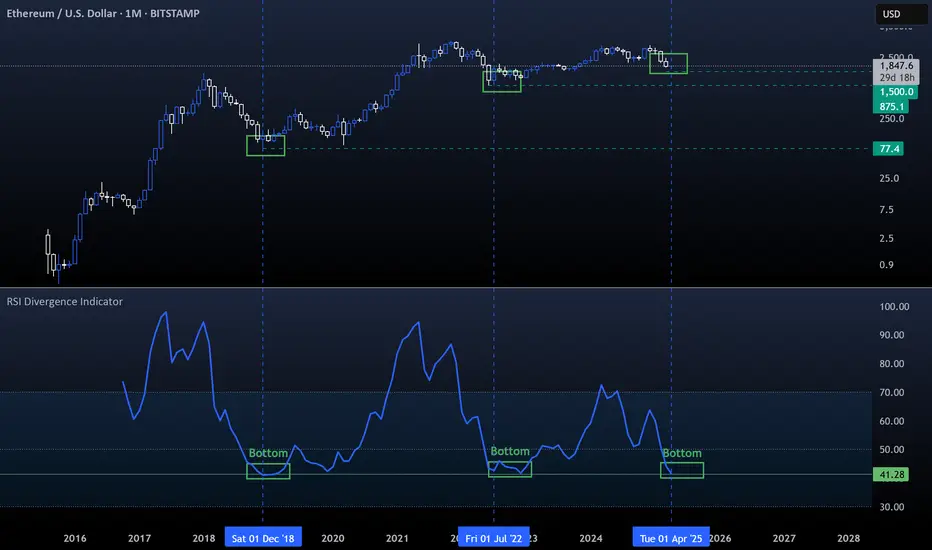
- i used Bitstamp exchange to look further back in the chart's history.
- i simplified this monthly chart so much that even a 10 year old kid could understand it, just check the RSI low levels and compare it with previous years. Again, check the max RSI level for the previous ATHs.
- i won't discuss where to buy because, whether you get ETH at $1,800 or $1,500, the bull run for ETH and Altcoins hasn't started yet.
Happy Tr4Ding !
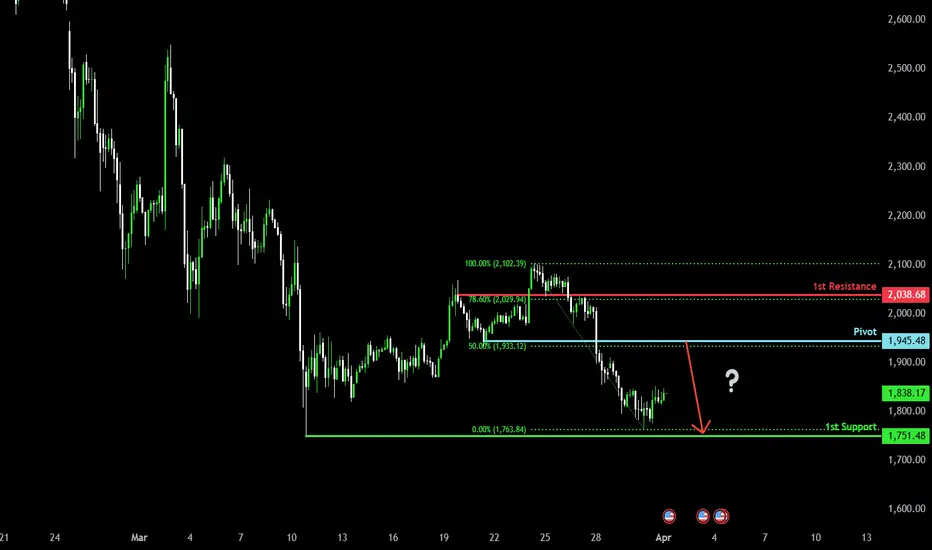
Heading into 50% Fibonacci resistance?Ethereum (ETH/USD) is rising towards the pivot which has been identified as a pullback resistance and could reverse to the 1st support.
Pivot: 1,945.48
1st Support: 1,751.48
1st Resistance: 2,038.68
Risk Warning:
Trading Forex and CFDs carries a high level of risk to your capital and you should only trade with money you can afford to lose. Trading Forex and CFDs may not be suitable for all investors, so please ensure that you fully understand the risks involved and seek independent advice if necessary.
Disclaimer:
The above opinions given constitute general market commentary, and do not constitute the opinion or advice of IC Markets or any form of personal or investment advice.
Any opinions, news, research, analyses, prices, other information, or links to third-party sites contained on this website are provided on an "as-is" basis, are intended only to be informative, is not an advice nor a recommendation, nor research, or a record of our trading prices, or an offer of, or solicitation for a transaction in any financial instrument and thus should not be treated as such. The information provided does not involve any specific investment objectives, financial situation and needs of any specific person who may receive it. Please be aware, that past performance is not a reliable indicator of future performance and/or results. Past Performance or Forward-looking scenarios based upon the reasonable beliefs of the third-party provider are not a guarantee of future performance. Actual results may differ materially from those anticipated in forward-looking or past performance statements. IC Markets makes no representation or warranty and assumes no liability as to the accuracy or completeness of the information provided, nor any loss arising from any investment based on a recommendation, forecast or any information supplied by any third-party.
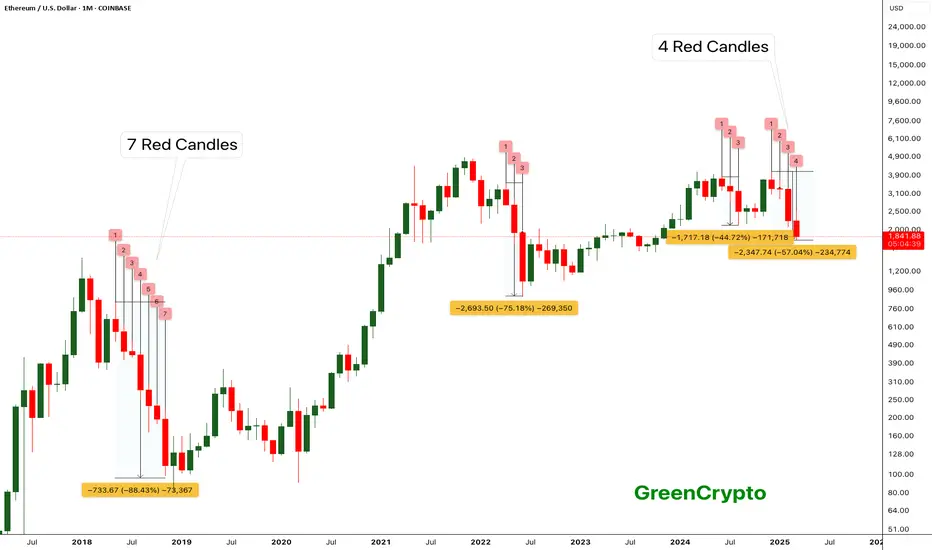
ETH - 4 Red Monthly CandlesThis is the second time we’ve seen four consecutive red monthly candles for ETH. The last occurrence was during the 2018 bear market, where ETH crashed 88% from its peak.
This time, the four-month decline has resulted in a 57% drop so far. However, with the price now at a key support zone, I anticipate that the April 2025 candle will be green, signaling a strong recovery—potentially exceeding the previous month’s losses.
If April turns out to be another red month, we could see ETH dropping further toward the $1,300 level before finding a stronger bottom.
Let’s see how this plays out!
Cheers,
GreenCrypto
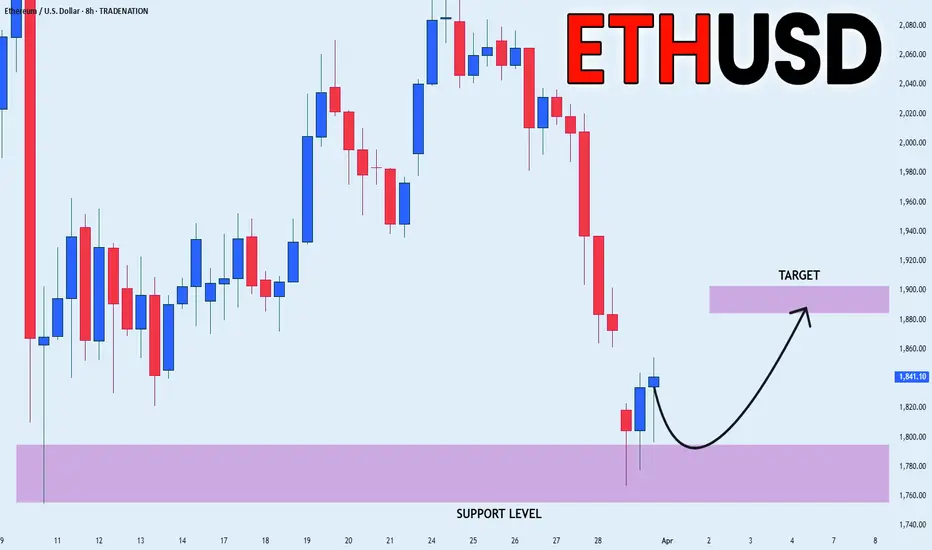
ETHEREUM BULLISH BIAS|LONG|
✅ETHEREUM fell again to retest the support of 1760$
But it is a strong key level
So I think that there is a high chance
That we will see a further bullish
Move up given that we are already
Seeing a bullish move up
LONG🚀
✅Like and subscribe to never miss a new idea!✅
Disclosure: I am part of Trade Nation's Influencer program and receive a monthly fee for using their TradingView charts in my analysis.
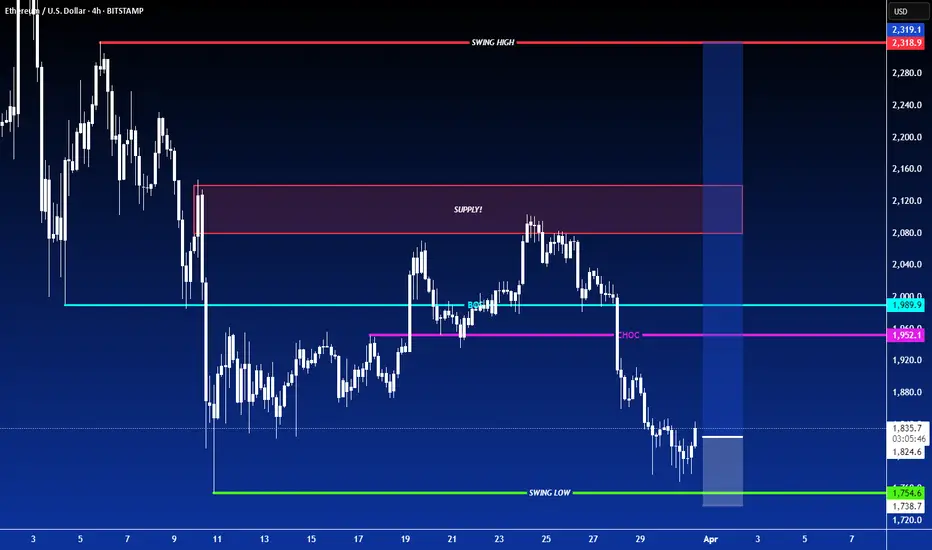
LONG ON ETHEREUM (ETH/USD)Ethereum has given a change of character (choc) to the upside on the 4 hour timeframe...
followed by a nice sweep of engineered liquidity!
Its currently respecting a key demand are and I believe it will now rise for 300-500 points this week.
I am buying Eth to the next level of resistance.
ETHUSDT - when the second leverage liquidate?- I'm waiting for the momentum to accelerate and liquidate.
- in the 1700-1500 zone, the buyer's zone.
- there may be a false break at first

BRIEFING Week #13 : ETH offers perfect opportunityHere's your weekly update ! Brought to you each weekend with years of track-record history..
Don't forget to hit the like/follow button if you feel like this post deserves it ;)
That's the best way to support me and help pushing this content to other users.
Kindly,
Phil

ETH - is the worst over ? Can we expect reversal ?As shown in the chart, ETH has reached the trendline support and is currently trading near a key support zone. This critical level will determine whether ETH initiates a reversal from its long-term downtrend that began last December.
I anticipate this support to hold, leading to a strong rebound in ETH's price. If the reversal occurs from this zone, ETH could reach its peak around Q4 2025.
Let’s see how it unfolds!
Cheers,
GreenCrypto

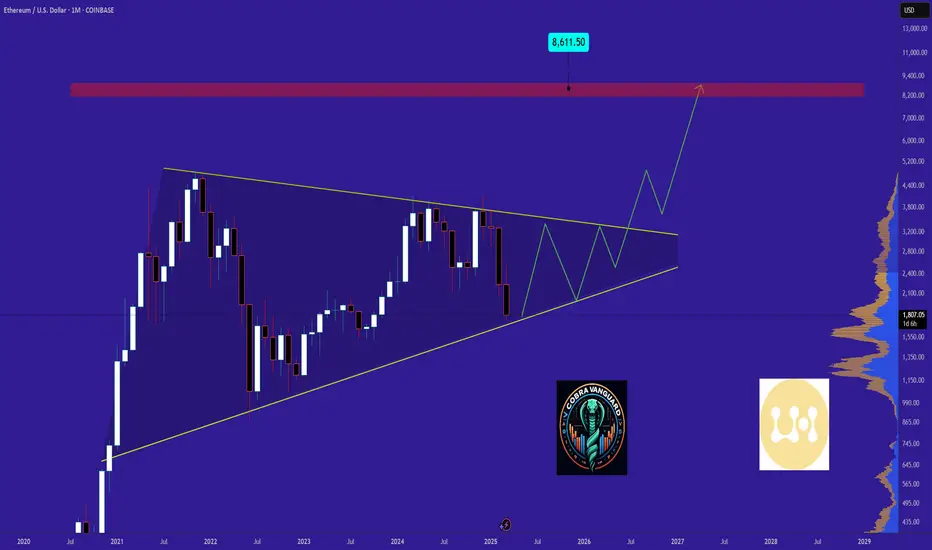
ETH Ready for PUMP or what ?Currently, ETH is forming an ascending triangle, indicating a potential price increase. It is anticipated that the price could rise, aligning with the projected price movement (AB=CD).
However, it is crucial to wait for the triangle to break before taking any action.
Give me some energy !!
✨We spend hours finding potential opportunities and writing useful ideas, we would be happy if you support us.
Best regards CobraVanguard.💚
_ _ _ _ __ _ _ _ _ _ _ _ _ _ _ _ _ _ _ _ _ _ _ _ _ _ _ _ _ _ _ _
✅Thank you, and for more ideas, hit ❤️Like❤️ and 🌟Follow🌟!
⚠️Things can change...
The markets are always changing and even with all these signals, the market changes tend to be strong and fast!!
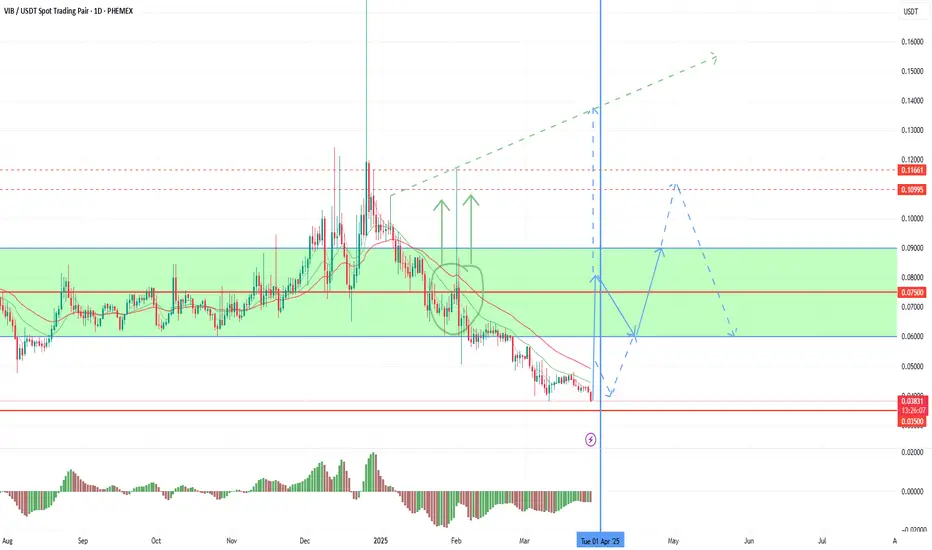
New opportunities for earning money on VIPTo date, we have come close to a change in the quarter and a high probability of increased volatility. The second half of the monthly candle on ether opened in the negative zone, which gives a signal to hold sales until the end of the quarter. However, in recent days, individual coins have the opportunity to work out their accumulated potential with a bullish reversal of the monthly candle. VIB is currently the most oversold coin without the monitoring tag. Against the background of the pinbar of the last monthly candle, there were few buyers this month, but technical buy signals were left up to a 0.1 retest even with the current market position.
In an optimistic scenario, today's daily candle may turn bullish with continued purchases until the end of the quarter. Negative statistics on the United States today may contribute to this. In the case of a reversal in the current quarter, the target may be a local breakout and retest of the trend line formed by the previous breakdown.
With less volatility and strong statistics coming out in the US today, the probability of a rebound from the retest of past hows in the range of 0.110-125 and a transition to a flat near the key long-term level of 0.075 +-15 prevails. In this case, the start of purchases may be delayed until the opening of a new quarter, or the next announcement on the assignment of the monitoring tag.
The main long-term support is 0.035, a hike below which is possible only under extraordinary circumstances with the withdrawal of ether by 1,500, the dominance of alcoins by 7.5% or the assignment of the monitoring tag. Given the current oversold conditions and high targets, assigning the tag will only give a temporary departure below 0.035 with further growth to 0.075, similar to vidt.
In addition to vib, among coins without the monitoring tag, so far I am considering only pda with a possible new wave of growth, especially if the tag is not assigned in the new month.
The coins that already have the monitoring tag are the most oversold on binance, due to which they have shown good growth impulses in the last two weeks against the background of attempts to reverse the quarter. Before the next delisting announcement, there is time for new waves to reverse the current quarter under an optimistic scenario, as vidt shows, and a pullback already in the new quarterly candle. The most interesting scalping companies among this group today are uft troy alpaca with a growth potential of up to 100%+ and cream nuls with a possible growth of up to 50%+.
ETHUSD ETHEREUM Long in short termVery hard week for ETHEREUM:
In my opinion eth has a good chance at this level to climb higher
It has nearly brokeen every possible support,but nobuilding signs of deivergences.
The strategy is short term
Never the less ,Trump´s policy is not good nor for crypto neither for other markets.
And thereforwe should think only in short term,taking chances.
On monday /tuesdays positive ton of the white house,on wed/ to Friday aggressive tons,at the weekend then again taming tone of the white house.
This will accompany us until 2029.
Ofcourse it wont be easy.For no one.
Therefor i make 5-10 different strategies,different apporches.
In case the profit targets hit,then its is ok.If not I immediately cut the positions.
STop is below themajor support.
If that level breaks,ETH will potentially fall to 1100-1250. Idont hope,that it happens.But these days,I expect always the unexpected.You may do this,too.
Position sizing: depends on your risk appetite.
I would use stops in any case....Good luck
Jambo update!!BYBIT:JUSDT.P
An update on jambo, i pasted the screenshot of my first interest on the chart so you guys get a better idea of what im talking about. I would keep this in mind as it gives a good example of what patience looks like.
We are down at a price that looks great, now it would make sense to wait for a reaction at this deep support zone on the weekly chart... if the 4hr from here reacts nicely, ill be watching for a retracement to snipe from the 15m.
Ill update again, I've only got two outcomes!!

Ethereum’s Rebound: V-Shaped Surge to an October 2025 PeakI have come today with a new ETH perspective, one that I think is more accurate than my last ETH TA.
Take a look here at how I got this one wrong, mainly because I was counting too much on this diagonal support to hold. Why didn’t it hold? Because there were too many traders looking at it, and when too many people are watching, the opposite happens, and it breaks.
I would advise looking at this TA first before you carry on with this one because the two tie together neatly.
My view is that from here, we will start a V-shaped recovery that will send ETH to $15,000–$18,000 by mid-October 2025. There is a very interesting fractal playing out that I discovered.
So, my alarm went off with this "Wyckoff Spring" indicator. It has only fired off two other times in history: once at the bottom of the COVID crash and the other time at the December 2016 bottom when ETH was just $8. So, I thought, well, let’s take a look to see if the first cycle has anything interesting.
As soon as I flipped to the daily chart, I immediately saw similarities. What if ETH is forming the fractal from the first cycle before the massive run-up? The timeframe and the drawdown percentages are nearly the same, the fractal is nearly identical, and the fact is, the Wyckoff Spring has fired off now, forming this fractal like in 2016. What are the chances…?
When you overlay the fractal, it lines up with mid-October 2025.
I have scanned the entire history of ETH, and I cannot find a fractal closer to this one. This could very well be the pico bottom for ETH this year.
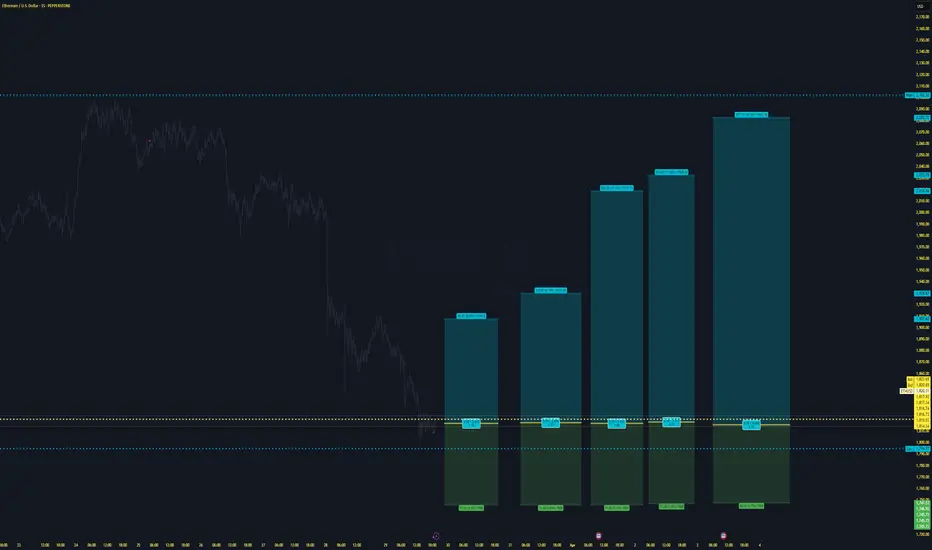
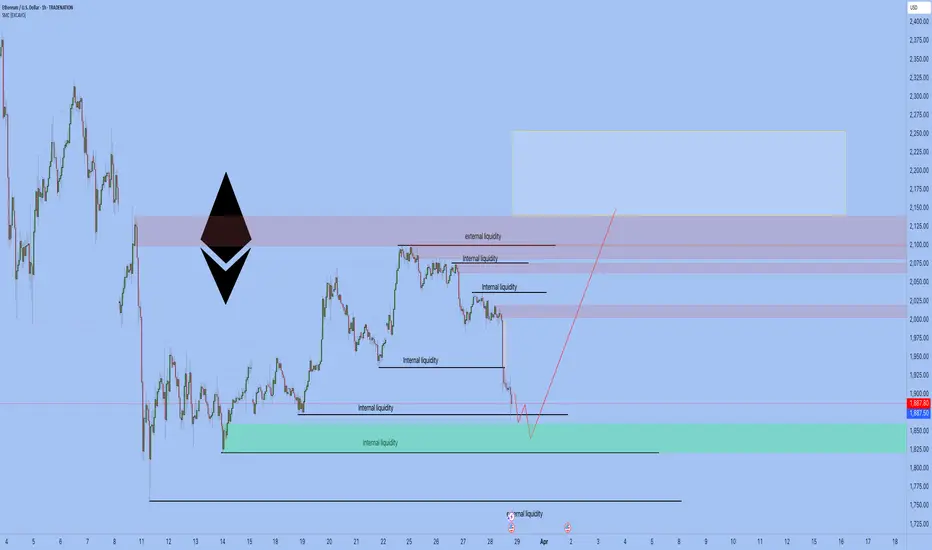
ETHUSD Ethereum update 28.03.2025We have reached several Internal liquidity
from this zone, waiting for an upward reaction within 2-4 days.
Best regards EXCAVO
Ethereum - take trades at key levelsEthereum - take trades at key levels
Long at 1820, 1750 and 1950 in a case of structure breakout
best short at 1950 or at 2150


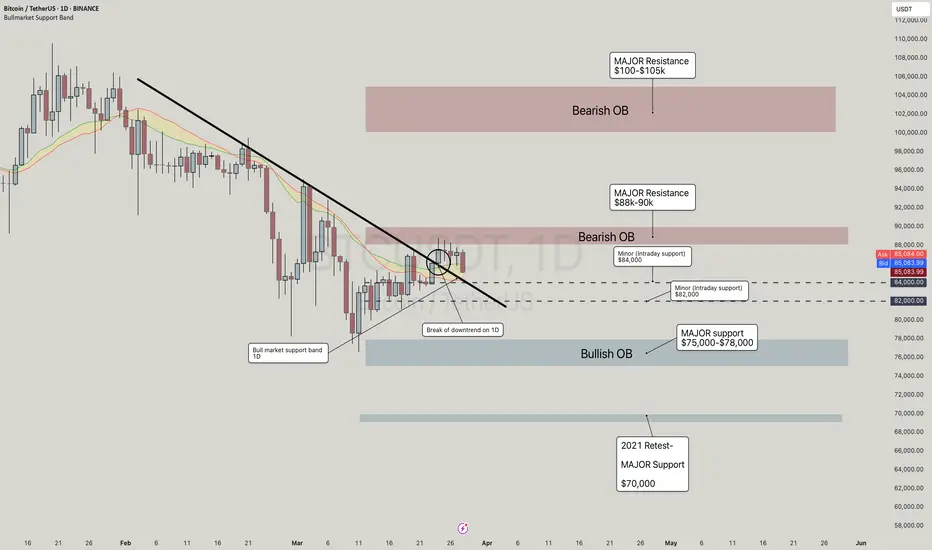
BTC - What's next BTC Update – March 28, 2025
Quick update on where BTC is at and what I’m watching next.
We finally broke out of that daily downtrend — nice little shift in structure. Price is chilling around $85K right now, sitting just below that FWB:88K –$90K resistance, which is still a pretty strong zone to crack.
Key Levels I’m Watching:
🔴 Major Resistance:
FWB:88K –$90K – First big test. If bulls push through this, could get spicy.
$100K–$105K – Big macro level. Expect sellers to step in heavy here if we make it that far.
🟢 Major Support:
$75K–$78K – Solid higher timeframe support zone. Great bounce area if we dip.
$70K – 2021 ATH retest level. Would still be macro bullish unless that breaks.
🟡 Local Zones:
$84K – Acting as intraday support for now. Holding this could lead to a push higher.
GETTEX:82K – Another local support. If that breaks, next stop is probably mid/high 70s.
What I’m Thinking:
As long as we hold $84K, we’ve got a shot at pushing into FWB:88K –$90K again. Break that and it’s game on toward $100K+. But if we lose $84K and especially GETTEX:82K , I’m watching for a retest of the $75K–$78K zone. That’d still be a healthy pullback, nothing to panic about.
All in all... structure looks solid, levels are clear, let’s just stay patient and let price do its thing. I’ll keep you all posted if anything major changes 🔔
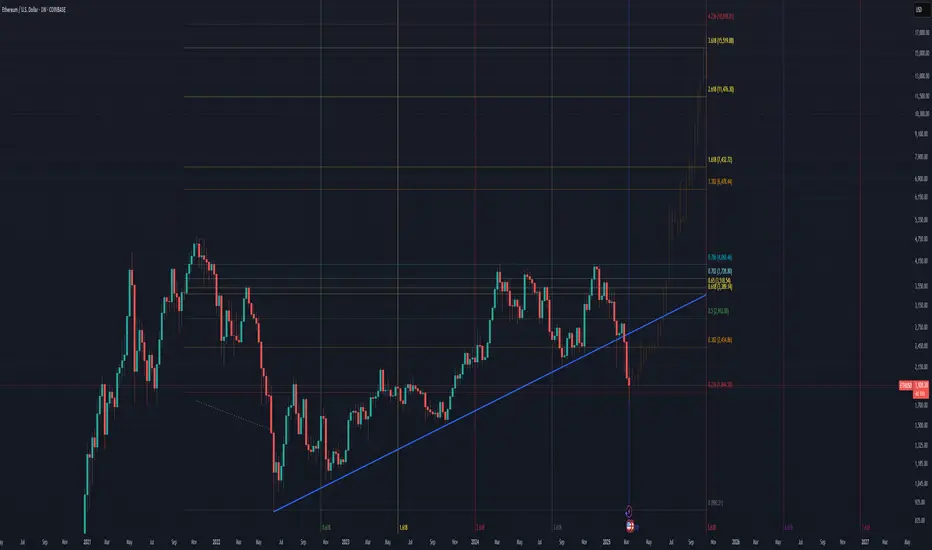
ETHEREUM Ascending Triangle bottomed and is targeting $4700.Ethereum (ETHUSD) hit 2 weeks ago the bottom (Higher Lows Zone) of its 4-year Ascending Triangle pattern, following the recent 3-month correction. That correction has technically been the pattern's Bearish Leg and during those 4 years we've had another 5 similar to this, all with the exception of one, producing a Higher High.
This is actually more similar to the October 09 2023 and June 21 2021 bottoms, so at worst we should get a +168.44% rally from here that will interestingly enough test the Triangle's top (Resistance Zone) a $4700.
-------------------------------------------------------------------------------
** Please LIKE 👍, FOLLOW ✅, SHARE 🙌 and COMMENT ✍ if you enjoy this idea! Also share your ideas and charts in the comments section below! This is best way to keep it relevant, support us, keep the content here free and allow the idea to reach as many people as possible. **
-------------------------------------------------------------------------------
💸💸💸💸💸💸
👇 👇 👇 👇 👇 👇

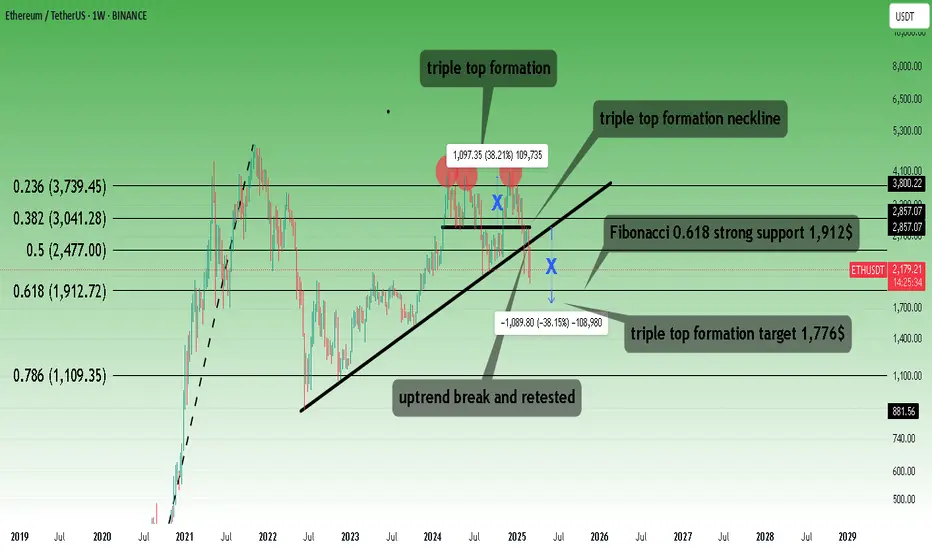
Ethereum targetting 1,912$ or 1,776$I see here 2 possibilities.
First look at the uptrend break and retested. Therefore, it may drop to a lower Fibonacci level which is 1,912$
The other option is the triple top formation target which is around 1,776$
* What i share here is not an investment advice. Please do your own research before investing in any asset.
* Never take my personal opinions as investment advice, you may lose all your money.
The Global BTC Shake out is coming before 1 million BTC in 2037I believe it worth stating that we might be in a moment where bitcoin is gonna shake everyone out and make everyone sell or at least all those who think 1 million BTC is coming soon. The great Bitcoin reset cycle will occur eventually before true mass adoption... we could very well retest $15,000 as bottom sometime next year.. if true BUY and hodl and invest consistantly for a whole decade and reap the reward of a 1 million bitcoin probably in 2037-38 and Bitcoin by then will be nearly on par with golds market cap by then or below it. And youll become among the weathiest of the wealth.
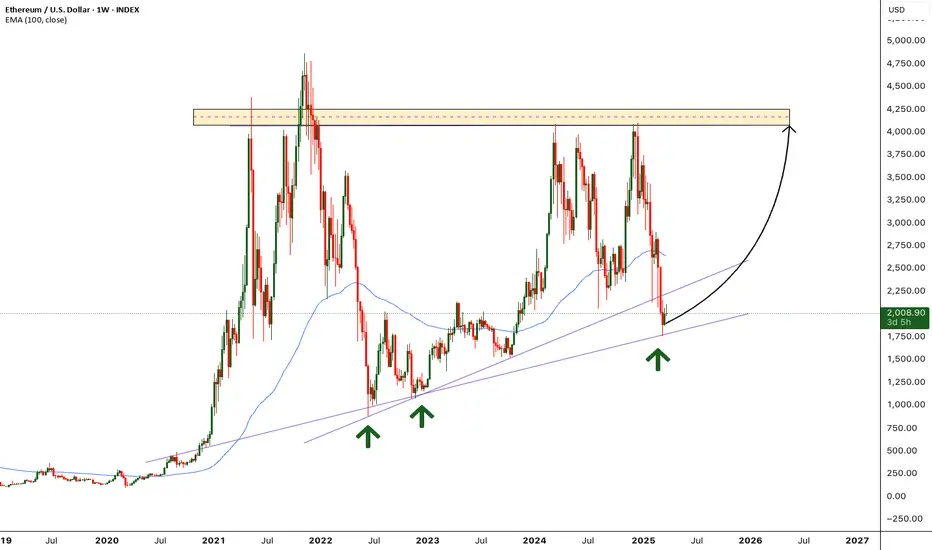
ETH - Will the support hold ?CRYPTO:ETHUSD (1W CHART) Technical Analysis Update
ETH is currently trading at $2007 and showing overall bullish sentiment after hitting the support. We are seeing minor retracement from the support zone. If this support holds we can expect bullish trend and reach the resistance around 4k. New ATH for ETH depends on breaking the resistance around previous ATH.
Follow our TradingView account for more technical analysis updates. | Like, share, and comment your thoughts.
Cheers
GreenCrypto