ETH at Critical Resistance + Liquidation Zone | Time to Short?Today I want to analyze Ethereum ( BINANCE:ETHUSDT ) on the 1-hour time frame . Is there a short position opportunity?
Please stay with me.
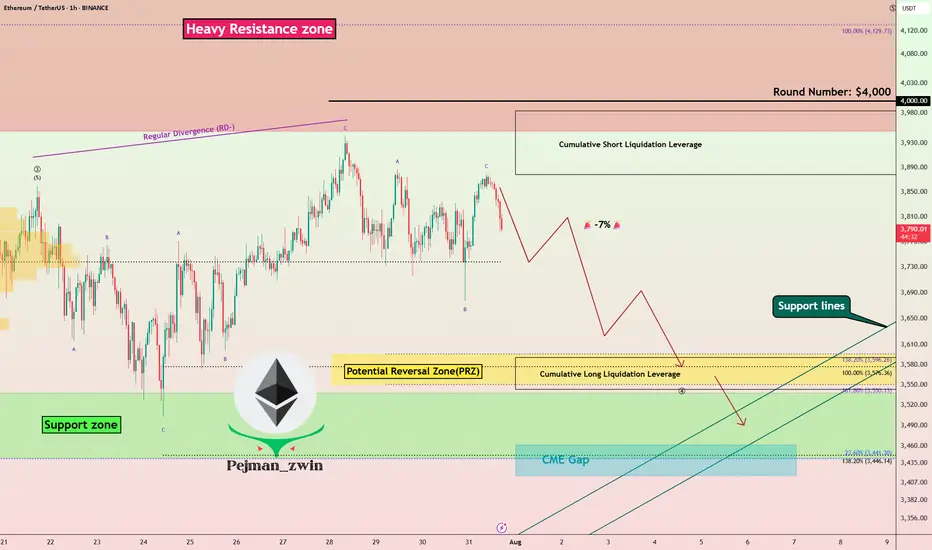
Ethereum is currently trading near a Heavy Resistance zone($4,390-$3,950) , Cumulative Short Liquidation Leverage($3,983-$3,878) and the $4,000 ( round number ). $4,000 could be a psychological number to sell .
In terms of Elliott Wave theory , Ethereum appears to have completed the main wave 3 at $3,860 and is currently completing the main wave 4 . The main wave 4 could have a Double Three Correction(WXY) or Expanding Flat(ABC/3-3-5) , with the Expanding Flat structure being more likely .
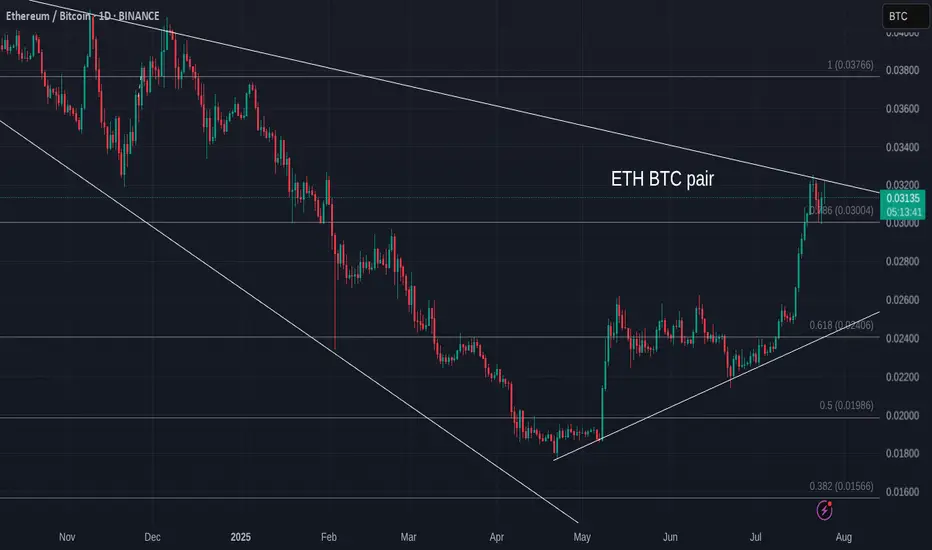
One of the reasons why shorting Ethereum could be better than shorting Bitcoin right now is that ETHBTC ( BINANCE:ETHBTC ) is currently trading above the ascending channel and is likely to correct to Fibonacci levels .
Also, we can see the Regular Divergence(RD-) between Consecutive Peaks.
I expect Ethereum to drop to at least the Potential Reversal Zone(PRZ) and attack the Support lines ( Second target ) .
Cumulative Long Liquidation Leverage: $3,591-$3,543
CME Gap: $3,461-$3,417
Note: Stop Loss: $4,023
Please respect each other's ideas and express them politely if you agree or disagree.
Ethereum Analyze (ETHUSDT), 1-hour time frame.
Be sure to follow the updated ideas.
Do not forget to put a Stop loss for your positions (For every position you want to open).
Please follow your strategy and updates; this is just my Idea, and I will gladly see your ideas in this post.
Please do not forget the ✅' like '✅ button 🙏😊 & Share it with your friends; thanks, and Trade safe.
ETHBTC
The next levels for Solana coinIn this video I recap the previous video and discuss what may be next after the current retracement .
I reveal some important levels that sit below as well as the relationship with the Eth/Btc chart.
Tools used vwap, Fibs and volume profile .

Bitcoin Versus ETH daily charts- one is VERY BULLISH
No Guesses which one.
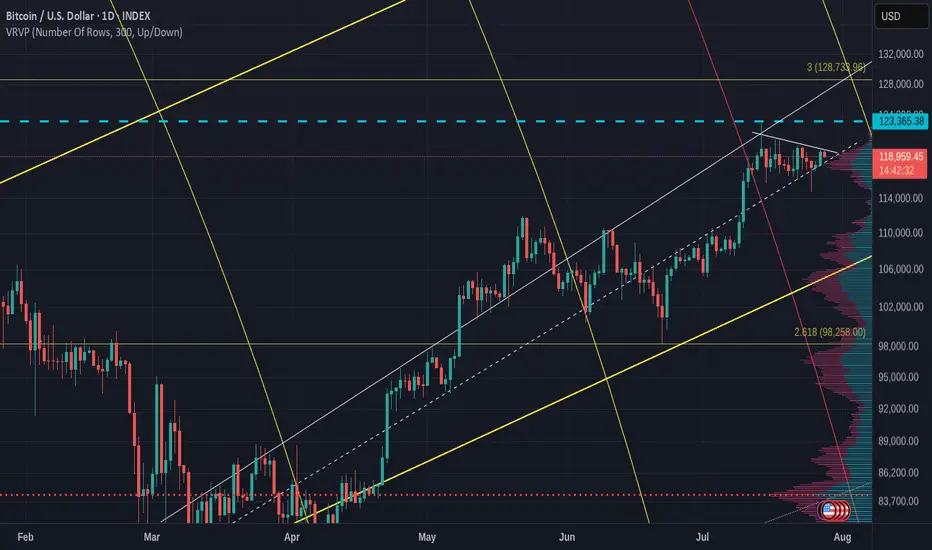
Bitcoin printing a Bullish pennant on the daily with the Apex late this Wednesday, After the FED tell us what they are doing with interest rates
PA always reacts before the Apex.
ETh on the other hand, is under a Huge area of long therm resistance and running out of steam
If we zoom out to the weekly, we can see how long this line has rejected PA
My money remains in Bitcoin, whihc has also made gains over the weekend.
And is highly likley to remain there
ETH/USDT (Monthly) – Symmetrical Triangle BreakoutPattern & Technical Setup
Ethereum (ETH/USDT) is showing a textbook symmetrical triangle pattern on the monthly chart. The pattern has been developing since the 2021 high, with lower highs converging with higher lows.
The current candle has broken out above the triangle’s upper trendline, suggesting a potential bullish continuation. This breakout is significant given the long consolidation period and strong volume profile near the breakout zone.
Trade Plan
• Entry: Around $4000 on confirmed monthly close above triangle.
• Stop Loss: Below $3,500 (safe side under breakout + previous support).
• Profit Targets:
$4,800 (measured move target based on triangle height)
⸻
Risk & Reward
• Risk: ~17% downside (stop at $2,950)
• Reward: ~253% upside to $4,800
• R/R Ratio: ~14:1 (favorable for swing trade)

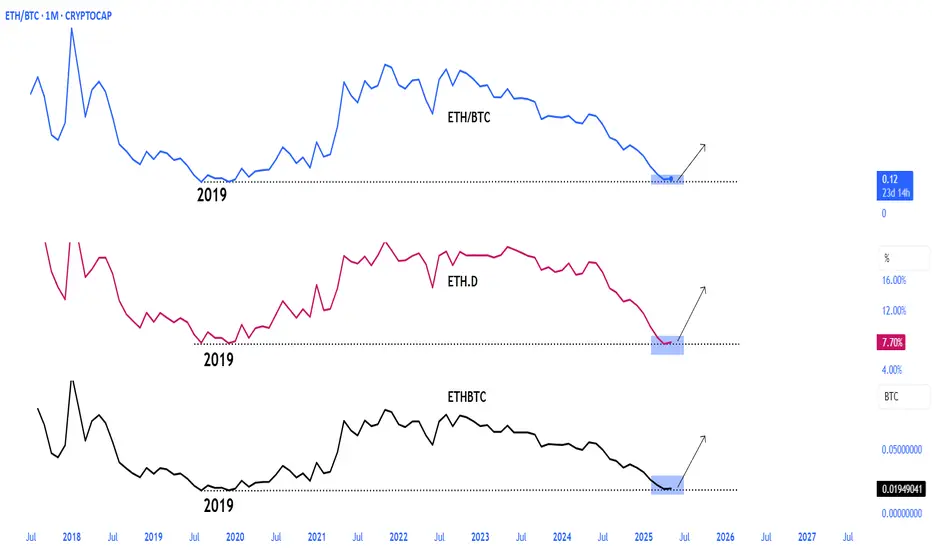
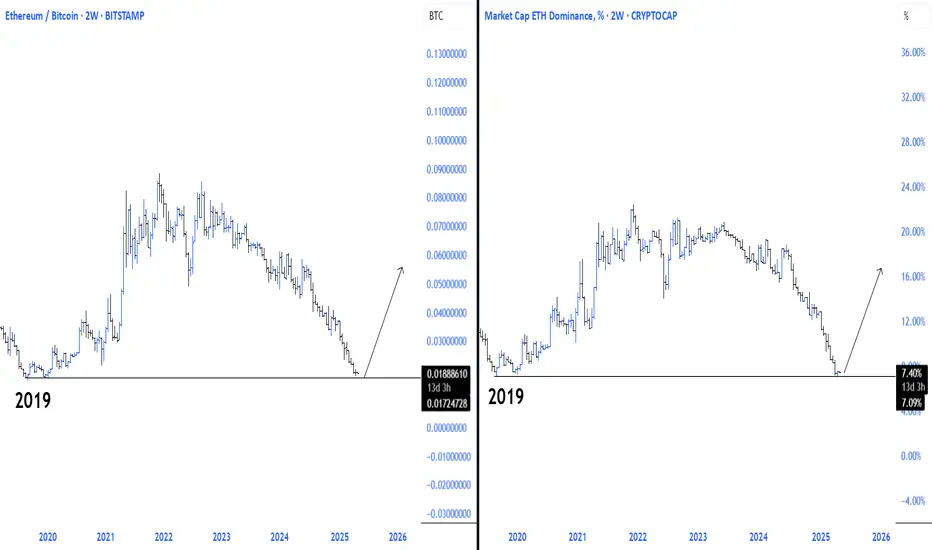
Ethereum Bitcoin pair bottom confirmed!As confirmed by CRYPTOCAP:ETH \ CRYPTOCAP:BTC momentum, we can say that a local bottom was seen at 2019 accumulation levels. With a major reversal from the current region, we can see major movements across Altcoins, with Ethereum being an undeniable leading force and leader for altcoins.

ETHBTC x ETH.DETHBTC x ETH.D
Ethereum bitcoin pair and ethereum dominance will gain upward momentum with the reaction it receives from the major support line in 2019
The better Ethereum is, the better Altcoins will be.
ETH Versus BTC - Daily Update - Bitcoin still winning
As mentioned yesterday, ETH has hit long term resistance and got rejected....and it is happening again
ETH seems unable to find the moemntum just yet.
The MACD Daily is still turning Bearish
The Daily RSI is also up high and likely to fall
The weekly RSI is also high though the Weekly MACD has still yet to rise above Neutral
All in All, for me, it is NOT the time....Though we can see that ALTS are running Hot though not a full ALT season as we have seen in the past.
It is fragile...please remain CAUTIOUS
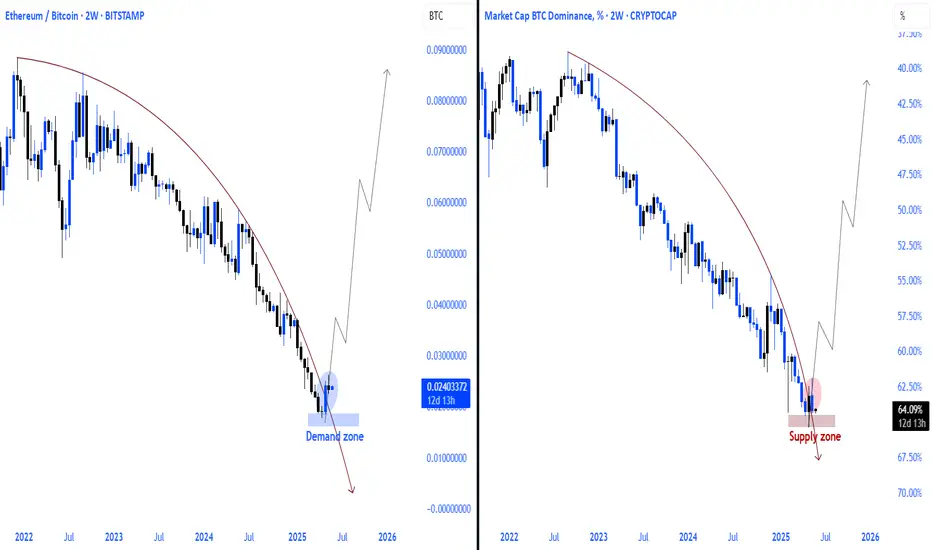
ETH/BTC vs btc dominanceethereum received a reaction as we expected from the current demand zone in the bitcoin pair, and it seems inevitable that the upward momentum from the current area will continue. on the bitcoin dominance side, the same situation exists, but I think we will witness a bearish absolute process.
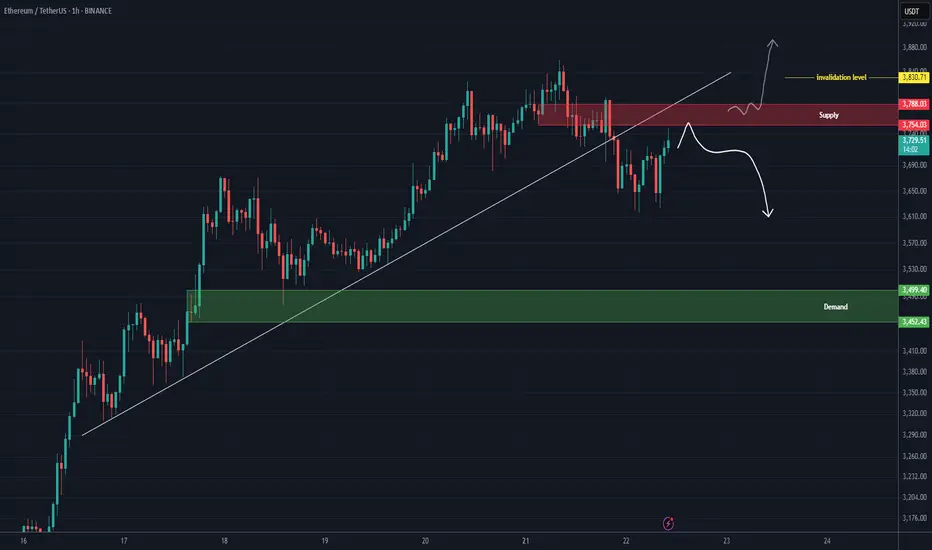
ETH analysis (1H)A trendline has been broken, and a resistance zone has formed on the chart. As long as Ethereum fails to hold above the red zone, the price may experience a drop.
The green box can be considered the target.
If the price stabilizes above the red zone and a daily candle closes above the invalidation level, this analysis will be invalidated.
For risk management, please don't forget stop loss and capital management
Comment if you have any questions
Thank You
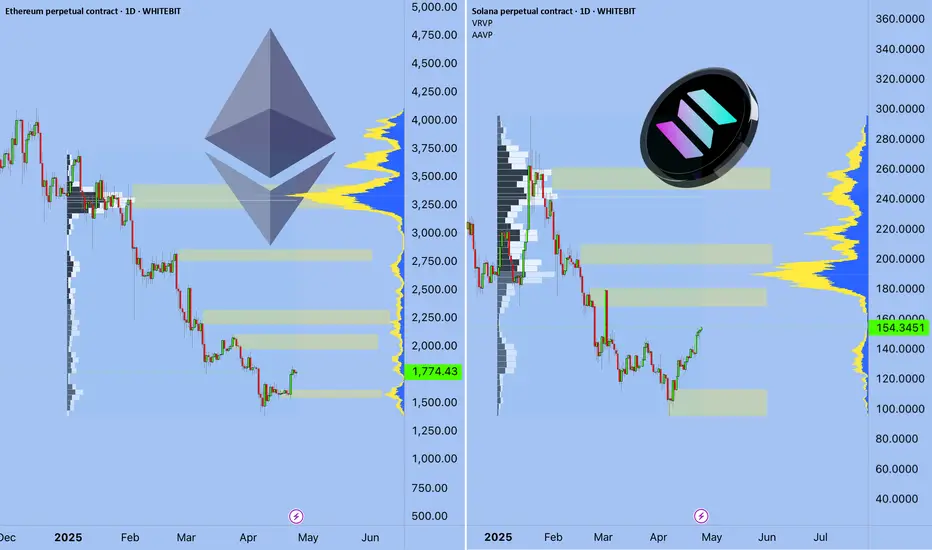
Ethereum vs SolanaIn 2025, the competition between Ethereum and Solana is no longer just a rivalry — it’s a pivotal chapter in blockchain evolution.
We are witnessing a clash of two philosophies:
Ethereum — maturity, security, and deep ecosystem
vs.
Solana — speed, efficiency, and adaptability.
📈 Price Resilience vs. Market Legacy
While Ethereum still holds the crown in market cap and institutional trust, Solana is rewriting the rules with superior transaction speed and cost-effectiveness.
The question is no longer "Who is better?"
It’s "Who is evolving faster?"
⚡ Key Drivers Shaping the Ethereum-Solana Rivalry
1️⃣ Scalability vs. Stability
Solana leads with up to 65,000 TPS, attracting high-frequency traders, NFT creators, and DeFi innovators.
Ethereum, relying on its Layer-2 solutions, tries to balance security with scalability.
2️⃣ Institutional Shifts
Funds like Galaxy Digital and Ark Invest are reallocating capital towards Solana, betting on efficiency and growth.
Ethereum, meanwhile, is waiting on ETF approvals to regain momentum.
3️⃣ Technological Innovation
Ethereum focuses on sharding and Layer-2 expansion.
Solana pushes aggressive ecosystem growth but pays the price with occasional network instability.
📊 Market Performance Snapshot — 2025
Ethereum: ▼ 56% YTD | ~$1,600
Solana: ▼ 40% YTD | ~$135
Solana’s DEX market share jumped to 39.6% in Q1, driven by meme coins and retail traders.
Ethereum’s dominance continues to erode under macro pressures and rising competition.
But don’t be fooled — Ethereum's foundation remains strong. Institutional adoption and infrastructure upgrades still offer potential for a rebound.
📉 ETH/BTC Looks Like a Meme
ETH/BTC:
SOL/BTC: Potential -50% in next 160 weeks ➡️
ETH/SOL:
⚡ Where Did the Liquidity Go?
The real question isn’t why ETH is dropping —
It’s why no one cares.
Layer 2 solutions — Arbitrum, Optimism, Base — have drained liquidity from Ethereum’s mainnet.
DeFi activity? → Migrated to L2
Users? → Choosing lower fees and speed
Ethereum L1? → A blockchain for whales and archives
No liquidity = No rally
No narrative = No attention
Funds are betting on Solana and L2, not Ethereum’s base layer.
🎯 When Could ETH Take Off?
Only if we see:
A strong “Liquidity Returns to L1” narrative (RWA could be a trigger)
Spot ETH ETFs launching with institutional accumulation
A new DeFi wave on L1 (unlikely with current gas fees)
Or simply — when the market decides to pump forgotten assets
For now, Ethereum is about patience.
Smart money is flowing into L2, Solana, and high-risk narratives.
🕒 But Time Will Tell...
Today, we debate ETH vs. SOL.
Tomorrow — the bull market ends, and we’ll be discussing entirely different narratives.
Are you SOL or ETH?
As always, stay one step ahead.
Best regards,
EXCAVO
______________________________
Disclosure: I am part of Trade Nation's Influencer program and receive a monthly fee for using their TradingView charts in my analysis.
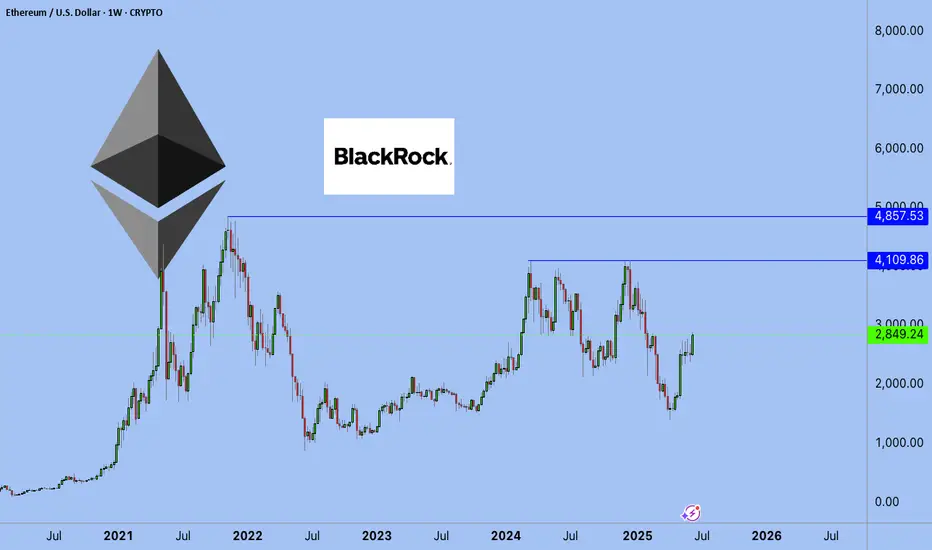
ETHEREUM: THE NEW BOND OF THE DIGITAL WORLDPrice isn’t the goal. Price is the side effect.
Meanwhile, BlackRock - a black hole with a trust-backed logo - just absorbed 42,000 ETH more.
Yesterday, you may have read this "regular" headline:
BlackRock increases its Ethereum exposure to $4 billion, adding $109.5 million via ETFs.
But here’s what you missed: there are no random numbers on the market.
When a player like this moves - it’s not hype. It’s a blueprint for the future.
Ethereum is no longer an altcoin.
It’s no longer speculation. It’s a financial infrastructure, already recognized by law, exchanges, and institutions.
What does this mean?
💡 Ethereum is now a digital bond - with yield flowing from blocks.
Profit is no longer built on promises, but on the structure of the chain itself.
Trust lies not in faces, but in code.
Growth is not artificial — it’s architectural.
And here’s why this is terrifyingly beautiful:
While you sleep, they are building an era.
Each ETF purchase removes ETH from circulation - permanently. Because:
✅ This ETH is gone from the open market
✅ It won’t be panic-sold
✅ It becomes income-bearing collateral, not a speculative asset
Still waiting for an entry signal?
The big players are already in.
This is no longer crypto - this is cash flow infrastructure, embedded into the digital economy.
And when pension funds, insurers, and sovereign investors move into Ethereum - they will come via ETFs.
Not because it’s trendy, but because it’s regulated, stable, and profitable.
📉 When institutional demand meets vanishing supply - the price won’t simply rise. It will explode, not as growth, but as a structural liquidity shift.
Ethereum is:
💸 Staking = passive yield
🔗 Backbone of DeFi
🖼 Fuel for NFTs
⚙️ Millions of transactions per second
⚖️ A regulated ETF asset
This is the new digital bond system, where the bet isn’t on the dollar - it’s on ETH as an income-producing asset.
💥 While you're reading this, the game is already on.
ETFs are rewriting the rules of time-ownership.
No hype. Just filings. Just intention.
Best regards EXCAVO
Strong Breakout for AltsBig breakout for the altcoins on this chart
It seems the bull market is starting, right now i think that XRP is the front of this race.
Great buy right now on this weekly
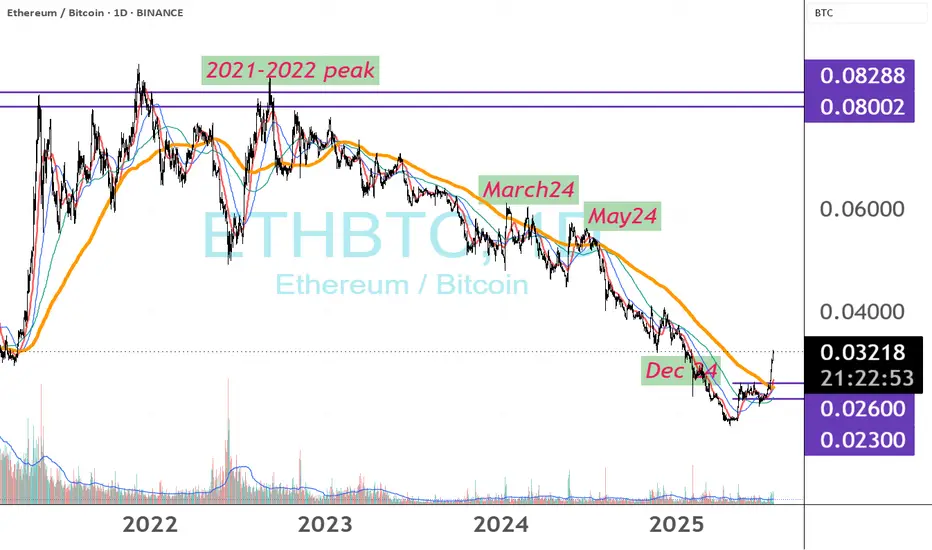
ETHBTC , what if?ETH/BTC has just pushed above 0.026 on the 200‑day MA, indicating ETH’s relative strength against BTC, despite ETH still trading under $4,000.
Unlike the $4,000 rallies in March, May and December 2024—when ETH/BTC never truly broke out—this move shows genuine outperformance.
If Bitcoin holds at about $120K, revisiting the 2021–22 ETH/BTC high would put ETH near $9.6K.
Historical peaks for reference:
2018: ETH/BTC ≈ 0.12 → ETH ≈ $14,400
2017: ETH/BTC ≈ 0.15 → ETH ≈ $18,000
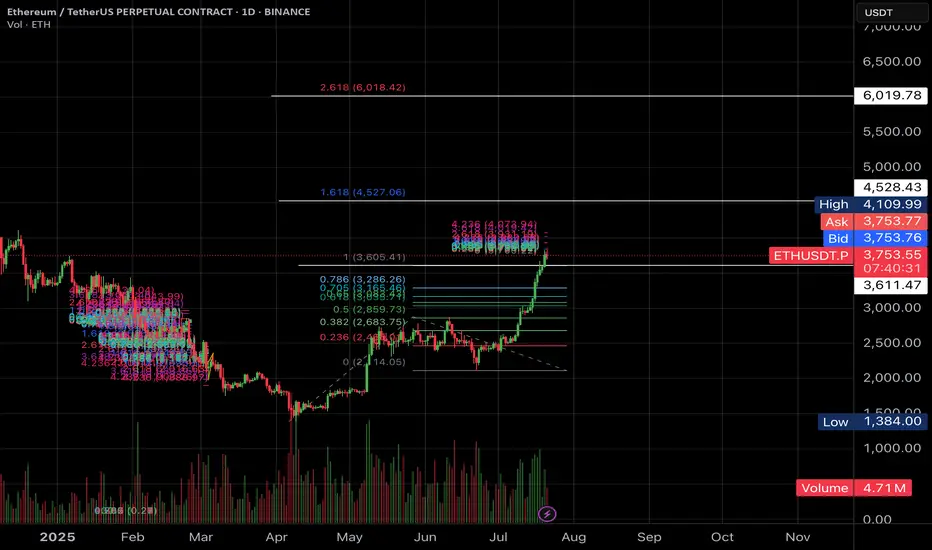
$6000 worth ETH?Hi Padawans,
ETH is showing strong bullish momentum, currently trading around $3,766. If it breaks above the resistance near $4,500–$4,900, the 2.618 Fibonacci extension points to a potential target around $6,000.
Best Regards,
CryptoObi
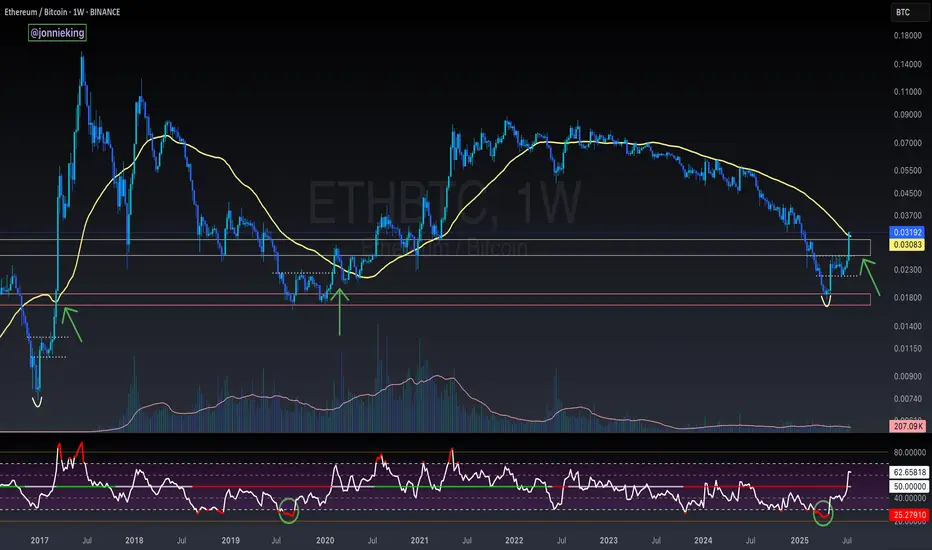
$ETH Closes Above the 50WMA - Alt Season Signal ALT SEASON ALERT 🚨
CRYPTOCAP:ETH Closed the Week ABOVE the 50WMA
Historically this has signaled the start of ALT SEASON.
*NOTE* 2020 had the pandemic hiccup.
This bottoming pattern looks very similar to the 2017 explosion.
Also the RSI matches the 2019 bottom.
Dare I call it yet bros? 🤓
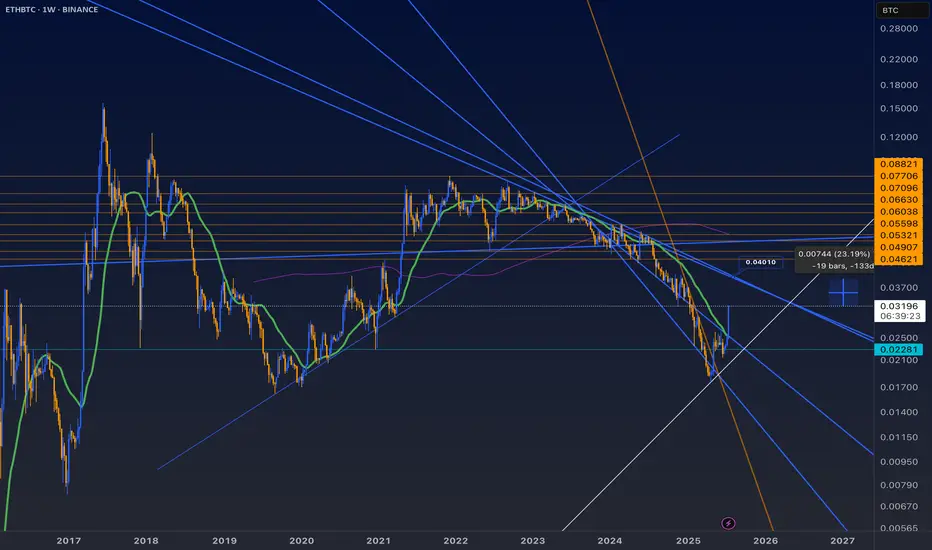
ETH/BTC 25-7-20I think there’s some clear headroom for more movement to 0.40 Ethereum per Bitcoin. Let’s see but right now is hot. Then the support after the 0.400 resistance is hit is back at 0.22, but who know what the price of Bitcoin would be at that point.
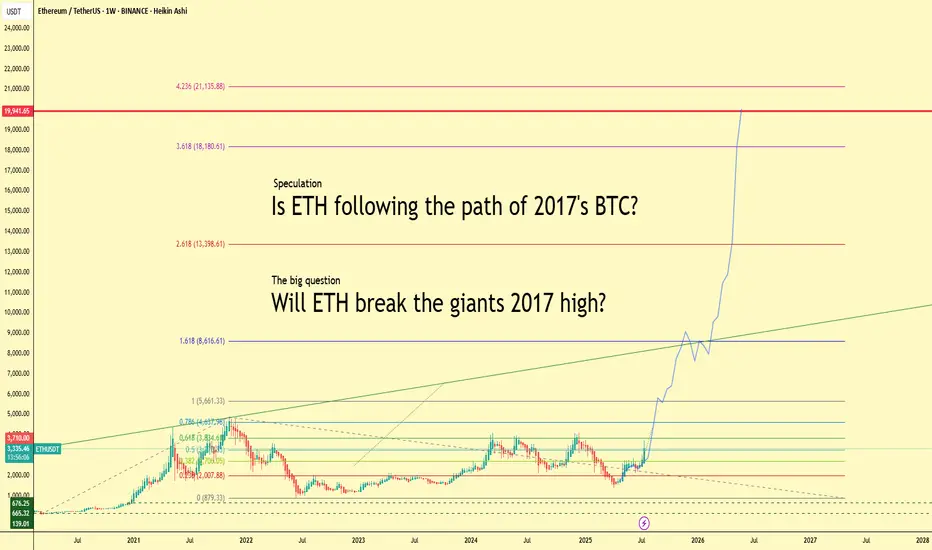
Will ETH Follow BTC’s 2017 Path? $20K in Sight?Ethereum is heating up — up more than 20% this week and currently trading above $3,300. But what if we told you this might just be the beginning?
This chart explores a bold yet exciting speculation:
👉 Is ETH repeating Bitcoin’s legendary 2017 run?
Back then, BTC went from obscurity to global headlines, smashing through $1k, then $5k, then $10k… and eventually peaking just below $20,000. Ethereum might just be lining up for a similar parabolic path.
🚀 Fibonacci Levels Say: Sky’s the Limit
The chart projects Fibonacci extensions up to:
1.618 = $8,600
2.618 = $13,400
3.618 = $18,180
4.236 = $21,135
Notice the key level: $19,941. That’s the legendary BTC high of 2017. Will ETH match or even surpass that milestone?
🧠 The Big Question:
Can ETH become the new “giant”?
While Bitcoin still leads the narrative, Ethereum’s ecosystem, real-world adoption, and institutional attention have never been stronger.
💬 Let’s Talk
Do you believe Ethereum is set to break $20K this cycle? Or is this just hopium and lines? Share your thoughts and let's compare notes.
#Ethereum #ETHUSDT #Crypto #Altseason #BTC2017 #Fibonacci #Bullrun #ETHBreakout #Parabola #CryptoSpeculation
Is Your Altcoin on the Chopping Block?-Update: Originally posted on July 8, 2025… but swiftly vanished into the void by a moderator (rookie mistake—I neglected the sacred posting rules). Turns out, publishing has rules… that I did not interpret accurately?
To my loyal circle of 5 followers: if this feels like déjà vu, my sincerest apologies for the rerun. But with the winds shifting and the drums beating for alts season, I figured it was worth a resurrection.
Let the thrills—and the calls—begin. 🎭📈
Whenever you see “-Update:” that’s the latest as of today — 07/18/25.
Is Your Altcoin on the Chopping Block? 🪓
Brace yourself—this might sting.
Odds are, your favorite altcoin is walking a tightrope. And while I’m not here to spread doom, I am here to give you a wake-up call. Don’t shoot the messenger.
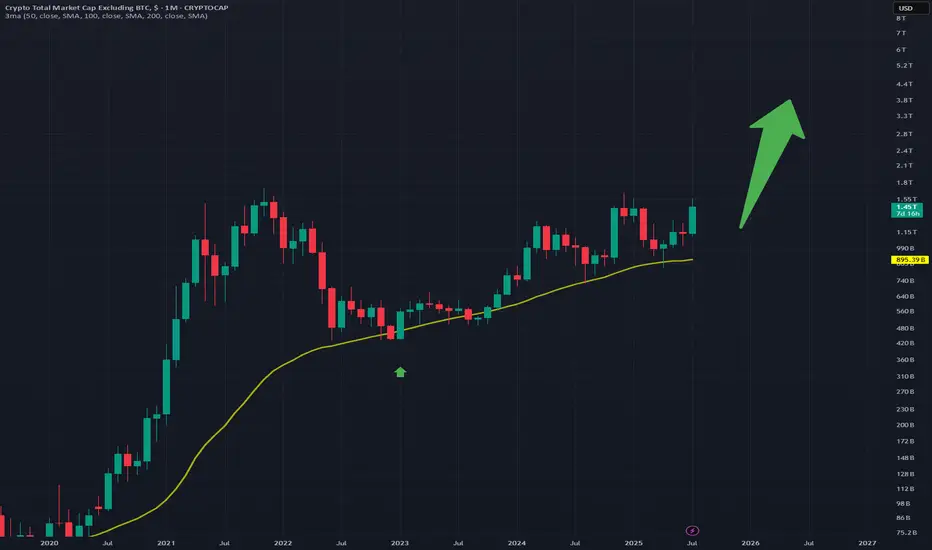
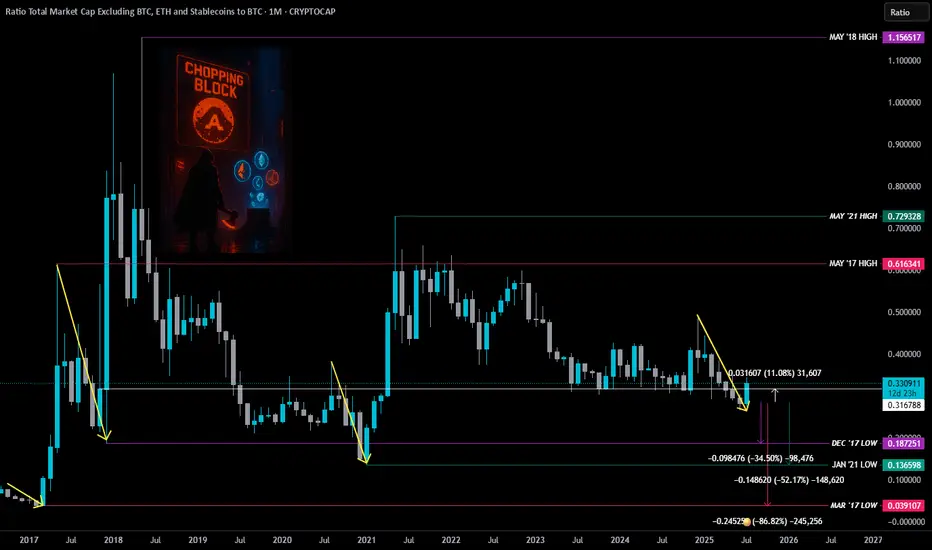
TradingView recently dropped a chart that cuts through the noise: Total3ESBTC.
It’s a ratio of the Total Crypto Market Cap (minus BTC, ETH, and stablecoins) to Bitcoin.
Translation?
👉 A clear, undistorted look at how the altcoin market is actually doing—without ETH clouding the view or stablecoins muddying the waters.
Think of it like night-vision goggles for spotting altcoin strength—or weakness—in the shadows of BTC dominance.
Perfect tool to sniff out market rotation—that sweet spot where Bitcoin hands the baton to alts or rips it back.
So why should you care?
Because the writing's on the wall... and most altcoins might not survive what's coming.
Let’s break it down:
ZOOMED OUT – MONTHLY VIEW 🔭
Before every major altcoin run, there’s always a major low.
You’ll notice three big ones:
🔴 March 2017 (Pink Line)
🟣 Dec 2017 (Purple Line)
🟢 Jan 2021 (Green Line)
Yes, some individual alts have pumped. A few even went full parabolic.
But if altcoins as a whole were ready to fly? They would've taken off already.
-Update: Yes, they finally did it this week… but hold that excitement—there’s more to the story.
Instead, the altcoin ratio broke a critical support (White Line) back in May... and even closed below it. That’s not bullish—it’s a red flag flapping in the wind.
– Update: We just sliced through that white line, but for most alt’s to stay strong, we need a monthly close above it.
Strangely enough (or coincidental, if you believe in coincidences) ...
🗓️ All the major altcoin market highs happened in MAY.
Not once. Not twice. Every. Single. Time.
🔴 May 2017
🟣 May 2018
🟢 May 2021
Call it coincidence. Call it cycle magic.
Maybe it’s a message from the crypto gods—and they don’t whisper for no reason.
So if we just had another May, and the ratio is still sliding with no reversal in sight… ask yourself:
Was that the high?
Or are we still heading toward the low that resets the board?
Here’s the hard pill 💊
If altcoins are ever going to go up again, odds are they’ll need to hit one of these historical lows first.
That’s not a prediction. It’s just how the markets have moved before major alt run.
📉 That means more pain ahead.
We’re talking potential drops of:
🔻 -32% to revisit Dec '17 levels
🔻 -51% to retest Jan '21 lows
🔻 -85% if we go full wipeout to March '17
Harsh? Yeah.
But better you hear it now than wonder “what happened?” when the floor caves in.
The worst part?
Most won’t believe this until it’s already too late.
-Update: Those lows haven’t been tested yet—might be wise to hold off on loading your bags to the brim. Patience pays.
Now here’s the uncomfortable twist:
There’s a legit case to be made that we may never see another “real” alt season again.
Why?
🪙 Liquidity is being siphoned by stablecoins
📈 Speculation is migrating to AI stocks
⚠️ Risk appetite is narrowing
Altcoins used to be the Wild West. Now? They’re the illiquid backyard of a global casino.
BUT… Let’s put on our degen-tinted glasses for a second.
Suppose the Fed hits the panic button:
🛩️ Rates cut
💸 QE returns
🚁 Helicopter money rains from the sky (not that they’d ever do that… right?)
– Update: Crypto Week is announced and broadcasted to the herd.
What happens then?
That’s when this chart—this ugly, broken, bleeding chart—might finally spring back to life.
– Update: Clearing those lows would’ve made this week feel a lot more convincing. But if you’re looking for signs of life—ETH/BTC chart might just be lighting the way. 🚀
Stay Sharp! 🐋R hUNTING!
THIS IS NOT FINANCIAL ADVICE. FOR EDUTAINMENT PUPOSES ONLY.
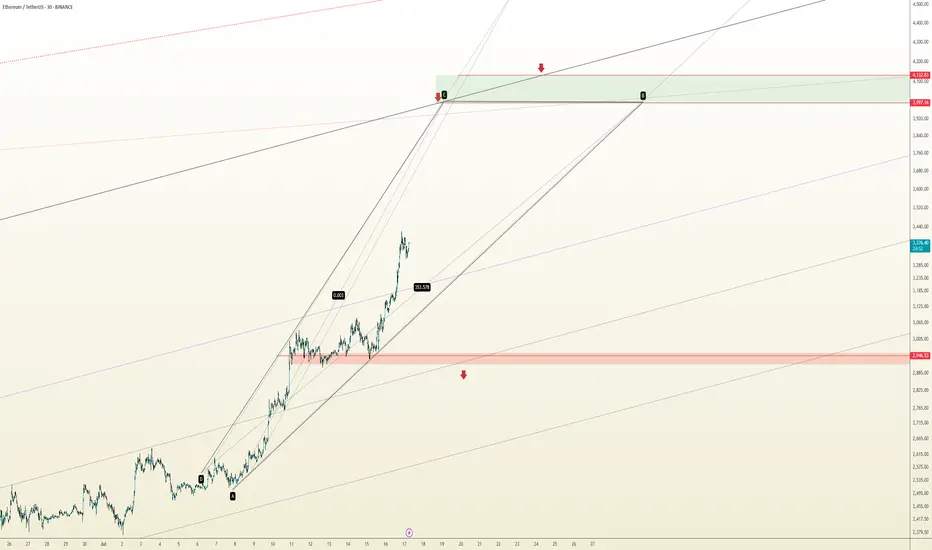
The Loudmouth Pattern: It Yells, We Trade!
On the 30-minute chart, ETH is forming a classic Broadening Formation – or as some traders like to call it, “The Big Mouth Pattern” 😄. It’s noisy, unpredictable at first glance, but when it speaks, you’d better listen.
Right now, price is moving through the bullish leg of this setup, and if momentum holds, we’re eyeing the $4,000 psychological level, followed by the $4,120 – $4,170 supply zone.
🔹 Bullish Scenario (our expected outlook):
🎯 Target 1: $4,000
🟩 Main Resistance: $4,120 – $4,170
❌ Invalidation: Confirmed close below $2,946
If price breaks and holds below that red support zone, this setup gets thrown out the window.
📊 Risk Management:
Scale in on pullbacks – if structure remains valid
No chasing without confirmation
Keep risk under 1% of total capital
📈 The market’s big mouth is open – and until it closes below $2,946, we’re listening for bullish signals. 🤑
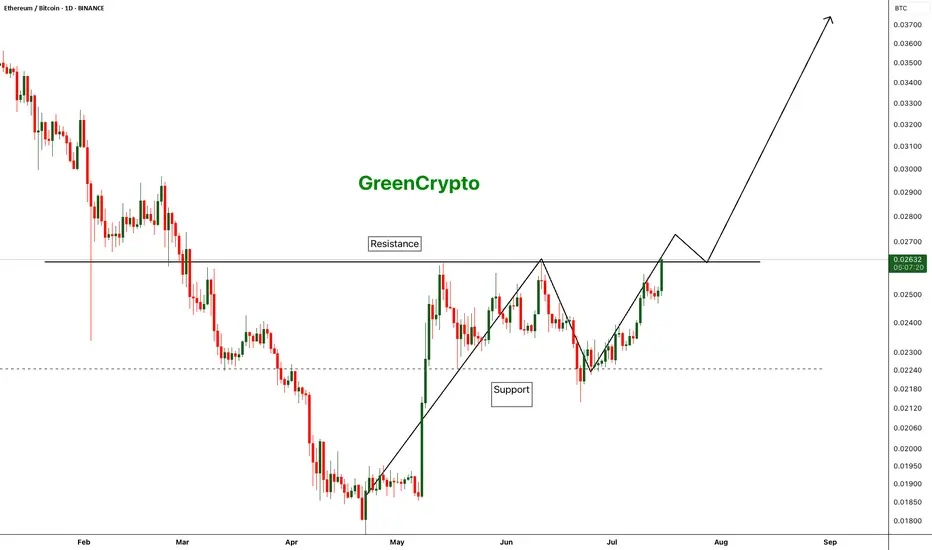
ETH/BTC - Finally Trend is reversing - After a long time we are finally seeing a change in the trend of ETH/BTC pair.
- Compared to BTC, ETH was underperforming for last couple of years and we are seeing some strength in ETH
- If this trend continue we can finally see some new ATH on ETH
Entry: 0.02633
StopLoss: 0.02125
TP1: 0.02825
TP2: 0.03168
TP3: 0.03592
Don't forget to keep stop loss. Stay tuned for more updates
Cheers
GreenCrypto
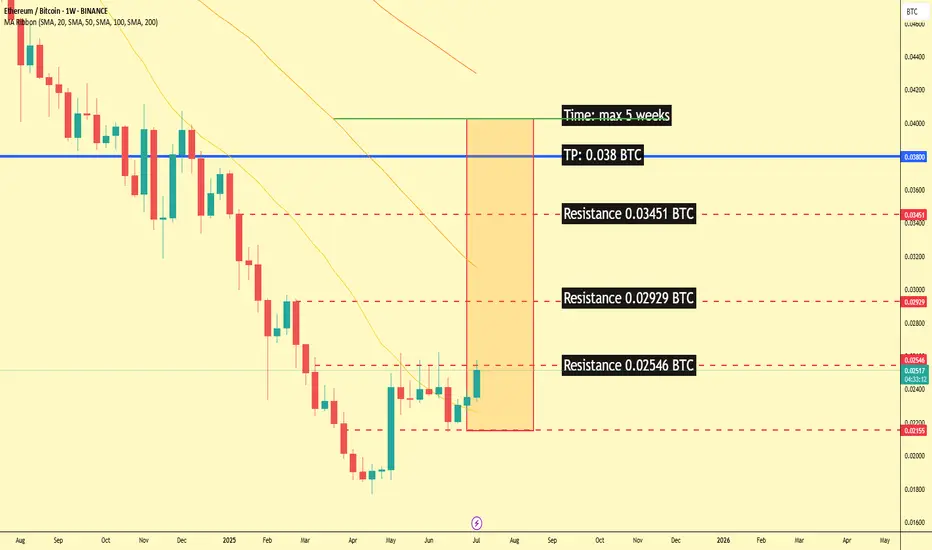
ETH/BTC Poised for a Breakout: A Technical and Fundamental ViewA confluence of technical signals on the weekly ETH/BTC chart, coupled with significant fundamental developments for both Ethereum and Bitcoin, suggests a potential upward move for the pairing in the coming weeks.
Technical Analysis (TA)
The weekly chart for ETH/BTC on Binance reveals a potential bottoming formation after a prolonged downtrend. The price has been consolidating in recent months, and the latest weekly candle shows a strong bullish engulfing pattern, indicating a possible shift in momentum.
Key levels to watch, as identified on the chart, are:
Immediate Resistance: 0.02546 BTC. A decisive close above this level on the weekly timeframe would be the first confirmation of a potential trend reversal.
Further Resistance: 0.02929 BTC and 0.03451 BTC. These represent subsequent hurdles for the bulls to overcome.
Take Profit Target: 0.038 BTC. This level is marked as the ultimate target for this potential upward move.
Timeframe: The analysis on the chart suggests a maximum timeframe of 5 weeks for this trade idea to play out.
Moving Averages: The price is currently trading below the MA Ribbon (SMA, 20, 50, 100, 200), which could act as dynamic resistance. A break above this ribbon would further strengthen the bullish case.
Fundamental Analysis (FA)
The current market environment in July 2025 provides several fundamental catalysts that could impact the ETH/BTC ratio.
For Ethereum (ETH):
Growing Institutional Interest: Ethereum ETFs have seen significant inflows, with over $890 million in July 2025 alone, driven by increasing confidence from institutional investors. Asset managers like BlackRock are accumulating substantial amounts of ETH, reducing the available supply on the market.
Network Upgrades: The upcoming "Pectra" upgrade, which includes Proto-Danksharding (EIP-4844), is anticipated in Q3 or early Q4 2025. This is expected to significantly reduce Layer-2 transaction costs and improve scalability, further enhancing the utility of the Ethereum network. The earlier Pectra upgrade in 2025 already introduced user-friendly features like smart accounts.
Ecosystem Growth: The Linea project, a prominent player in Ethereum's DeFi ecosystem, has a Token Generation Event (TGE) scheduled for July 2025, which is expected to drive market shifts. The overall DeFi ecosystem on Ethereum is showing signs of revitalization.
For Bitcoin (BTC):
Strong Institutional Demand: Similar to Ethereum, Bitcoin is experiencing a wave of institutional adoption, with significant inflows into spot Bitcoin ETFs. Public companies are now holding BTC in their treasuries, and major financial institutions view it as a strategic asset.
New All-Time Highs: Bitcoin has recently surged to new all-time highs, breaking key trendlines and signaling a new bullish era. This strong performance often has a spillover effect on the broader crypto market, including altcoins like Ethereum.
Favorable Macro Environment: Some analysts point to a looser monetary policy from global central banks and inflation concerns as factors boosting demand for hard assets like Bitcoin.
ETH vs. BTC Dynamics:
While Bitcoin's price has seen impressive gains, some analysts believe Ethereum has room to catch up. The ETH/BTC ratio is a key metric for gauging the relative strength of the two leading cryptocurrencies. An upward trend in the ETH/BTC chart, as suggested by the technical analysis, would indicate that Ethereum is outperforming Bitcoin. The performance of ETH relative to Bitcoin is often seen as a barometer for the broader altcoin market.
My point of view
The technical setup on the ETH/BTC weekly chart presents a compelling case for a potential bullish reversal in the short to medium term. This is supported by strong fundamental developments within the Ethereum ecosystem, including significant institutional inflows and major network upgrades. While Bitcoin's own bullish momentum is a factor to consider, the potential for Ethereum to outperform in the coming weeks, as indicated by the provided chart analysis, offers an interesting trading opportunity. Traders should closely monitor the identified resistance levels for confirmation of a breakout.
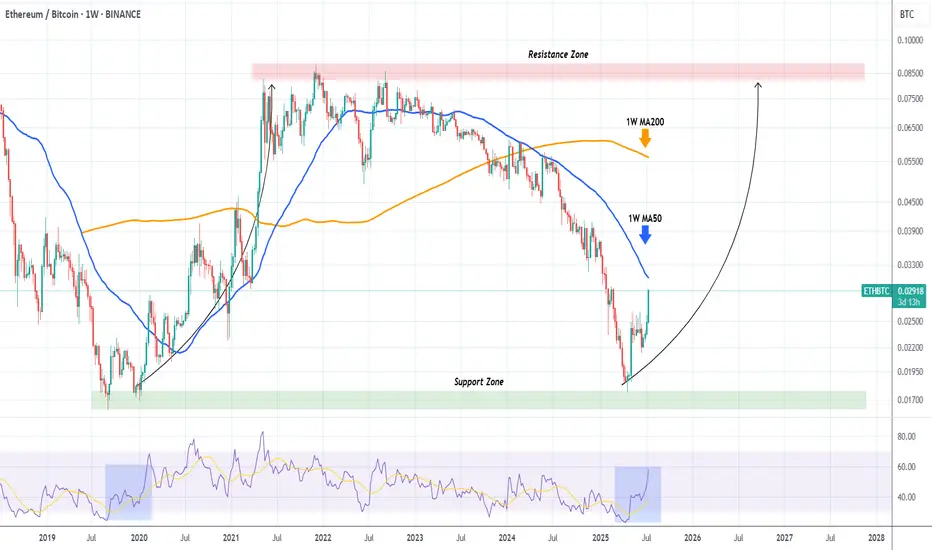
ETHBTC shows that Ethereum will outperform Bitcoin MASSIVELY!The ETHBTC pair has been rebounding hyper aggressively after the April 21 2025 Low on the 6-year Support Zone, and is now facing it's most important test, the 1W MA50 (blue trend-line).
This trend-line has been its Resistance since basically March 13 2023, so if broken, it will be a massive bullish break-out signal.
In fact during the 2020 - 2021 Bullish Leg, once the price broke above the 1W MA50, the market got the final confirmation of the upcoming long-term rally.
We expect Ethereum to outperform Bitcoin for the rest of the year at least.
-------------------------------------------------------------------------------
** Please LIKE 👍, FOLLOW ✅, SHARE 🙌 and COMMENT ✍ if you enjoy this idea! Also share your ideas and charts in the comments section below! This is best way to keep it relevant, support us, keep the content here free and allow the idea to reach as many people as possible. **
-------------------------------------------------------------------------------
💸💸💸💸💸💸
👇 👇 👇 👇 👇 👇