ETHBTC Has Bottomed A bottom like this is great
I suspect ETH will outperform BTC for awhile while altseason begins/continues
A strange chart but a good one for a reversal
Bars pattern shows my thoughts of a complete W reversal
Monthly timeframe
ETHBTC
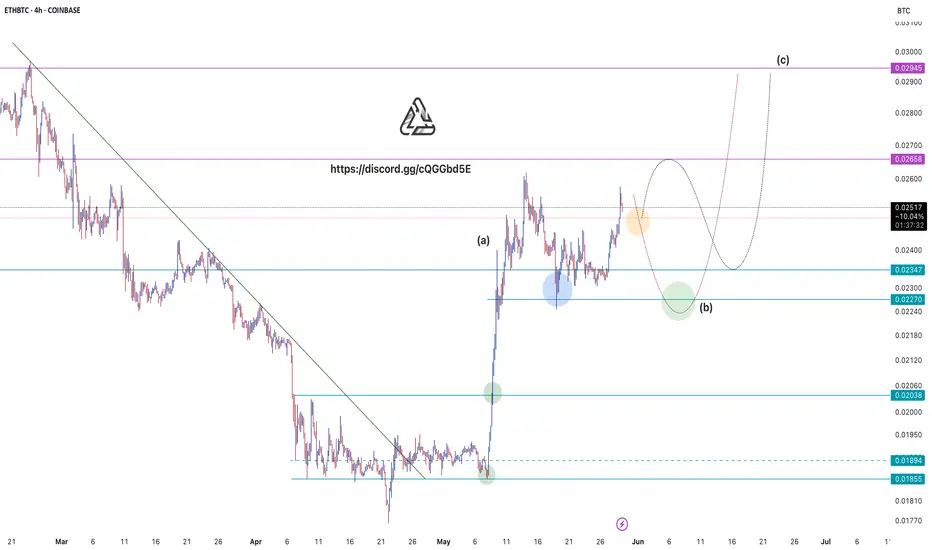
ETHBTC AnalysisETHEREUM chart against BITCOIN is still playing inside wave B of this ABC pattern and still needs to cool off before it make the final big move.
We have highlighted two possible scenarios . Let's see how it goes.
#ETH/USDT#ETH
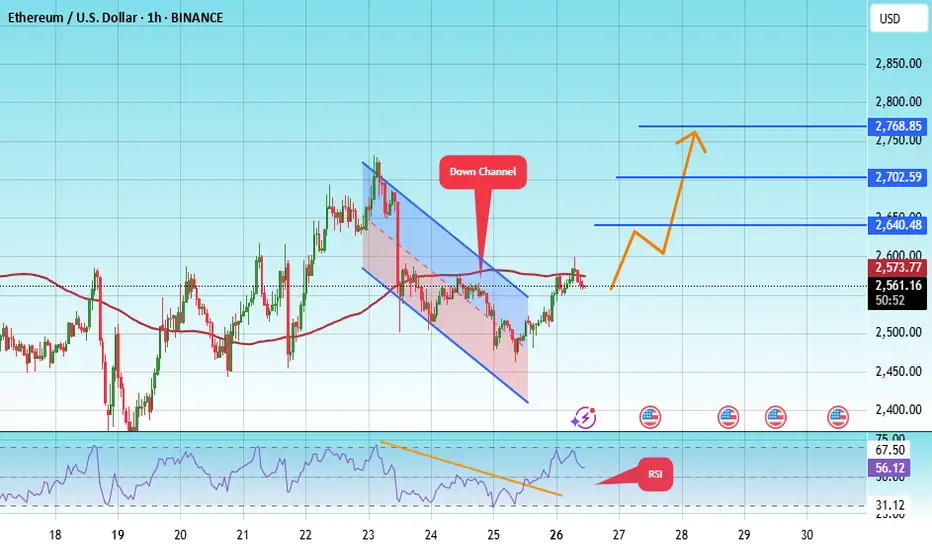
The price is moving within a descending channel on the 1-hour frame, adhering well to it, and is heading for a strong breakout and retest.
We are seeing a bounce from the lower boundary of the descending channel, which is support at 2465.
We have a downtrend on the RSI indicator that is about to break and retest, supporting the upward trend.
We are looking for stability above the 100 moving average.
Entry price: 2558
First target: 2640
Second target: 2702
Third target: 2768
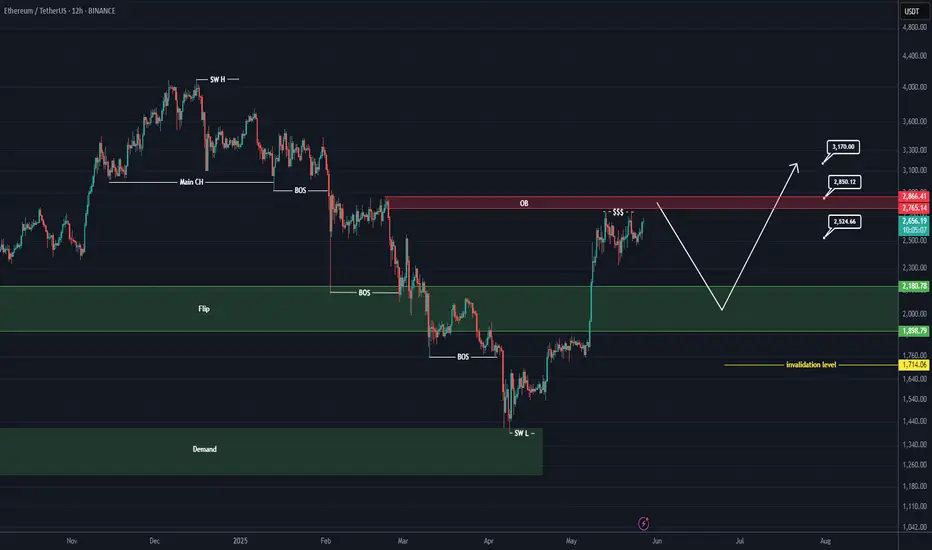
ETH NEW UPDATE (12H)This analysis is an update of the analysis you see in the "Related publications" section
This analysis is still valid.
Ethereum has a liquidity pool above the chart, and just behind that pool, there is a fresh order block.
After sweeping the liquidity pool and hitting this order block, the price is expected to drop toward the flip zone.
For risk management, please don't forget stop loss and capital management
When we reach the first target, save some profit and then change the stop to entry
Comment if you have any questions
Thank You
ETHBTC Exiting the consolidationETHBTC breaks above the consolidation range. No real Resistance ahead.
Check out ETHUSDt chart also

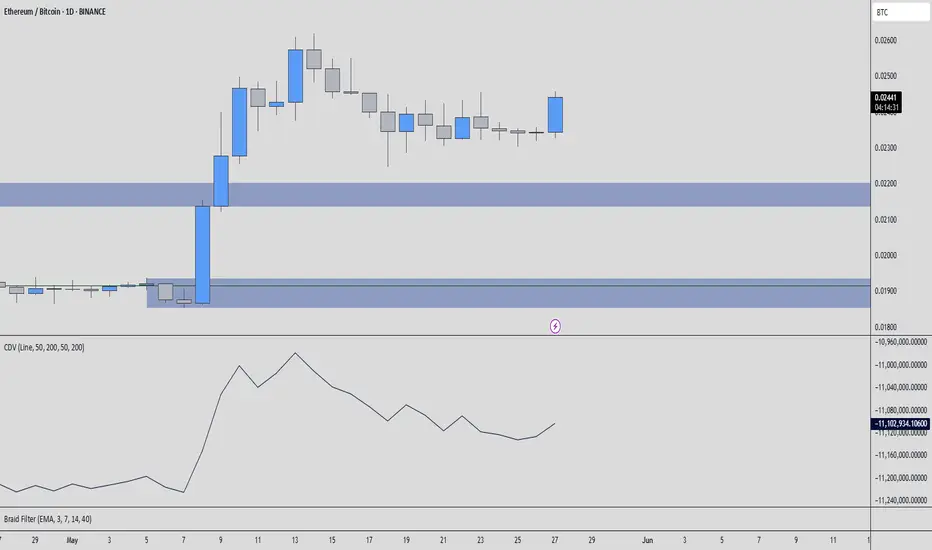
ETHBTC | Blue Boxes Holding, Market Shift BrewingETHBTC is quietly building strength. The blue boxes below have held well as demand zones, and recent reactions hint that buyers are stepping back in.
CDV is starting to shift, and we’re seeing early signs of accumulation. No breakout yet, but the structure suggests the market may be preparing for one.
A clean push above local range highs with volume would confirm the shift. Until then, patience pays.
📌I keep my charts clean and simple because I believe clarity leads to better decisions.
📌My approach is built on years of experience and a solid track record. I don’t claim to know it all but I’m confident in my ability to spot high-probability setups.
📌If you would like to learn how to use the heatmap, cumulative volume delta and volume footprint techniques that I use below to determine very accurate demand regions, you can send me a private message. I help anyone who wants it completely free of charge.
🔑I have a long list of my proven technique below:
🎯 ZENUSDT.P: Patience & Profitability | %230 Reaction from the Sniper Entry
🐶 DOGEUSDT.P: Next Move
🎨 RENDERUSDT.P: Opportunity of the Month
💎 ETHUSDT.P: Where to Retrace
🟢 BNBUSDT.P: Potential Surge
📊 BTC Dominance: Reaction Zone
🌊 WAVESUSDT.P: Demand Zone Potential
🟣 UNIUSDT.P: Long-Term Trade
🔵 XRPUSDT.P: Entry Zones
🔗 LINKUSDT.P: Follow The River
📈 BTCUSDT.P: Two Key Demand Zones
🟩 POLUSDT: Bullish Momentum
🌟 PENDLEUSDT.P: Where Opportunity Meets Precision
🔥 BTCUSDT.P: Liquidation of Highly Leveraged Longs
🌊 SOLUSDT.P: SOL's Dip - Your Opportunity
🐸 1000PEPEUSDT.P: Prime Bounce Zone Unlocked
🚀 ETHUSDT.P: Set to Explode - Don't Miss This Game Changer
🤖 IQUSDT: Smart Plan
⚡️ PONDUSDT: A Trade Not Taken Is Better Than a Losing One
💼 STMXUSDT: 2 Buying Areas
🐢 TURBOUSDT: Buy Zones and Buyer Presence
🌍 ICPUSDT.P: Massive Upside Potential | Check the Trade Update For Seeing Results
🟠 IDEXUSDT: Spot Buy Area | %26 Profit if You Trade with MSB
📌 USUALUSDT: Buyers Are Active + %70 Profit in Total
🌟 FORTHUSDT: Sniper Entry +%26 Reaction
🐳 QKCUSDT: Sniper Entry +%57 Reaction
📊 BTC.D: Retest of Key Area Highly Likely
📊 XNOUSDT %80 Reaction with a Simple Blue Box!
📊 BELUSDT Amazing %120 Reaction!
📊 Simple Red Box, Extraordinary Results
📊 TIAUSDT | Still No Buyers—Maintaining a Bearish Outlook
📊 OGNUSDT | One of Today’s Highest Volume Gainers – +32.44%
I stopped adding to the list because it's kinda tiring to add 5-10 charts in every move but you can check my profile and see that it goes on..
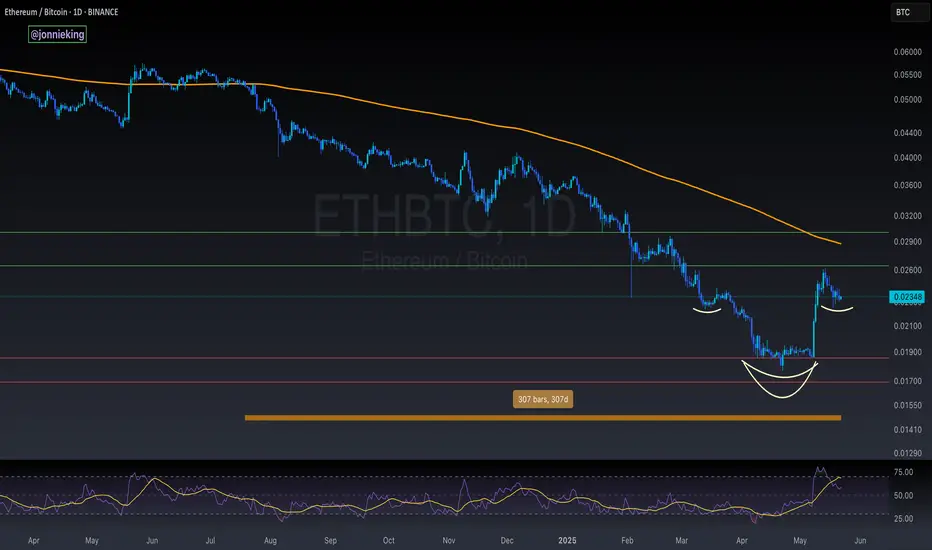
$ETH / $BTC Inverse Head and Shoulders Confirmed! NGL pretty much every chart i'm looking at rn looks crazy bullish 🐂
Inverse Head and Shoulder confirmed on ETH / BTC 🤯
The real test comes at the 200DMA as CRYPTOCAP:ETH has not traded above it in the past 307 days.
#ETH/BTC Update:- This will trigger the real Altseason!The $ETH/BTC chart is making a strong attempt to break above the channel resistance, which aligns with the 100 EMA (the blue line).
Once it breaks above these two levels, it will trigger the real altseason as alt/BTC pairs start to pump. Until then, as long as we stay within this channel, we won’t see an altseason. ETH needs to break this resistance.
I recommend bookmarking this post to stay updated.
Cheers

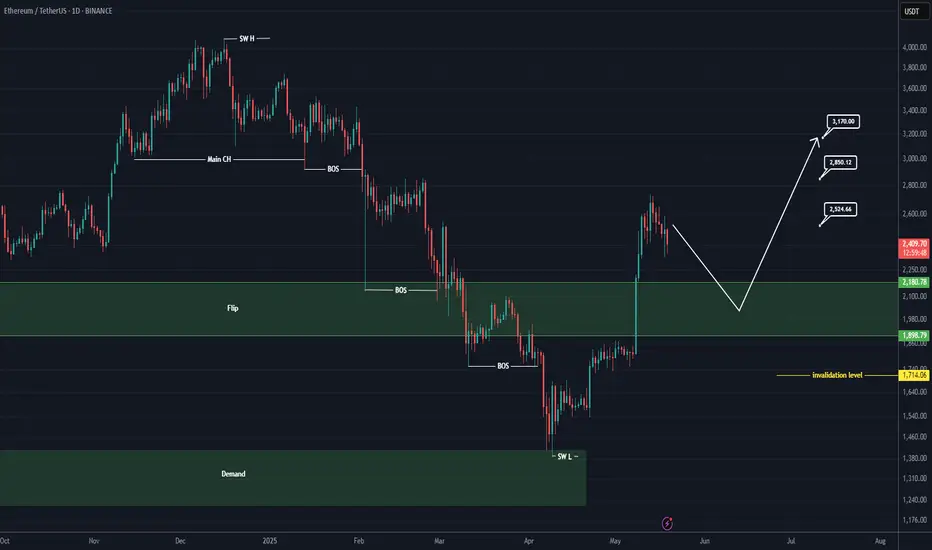
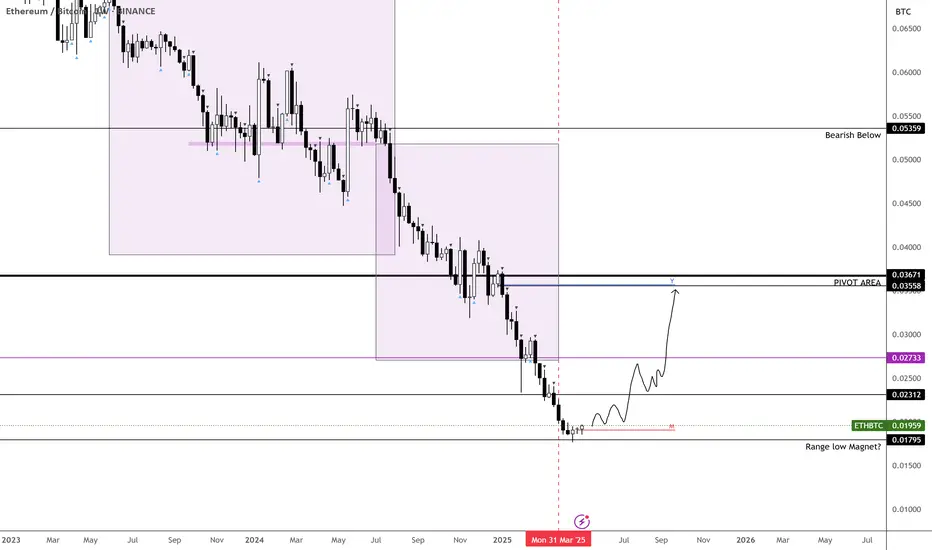
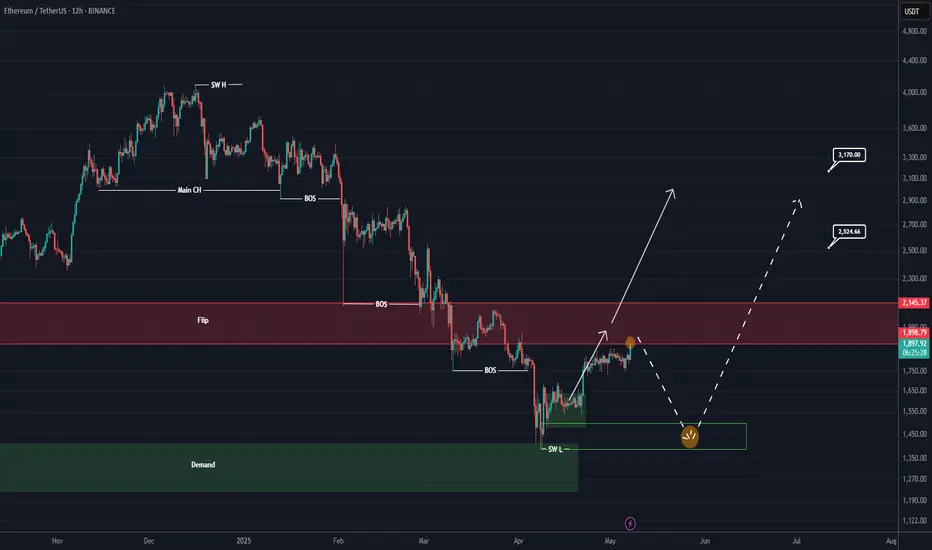
ETHEREUM New Update (1D)Ethereum has reclaimed the flip zone, but it hasn't tested this area or made a proper pullback yet.
It's expected that this zone will be tested before the price moves toward higher targets.
If we see a strong reaction around the green zone, we can look for potential buy/long positions.
A daily candle closing below the invalidation level would invalidate this analysis.
For risk management, please don't forget stop loss and capital management
When we reach the first target, save some profit and then change the stop to entry
Comment if you have any questions
Thank You
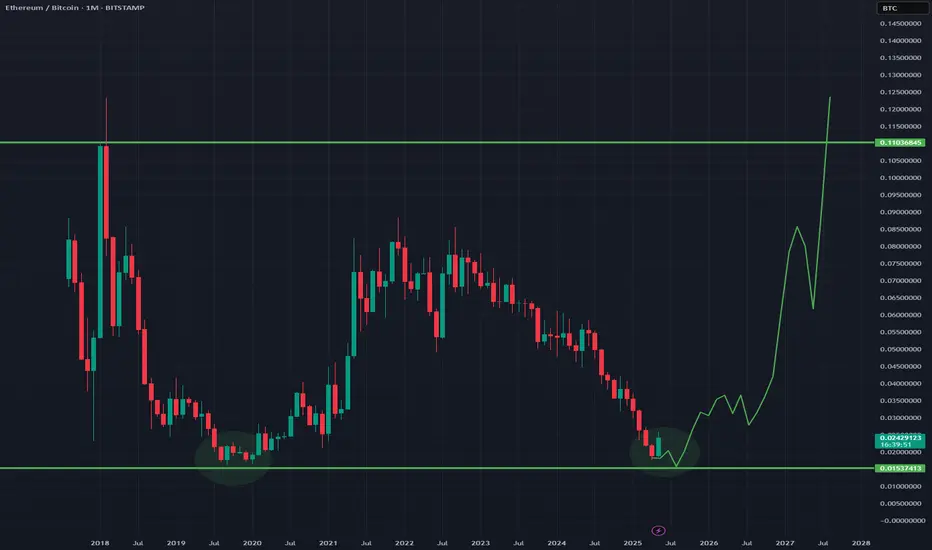
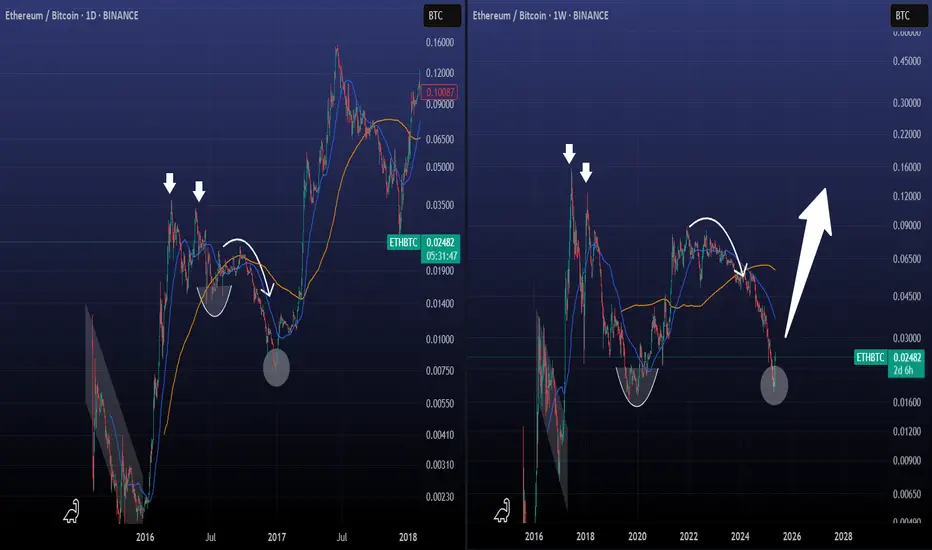
ETHBTC Is it repeating its first Cycle?I know that the timeframes are not the same but don't tell me that the structure between then and now isn't similar.
The biggest difference is that in 2016 ETHBTC made a deeper low than now, but the current rebound is showing signs that we might have a similar parabolic rise.
Now will that be enough to give a new All Time High?
We will see, but don't tell me that this can't target 0.0900 byu the end of the year.
Follow us, like the idea and leave a comment below!!
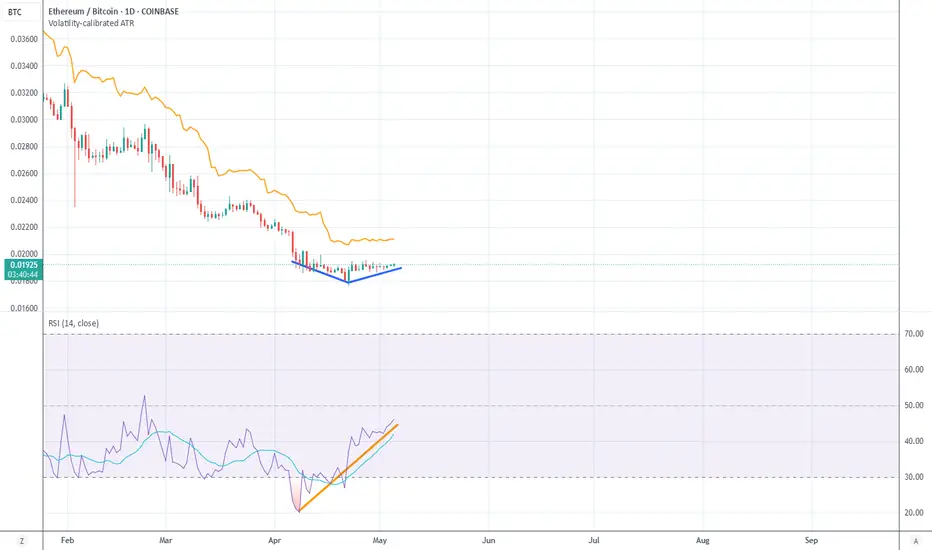
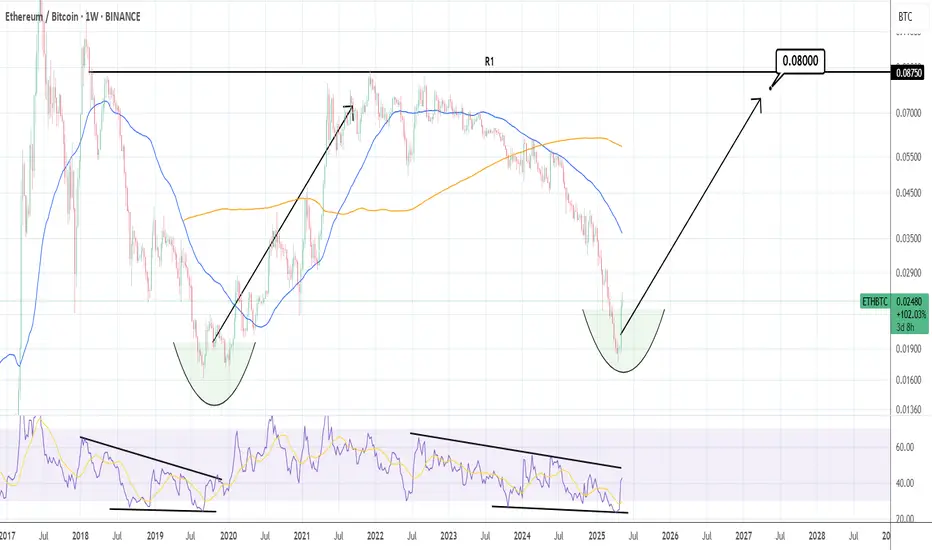
ETHBTC: Ethereum to gain massively against Bitcoin.Ethereum is overbought on its 1D technical outlook (RSI = 72.854, MACD = 228.230, ADX = 38.542) due to the rebound it initiated last week. Even though it is still on its very early stages, this rebound and statement of its strength is better viewed on the ETHBTC pair against Bitcoin. As you can see, ETHBTC bottomed on a level that it hasn't seen since January 6th 2020. The massive downtrend since 2023 is comparable to the one that started in 2018. Similar bottoms, similar 1W RSI sequences. We expect this rebound to be the main driver all the way to the 7 year Resistance level (R1). Traders of this pair can target 0.0800 on the long term.
## If you like our free content follow our profile to get more daily ideas. ##
## Comments and likes are greatly appreciated. ##
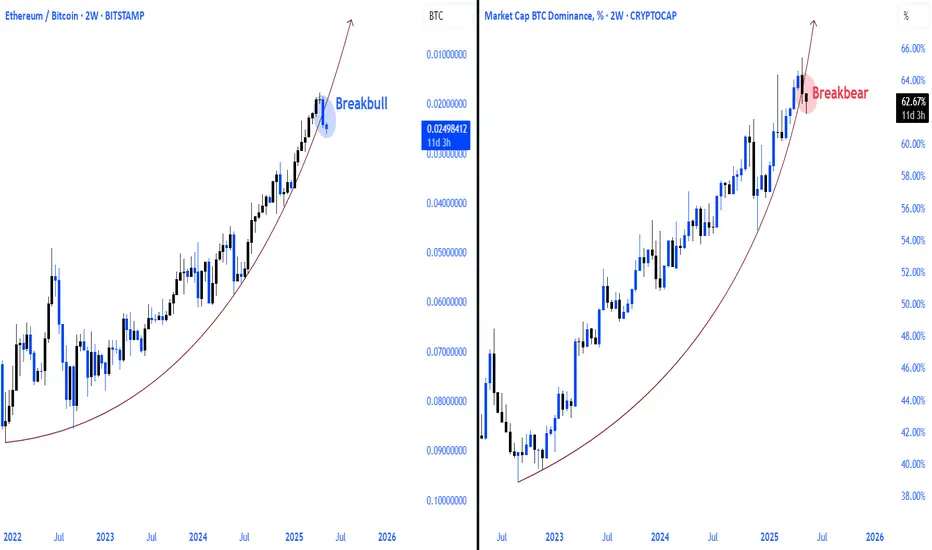
Eth/Btc vs Bitcoin Dominance Ethbtc parity and bitcoin dominance parabolic curve breakout occurred. bitcoin dominance down ethbtc will start the up process
ETH/BTC bear market since 2021.. bounce time ?ETH / BTC
If you checked this chart you will notice that ETH was in downtrend and bear market against BTC since 2021 !
Now we have reached a very important multi years support (price action on 2020 - 2019 - 2016 )
Time for bounce soon ?

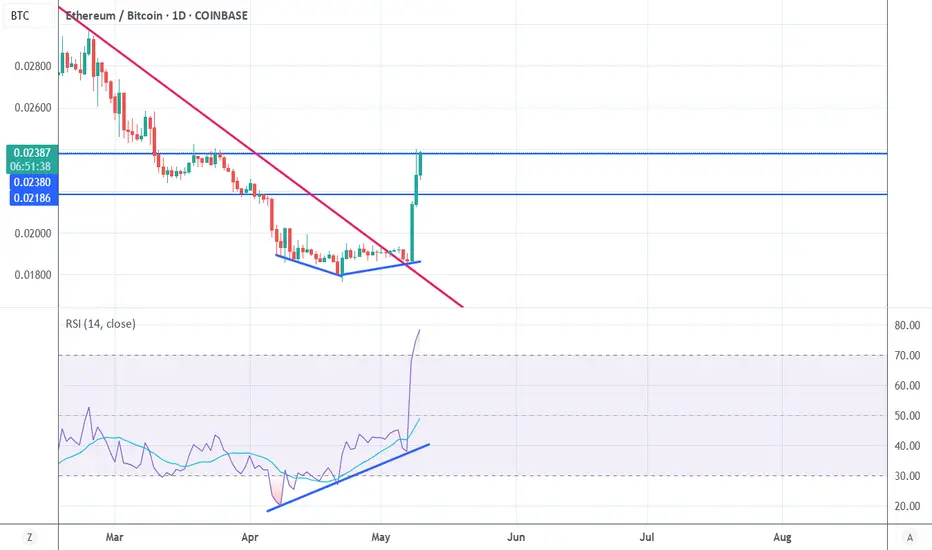
ETHBTC – Bottom Likely In!Finally stepping in to say it—ETHBTC has likely bottomed.
April marked the final month of its bearish phase, and it just tapped the impulse zone from the last major move, which also lines up with a key range low we haven’t seen since December 2019.
The weekly is starting to show early signs of strength, adding weight to this being a pivotal area.
From a risk/reward standpoint, this is arguably the best BINANCE:ETHBTC setup in a long time.
Time to act accordingly—this could be the moment many have been waiting for. I expect BTC dominance to give alts some room over the next couple of weeks. The real test comes in July.
MARKETSCOM:ETHEREUM BINANCE:ETHUSDT
Welcome to ALT SEASON (Real) | BTC.D & ETH/BTCCRYPTOCAP:BTC.D is rejecting off 2021 POI and deviating this cycle's high having just closed the weekly under 64%. Coupled with CRYPTOCAP:ETH strength showing signs of a trend reversal after downtrending for 4-year against $BTC. Likely see CRYPTOCAP:ETH trade upwards of US$5000 this year as ETH outperforms BTC.

ETH / BTC Breakout ConfirmedExpect ETH to lead Bitcoin in the near term as the trend has finally reversed on a HTF.
Hopefully this is a sign of a proper Alt season inbound...
Ethereum waking up?One of the most disappointing projects in the crypto space in recent years has to be ETH, losing ground on BTC since September '22. Finally ETH looks to have woken up outpacing BTC this week and broken out from the daily downtrend channel and currently at the underside of the DAILY 200 EMA.
BTC.D has printed a SFP and dropped 2% from 65.4% to 63%, could we be seeing a rollover and rotation into altcoins?
How I see it the moving average should cap off this move for now and a retrace towards the breakout area & previous lower high. That would then be the first higher high and higher low of this calendar year, a very bullish change in structure.
A more aggressive bullish scenario in the short term would be a reclaim of the 1D 200 EMA, leaving the inefficiency zone at the breakout level unfilled.
Either way the next HTF target is $2,800 for ETH which would bring price to the range midpoint and a key supply zone with many resting Stop losses.

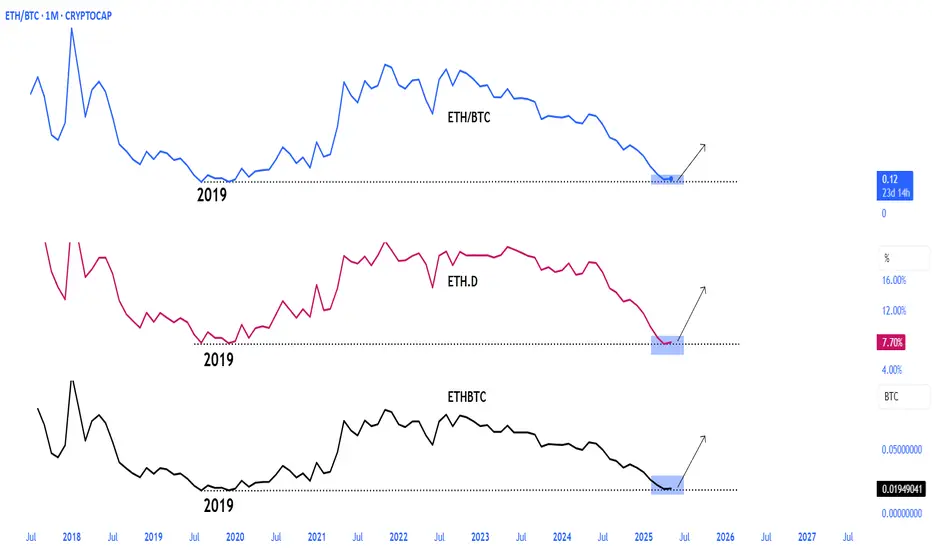
Watching ETHBTC for a Double Bottom (Hidden Bullish Divergence)Introduction
We are in the initial stages of seeing if ETH can set a "higher low" double bottom on the monthly chart. The first low was set September 2019 so this has been a multi year pattern. It might be playing out over several crpyot cycles to completion.
Simple Price Analysis
For a valid double bottom we want the lows within 10% of each other. The first low is about 8% below this second low so we are definitely within tolerance. We can also see that price is currently bouncing off top of the previous monthly bottoming structure until price moved to between the 0.618 level and created a double top (which I covered extensively in the linked idea.
In the chart below we can see a similar pattern with bitcoin after the C19 crash. The low wasn't textbook, the first low being 18% lower than the second low. Thats fine. The most important think is that price set a higher low.
Targeting off the fib draw is still the same. Looking for the 1.618 level. So I am watching to see eth hit a 27x against bitcoin from here
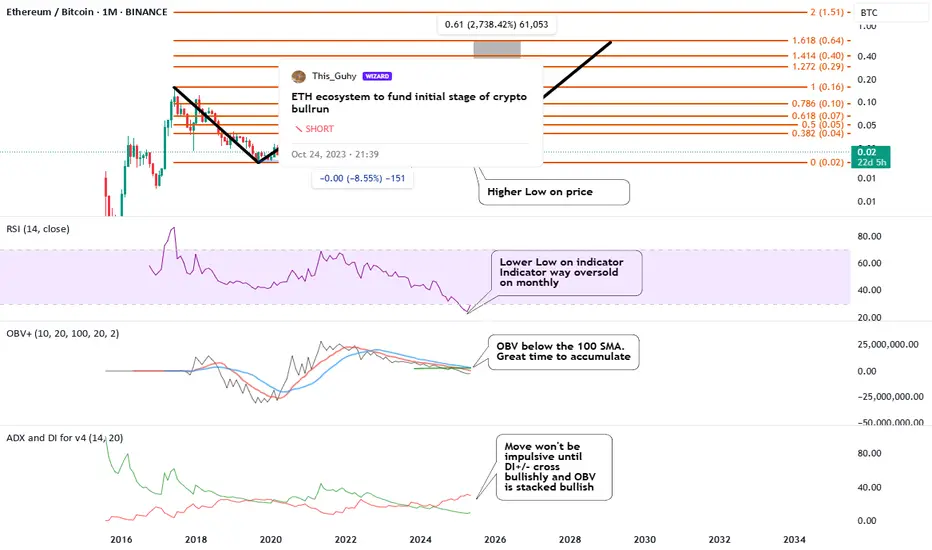
Indicators
Normal Divergence (Trend Reversal)
Bearish: Higher highs on price action but lower highs on the indicator
Bullish: Lower lows on price action but higher lows on the indicator
Hidden (Trend Continuation)
Bearish: Lower high on the price action and higher highs on the indicator
Bullish: Higher low on the price action and a lower low on the indicator
If you look at the primer we are looking for the main trend to continue. And that is up.
Battle Plan
In my linked idea I made it clear I was staying out of eth until I saw bullish divergence. Not just eth, but everything in the eth ecosystem. Now EHTBC provisionally bullish its time to look at the ETH ecosystem again. While ETHBTC looked bearish I didn't even bother to analyze tokens against eth, only BTC.
Now I am going to be analyzing coins bullishness against eth. If I don't think it will outperform eth I don't buy it. And generally, I hope to be buying bull backs. Here is a great opportunity for a SUI buy when compared against eth on the 4h chart.
Wish me luck.
Linked Idea
ETH ANALYSIS (12H)This analysis is an update of the analysis you see in the "Related publications" section
Ethereum has finally reached the flip zone.
Pay close attention: Ethereum dominance is sitting on monthly support, which is a level with strong bounce potential.
We have two possible scenarios for Ethereum | either it breaks through the flip zone, or it makes a correction and turns bullish again from around the bottom.
⚠️ What’s clear is that shorting Ethereum is risky and doesn’t make sense!
For risk management, please don't forget stop loss and capital management
When we reach the first target, save some profit and then change the stop to entry
Comment if you have any questions
Thank You
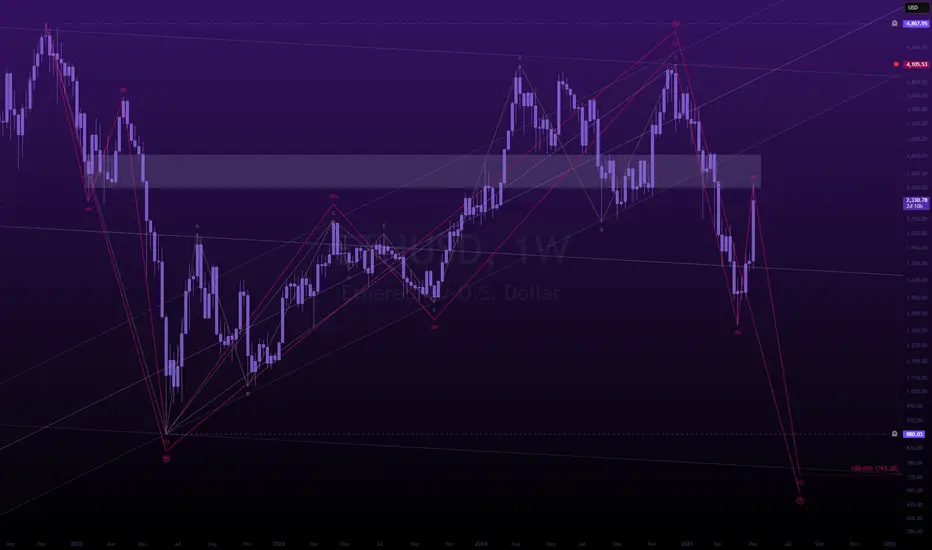
one last dancegm.
you finally woke up and ethereum was soaring.
you saw the bounce. the reclaim. the headlines.
you convinced yourself the bottom was in.
you drew trendlines, watched influencers say “we’re so back.”
you wanted to believe.
and that’s exactly what wave B needed.
because this wasn't a breakout.
it’s a reset.
a psychological rinse,
engineered to bait late longs and build fuel for the final l i q u i d a t i o n.
this is the macro (W)-(X)-(Y).
not hopium, not dreams structure.
wave A brought devastation.
wave B brought complacency
wave C brings the execution.
make no mistake:
we’re not going up,
we’re being set up.
the chart says $742.
you call it impossible.
but the market doesn’t care what you believe.
the market only exists to find the maximum pain,
your maximum pain.
eth to $700 is not a prediction.
it’s a scheduled event.
and you’re RSVP’d unless you wake up.
wave C of wave (Y) is coming.
and it doesn’t care how bullish you feel.
---
ETHUSDT Daily : READY For Ethereum ATH Hi guys ,
So let's see if Ethereum finally gets its turn. The chart has heavy nodes for growth but I think we could see Ethereum at $4,000 again.
SecondChanceCrypto
⏰ 9/May/26
⛔️DYOR

Is the Ethereum / Bitcoin bottom In?Eth maxi's have been obliterated for the past six - eight months, as a new all time high proved to be elusive. If you're a trend trader, this may be an interesting set up to watch...
Ethereum about to take the lead during the next leg up in the Crypto markets?