Need to check if you can ascend in critical sectionsHello?
Traders, welcome.
If you "Follow", you can always get new information quickly.
Please also click "Boost".
Have a good day.
-------------------------------------
(ETHBTC 1W Chart)
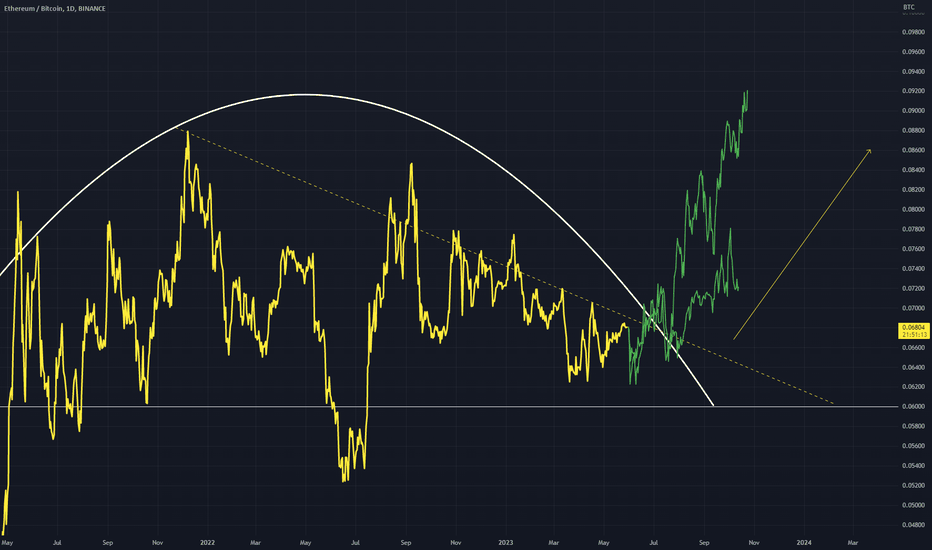
After the volatility period around June 26th, we need to see if the price can hold up above 0.07248.
----------------------------------------
(ETHUSDT chart)
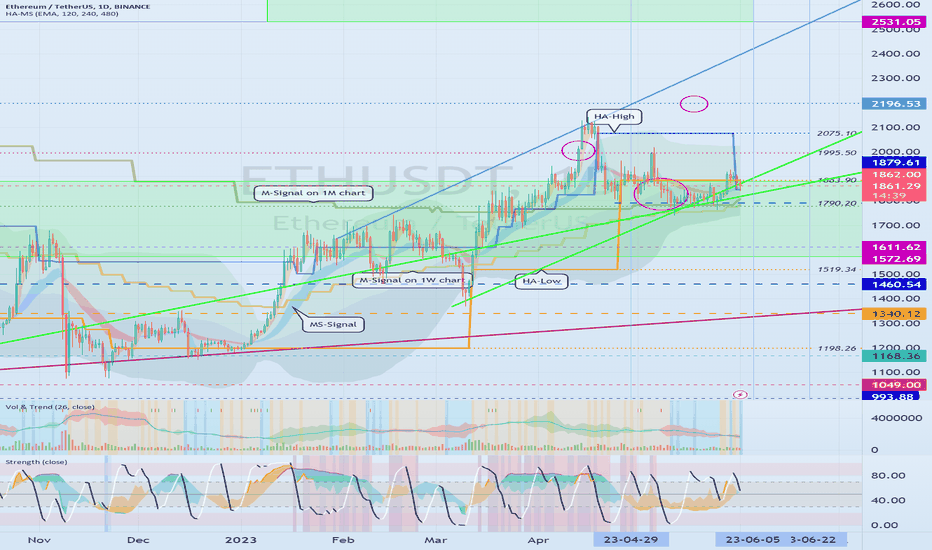
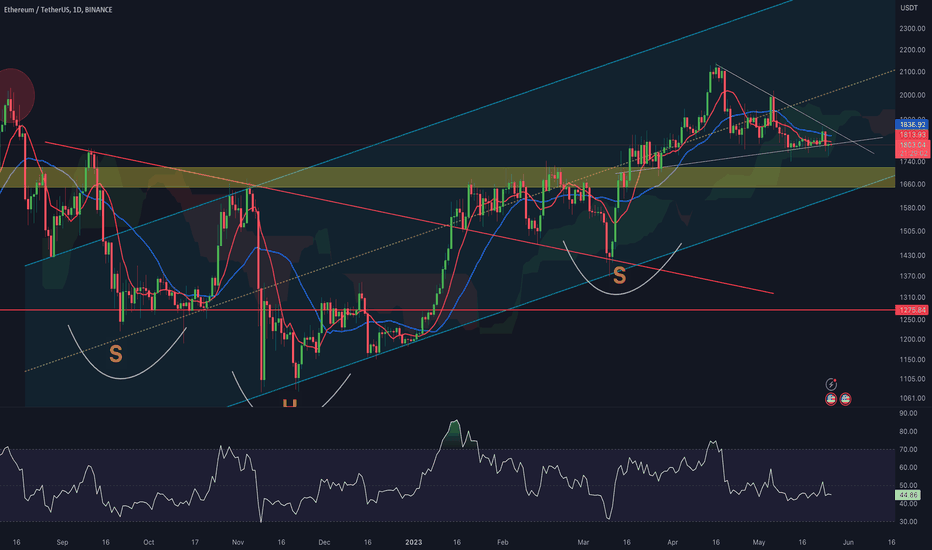
The 1572.69-1879.61 zone is an important support and resistance zone.
Therefore, the key is whether or not you can ascend with support in this section.
Therefore, it is necessary to check if it can be supported around 1862.46.
In order to check support and resistance, you need to check the movement for at least 1-3 days.
If it shows consistent support for at least 1-3 days, you may consider buying.
The point at which the current price is located determines the duration of the investment depending on which time frame the interval is drawn as support and resistance.
Therefore, you need to create or modify the trading strategy of the coin (token) you want to trade by looking at the 1M, 1W, and 1D charts and checking the points of support and resistance.
Looking at the current 1M chart, it is located near the MS-Signal indicator.
Therefore, if the price is maintained above the MS-Signal indicator, it is highly likely to continue its upward trend from a long-term perspective.
Therefore, when the MS-Signal indicator turns into an uptrend, it is necessary to check whether the price continues to hold above the MS-Signal indicator.
If the above points are confirmed, it is time to buy from a long-term perspective.
Since the price is located near the 1W chart, that is, the HA-High indicator from a mid- to long-term perspective, it can be interpreted that it is highly likely to renew the recent high.
Therefore, if you see support near the HA-High indicator, around 1862.0, it is the time to buy from a mid- to long-term perspective.
However, since you buy near the HA-High indicator, it is essential to stop loss if it falls below the HA-High indicator and shows resistance.
In the 1D chart, that is, from a short-term perspective, the HA-Low and HA-High indicators of the 1D chart are created around 1862.0, so you can trade depending on whether you are supported or resisted around 1862.0.
Therefore, if it receives support around 1862.0 and rises, the first selling section is the 2075.10-2196.53 section.
Also, if it falls below 1790.20, a stop loss is required.
If you have thought of the trading strategy according to the investment period like this, you need to determine the investment size according to the selected investment period.
What you need to consider when determining the size of your investment is where the current price falls within the overall price range.
Accordingly, from a mid- to long-term perspective, it is judged that the investment can be carried out with a ratio of 30% to 50%.
If you proceed with buying with too much proportion, it may be difficult to maintain the transaction continuously from a mid- to long-term perspective, so it is necessary to adjust the proportion.
By buying more at a lower price, you can make a bigger profit.
However, the important thing in conducting actual trading is your own state of mind.
Therefore, you need to be careful when buying from a mid- to long-term perspective because whether you can withstand the psychological burden you will receive when you buy more with a larger investment ratio determines whether you can continue trading.
From a mid- to long-term perspective, the time to buy in earnest is when it shows support near the HA-High indicator on the 1M chart.
--------------------------------------------
(ETHKRW chart)
If the price stays above 23700000-2466000, I would expect it to break out of the long-term downtrend line.
Accordingly, it is necessary to check whether the price is maintaining around 2920000 before or after the volatility around July 1, or whether it is supported near the HA-Low indicator on the 1D chart.
Looking at the 1M chart, it appears that there is potential for sideways movement in the 1911000-2920000 range.
In order to show a full-fledged uptrend, it must rise above the HA-High indicator on the 1M chart.
Therefore, it is expected that the current 1M chart's HA-High indicator point (3973000) will rise or shake up and down, causing the HA-High indicator to fall.
Therefore, from a long-term perspective, there is no reason to trade now.
From a mid- to long-term perspective, that is, if you look at the 1W chart and see support around 2370000-287000, you can buy it.
However, since you buy near the HA-High indicator, if it falls below 2370000 and shows resistance, a stop loss is essential.
-------------------------------------------------- -------------------------------------------
** All descriptions are for reference only and do not guarantee profit or loss in investment.
** Even if you know other people's know-how, it takes a considerable period of time to make it your own.
** This is a chart created with my know-how.
---------------------------------
ETHBTC
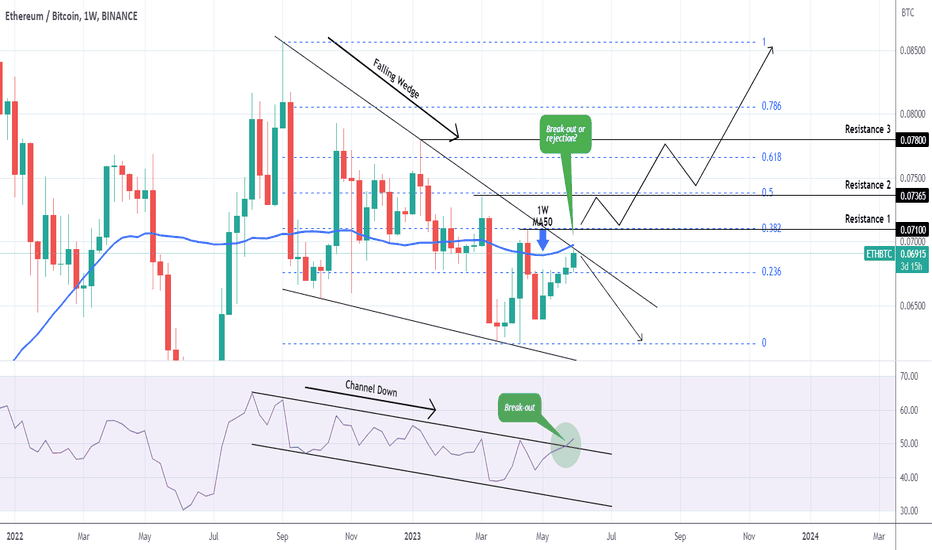
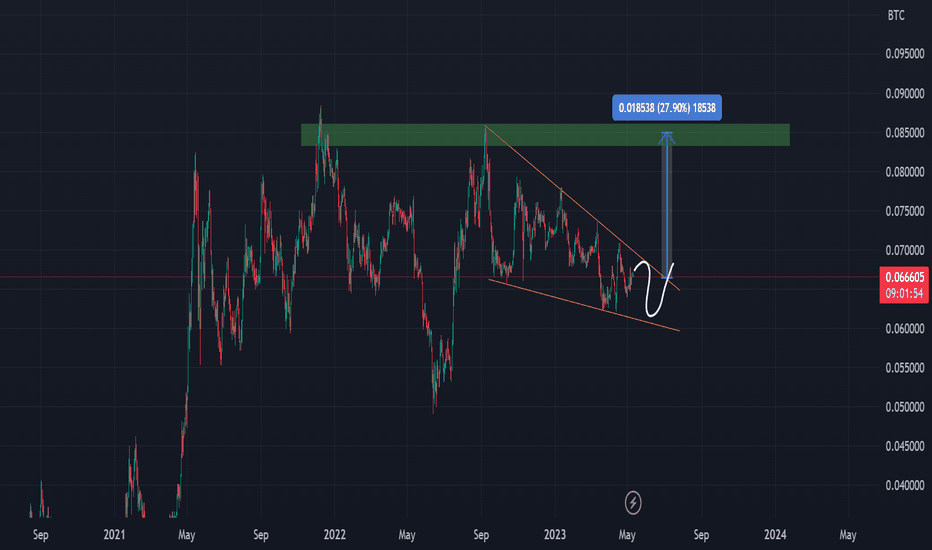
ETHBTC Potential bullish break-out of the 9 month Falling Wedge.The ETHBTC pair has been trading within a long-term Falling Wedge pattern since September 2022 and currently it is testing its top. This is also where the 1W MA50 (blue trend-line) is, so we can potentially have a double bullish break-out.
The 1W RSI has already broken above its 9-month Channel Down, issuing the first signal. If the price does break and close above the top of the Falling Wedge, we will target every Resistance level all the way to the 0.08560 High and buy on every pull-back. As you see the Fibonacci retracement levels match well with those Resistance levels, which are basically the Lower Highs of the Falling Wedge.
If the price fails to close above the Falling Wedge, then a potential rejection can pull it all the way down to the 0.06200 Low.
-------------------------------------------------------------------------------
** Please LIKE 👍, FOLLOW ✅, SHARE 🙌 and COMMENT ✍ if you enjoy this idea! Also share your ideas and charts in the comments section below! **
-------------------------------------------------------------------------------
💸💸💸💸💸💸
👇 👇 👇 👇 👇 👇
#Ethereum - thoughts out loud #2 Good afternoon, dear colleagues!
I am glad to welcome everyone and wish you to get acquainted with my vision of the current situation on this instrument.
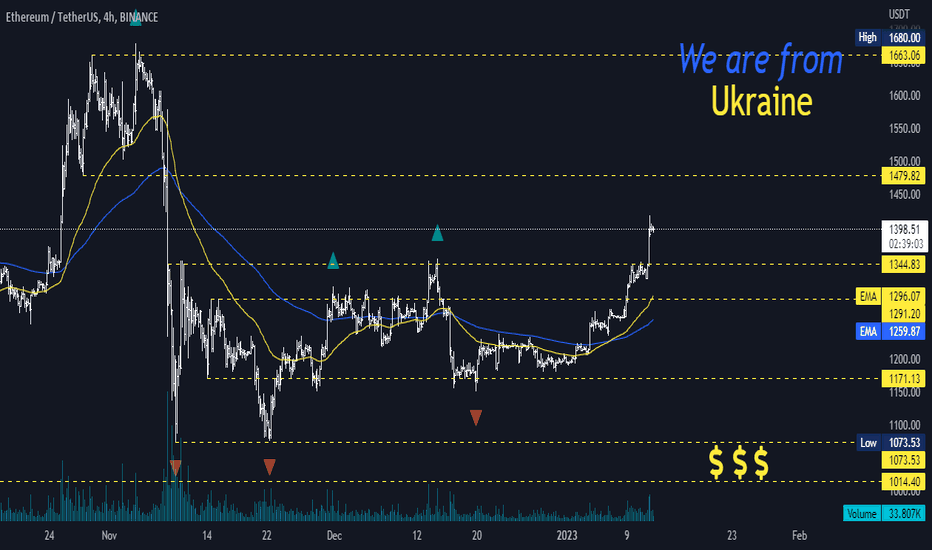
The situation is similar to the stage of accumulation (local) asset that began on 09.11.2022, where we are in the final phase before entering the trend movement (bullish). But I have some doubts, because the formation that we observe is obvious, most market participants may prefer long positions because it is "accumulation from here to the moon". Therefore, there may be several scenarios for the continuation of the movement:
1) We confidently break through the level of 1441 and rapidly move up until we run out of fuel (before that, we remove the stop loss by a rapid downward movement of 1211-1311).
2) "False accumulation" and the return of the price to the trading range after which we will see the depreciation of the instrument from the range of 1441 - 1551 to 999 - 888.
That is, professional market operators give the opportunity to realize the potential of the movement and expect how the crowd will pick up their idea and vision of the market. After all, we all understand that the market is created to 80% of participants lose money, but now not about that, let's return to the analysis. It is today that a number of important economic indicators are released and the volatility is expected to increase and why not implement our plans using the news background, the prospect is excellent and the scheme is worked out.
Dear colleagues, I sincerely thank you all for your attention and wish success to everyone!
And remember one thing:
"sometimes you win/sometimes you learn"
BITCOIN 1D : big dump ahead?In the previous analysis, we mentioned the support range in the chart, and as you can see, if this area is broken, we will have a falling trend to $25,000 and below, and otherwise, if this range is maintained, we will have the possibility of the price returning to the $31,000 area.
Its not Buy or Sell SIGNAL
DYOR
BY : M.TeriZ - @AtonicShark
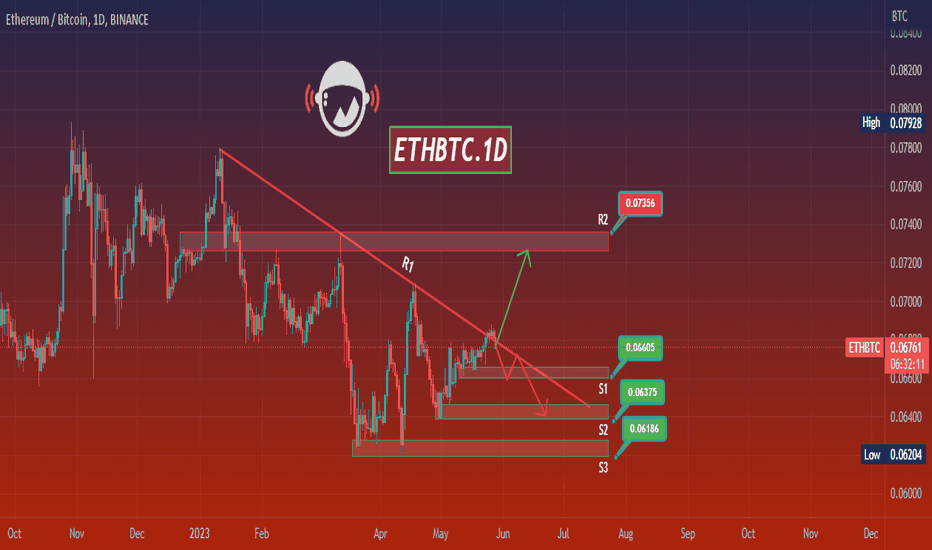
ETHBTC.1DHello dear friends,
*Mars Signals Team wishes you high profits*
This is a daily time frame analysis for ETHBTC.1D
We are in the daily time frame. As you can see, the price is oscillating at the resistance line. If it fails to stabilize above the resistance line, it has the possibility of falling to the first support line and we have shown you the supports. If it can stabilize above the resistance line, we have the possibility to increase to the second resistance line.
Warning: This is just a suggestion and we do not guarantee profits. We advise you to analyze the chart before opening any positions.
Take care
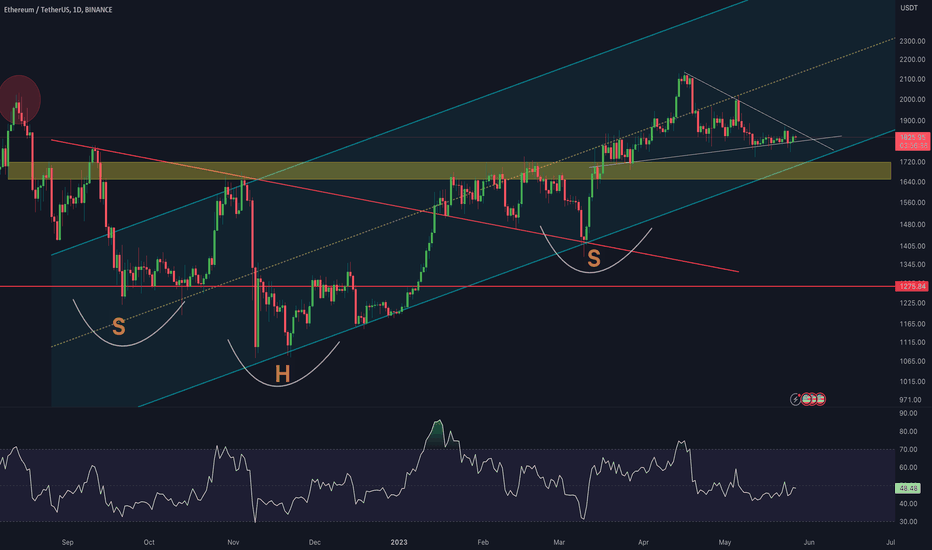
ETH/USD 1DAY UPDATE BY CRYPTO SANDERS !!Hello, welcome to this ETHEREUM /USDT update by CRYPTO SANDERS.
CHART ANALYSIS:- ethereum (ETH) also moved higher on Saturday, remaining above the 1,800 level.
Following a low of 1,810.37 on Friday, ETH/USD managed to hit an intraday high of 1,837.87 earlier in the day.
This surge led to the world’s second-largest cryptocurrency breaking out of its recent ceiling of 1,830.
as the day has progressed, earlier gains have somewhat fallen, with ETH now trading at 1,828.18.
It appears that market uncertainty has also risen, as the RSI neared a ceiling of its own at the 49.00 mark.
Price strength is now tracking at 48.75, and should it break out of this point, then there could be further highs from ETH this weekend.
Hit the like button if you like it and share your charts in the comments section.
Thank you
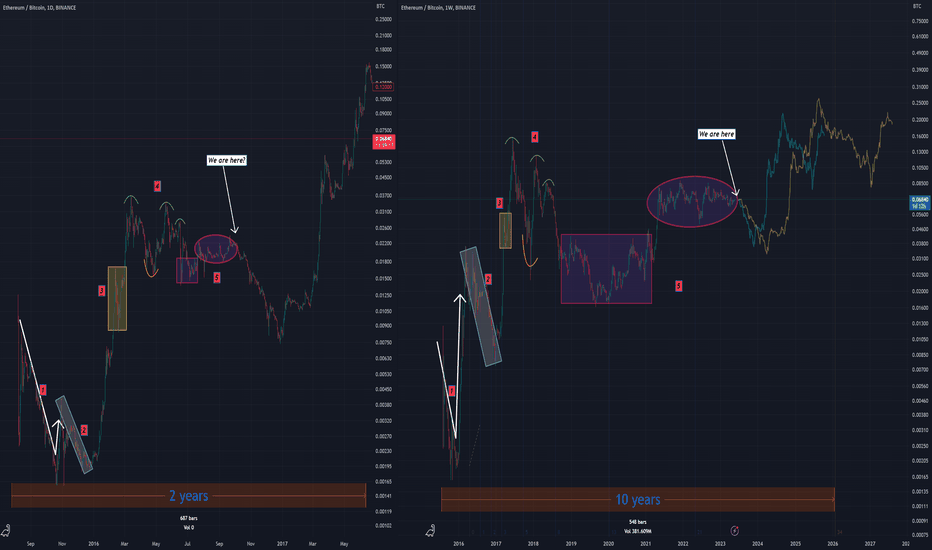
Ethereum – Set to repeat bull 2017 in 2024-2025Chart on the left is ETHBTC zoomed in to the first 2 to 3 years after inception.
Chart on the right is ETHBTC fully zoomed out, from inception to now, about 8 years.
There are remarkable similarities in both time frames of the same chart, as noted below:
1. A sharp decline, followed by an immediate price pump.
2. The rotated rectangle shows a drop in price.
3. Straight up, with a slight correction on the way.
4. This phase is hard to believe it is a different time frame, as the price levels are an exact mimicry of each other. There are 3 lower highs after both cycle tops. The bottom pattern formation is also the same in both charts.
5. A slow & steady rise with the price action in both time frames showing notable similarities.
If the ETHBTC chart on the right were to follow a similar route of ETHBTC on the left, then it is possible that ETHBTC will go lower for the next 6 to 12 months. It is important to remember that this will likely be because Bitcoin will be steadily going higher towards the last ATH, hence ETHUSD will be mostly sideways.
Once BTCUSD breaks $66K, around then ETHBTC will start its rally, which looks like has a final target of 0.3.
The blue and green faded projections at the end outline possible pathways for ETHBTC, depending on how slow/how fast the cycle plays out.
Disclaimer: Keep in mind that market predictions are about as reliable as a weather forecast in outer space. Use this analysis as a conversation starter, not as financial advice. Investing in cryptocurrencies carries risks, so do your homework and make informed decisions. Remember, no crystal balls here—just a pinch of insight and a dash of caution
ETH/USD 1DAY UPDATE BY CRYPTO SANDERS !!Hello, welcome to this ETHEREUM /USDT update by CRYPTO SANDERS.
CHART ANALYSIS:- Ethereum (ETH) also declined for the second session in a row, falling below the 1,800 level in the process.
After hitting a high of 1,817.97 ETH/USD reached a low of 1,763.37 today.
The move dropped Ethereum from its own support point at 1,790, hitting a two-week low in the process.
the earlier decline has eased somewhat, as the floor at 43.00 on the RSI has helped stop the bleeding.
Despite the decline, the 10-day (red), and 25-day (blue) moving averages are now nearing a crossover, which could signal a price reversal.
Hit the like button if you like it and share your charts in the comments section.
Thank you
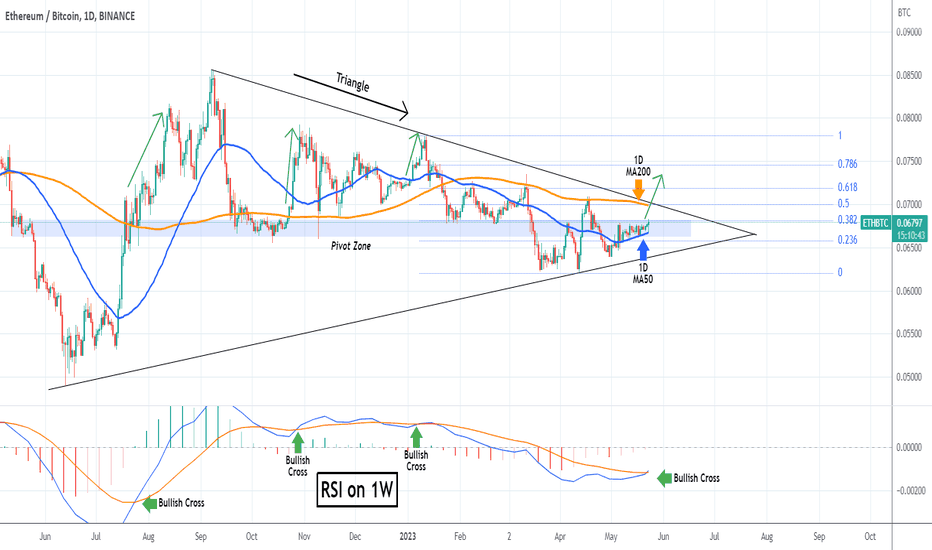
ETHBTC Bullish Cross completed on 1W. Rally ahead.The ETHBTC pair has been trading inside a Triangle pattern for almost a year (since the June 13 2022 Low). For the past 3 weeks the 1D MA50 (blue trend-line) has been supporting while the 1D MA200 (orange trend-line) has been the Resistance since January 21 as the price has failed to close a 1D candle above it (having 3 clear rejections on it).
The key difference here is the formation of a Bullish Cross on the 1W MACD. In the past 12 months, this has always been a Buy Signal. We are buying and targeting the 1D MA200, and if it closes a 1D candle above the 1D MA200, we will extend buying towards the 0.618 Fibonacci level.
-------------------------------------------------------------------------------
** Please LIKE 👍, FOLLOW ✅, SHARE 🙌 and COMMENT ✍ if you enjoy this idea! Also share your ideas and charts in the comments section below! **
-------------------------------------------------------------------------------
💸💸💸💸💸💸
👇 👇 👇 👇 👇 👇
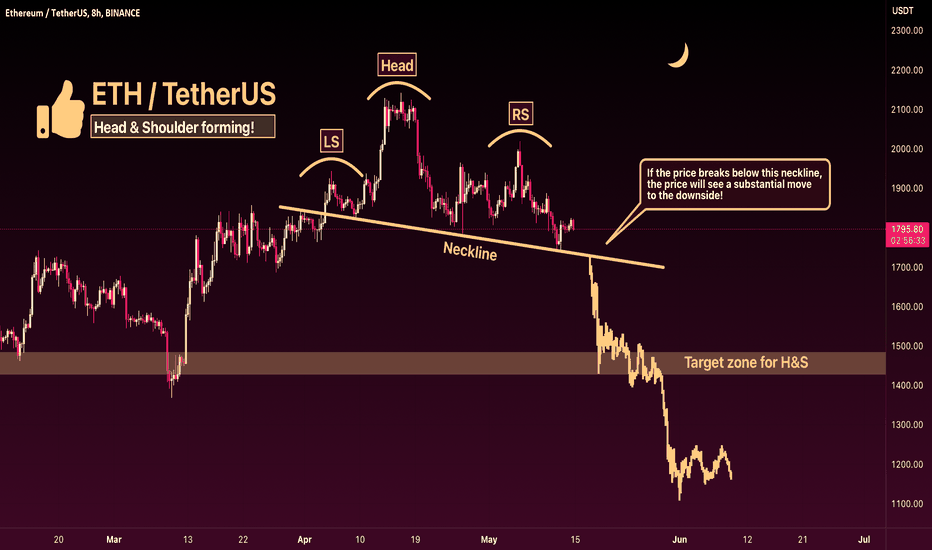
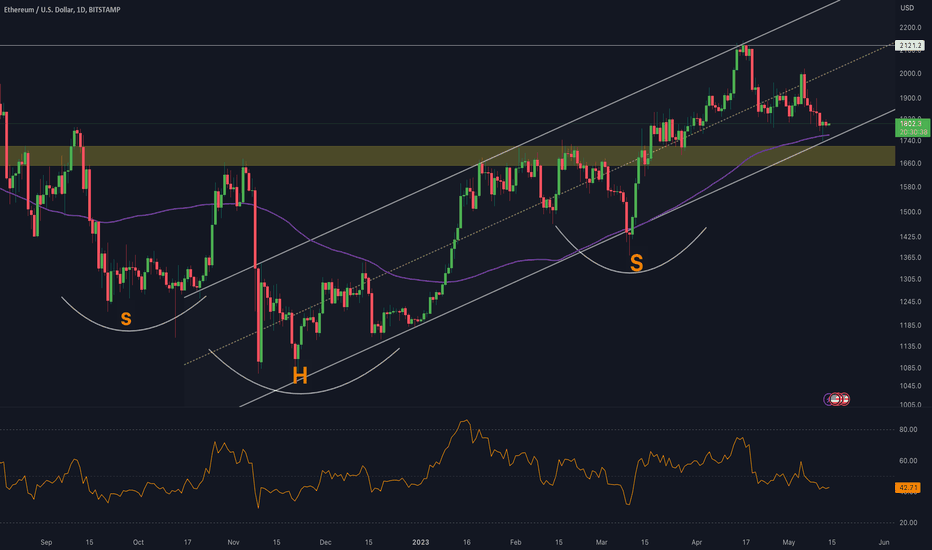
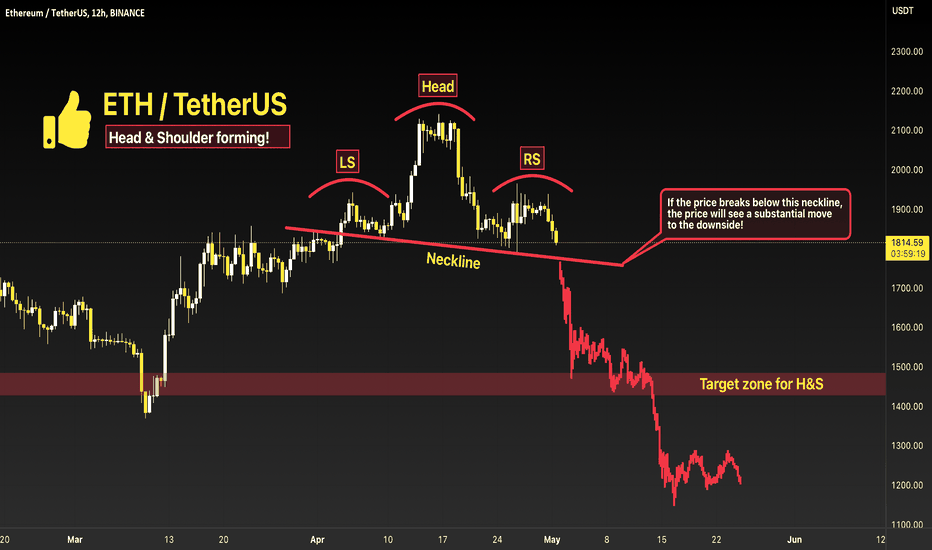
ETH: Head & shoulder forming!After thorough analysis, it is apparent that the price of ETH has developed a Head and Shoulders pattern. In the event of a breach below the neckline, a substantial downward movement is anticipated. It is, therefore, advisable to closely monitor the neckline for any such movement.
Furthermore, based on the strong correlation between BTC and ETH, it is expected that the latter will follow a similar trajectory as the former. Given the likelihood of BTC decreasing from its present levels, ETH is expected to move downwards as well. Thus, it is reasonable to anticipate that ETH will break below the neckline and experience further downward movement.
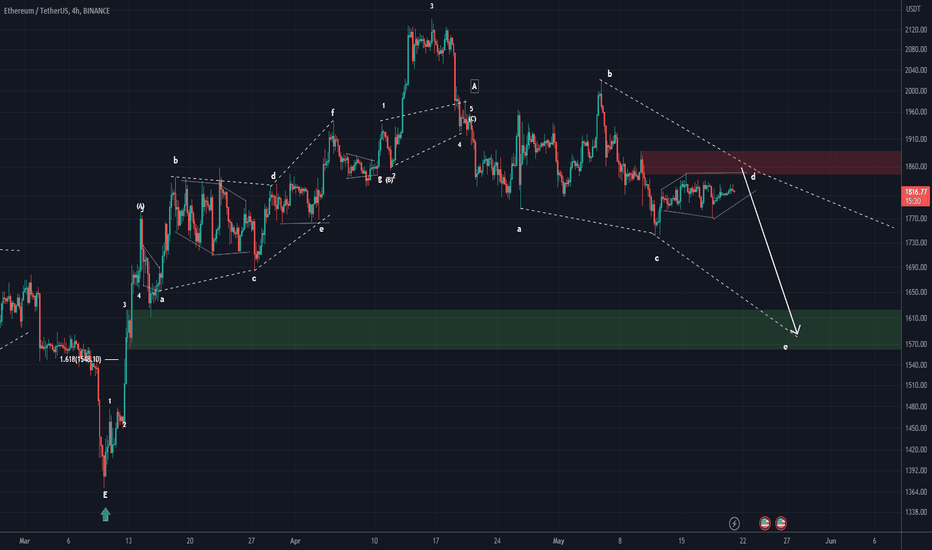
ETH ANALYSIS (4H)Hi, dear traders. how are you ? Today we have a viewpoint to SELL/SHORTthe ETH symbol.
For risk management, please don't forget stop loss and capital management
When we reach the first target, save some profit and then change the stop to entry
Comment if you have any questions
Thank You
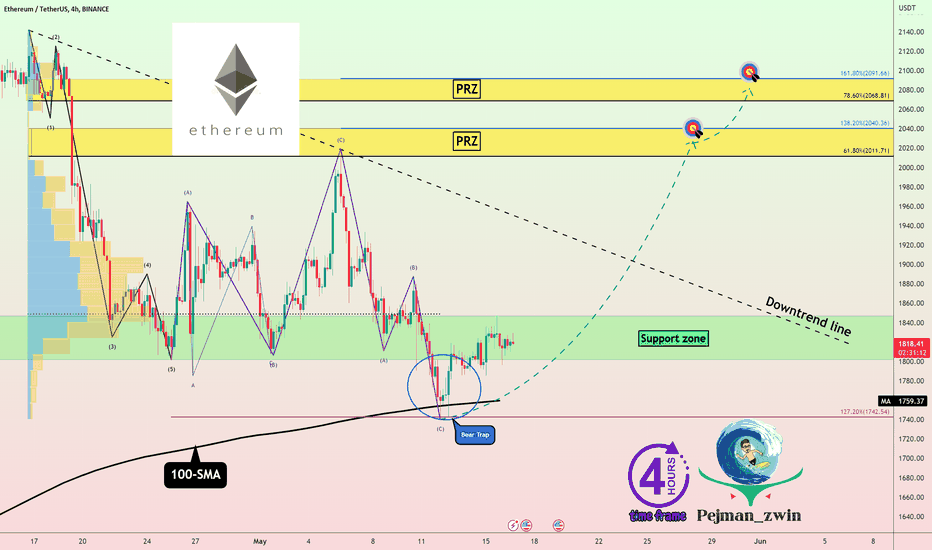
Ethereum minimum growth of ➕10%!!!🚀Ethereum seems to have created a 🐻bear trap🐻 (but the 100-SMA held Ethereum well).
According to Elliott Wave theory, Ethereum is completing a c orrective structure .
Ethereum correction structure can be Expanding Flat(ABC/3-3-5) or even Double Three Correction(WXY) .
I expect Ethereum to go up to 🟡 PRZs(Price Reversal Zones) 🟡 after breaking the downtrend line .
Ethereum Analyze ( ETHUSDT ), 4-hour time frame ⏰.
Do not forget to put Stop loss for your positions (For every position you want to open).
Please follow your strategy, this is just my Idea, and I will be glad to see your ideas in this post.
Please do not forget the ✅' like '✅ button 🙏😊 & Share it with your friends; thanks, and Trade safe.
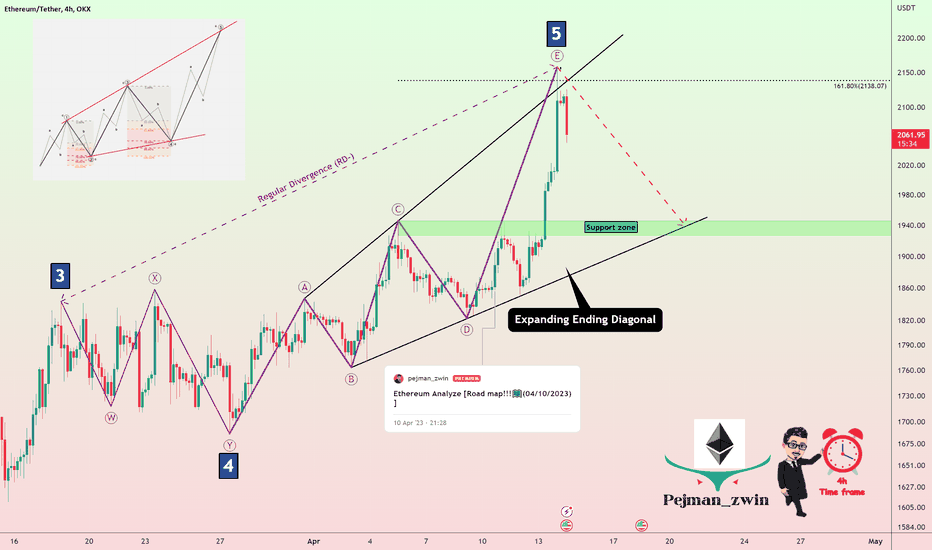
Ethereum falls by Expanding Ending Diagonal😉Ethereum was able to complete main wave 5 by Expanding Ending Diagonal.😉
Also, we can see Regular Divergence (RD-) between the end of main waves 3 & 5.
I expect Ethereum will go down at least to the 🟢support zone($ 1945.8-$ 1926.5)🟢 and lower line of expanding ending diagonal.
If you want to know my Ethereum roadmap, I suggest you see the following post.👇
Ethereum Analyze ( OKX:ETHUSD T ), 4-hour time frame ⏰.
Do not forget to put Stop loss for your positions (For every position you want to open).
Please follow your strategy, this is just my Idea, and I will be glad to see your ideas in this post.
Please do not forget the ✅' like'✅ button 🙏😊 & Share it with your friends; thanks, and Trade safe.
ETH/USD 1DAY UPDATE BY CRYPTO SANDERS !!Hello, welcome to this ETHEREUM /USDT update by CRYPTO SANDERS.
CHART ANALYSIS:- Ethereum (ETH) was back above a key price level to start the weekend, as it once again rose above the 1,800 mark.
ETH/USD hit a peak of 1,816.06 in today’s session, less than 24 hours after declining to a low of 1,747.94.
Bulls have seemingly taken yesterday’s move to a multi-week low as an opportune moment to increase position sizes in ETH.
this was helped by the fact that RSI found a stable point of support, which in the case of ethereum was at the 41.00 zone.
From the floor, price strength is now taking close to a ceiling at 45.00, and should this be broken, ETH will possibly move back above a key point at 1,830
Hit the like button if you like it and share your charts in the comments section.
Thank you
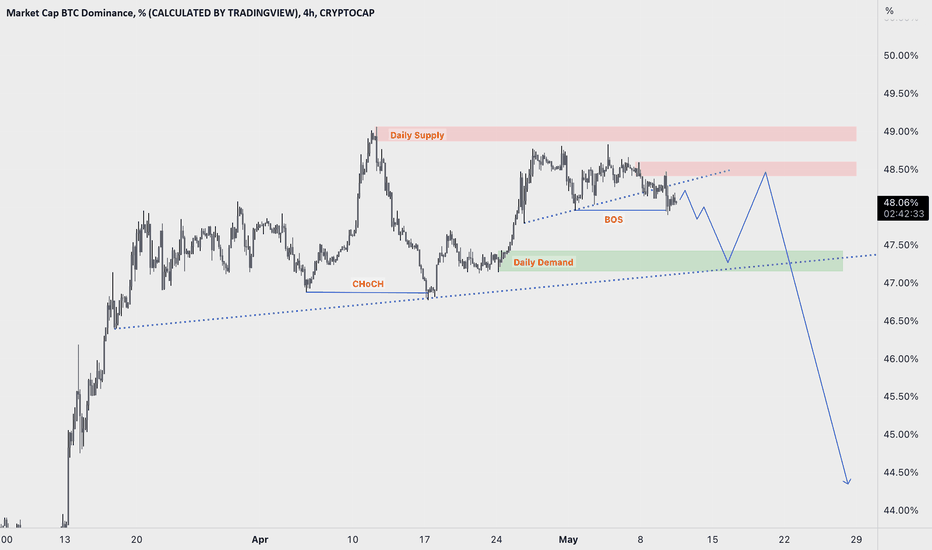
BTC.D H4 : ALT-SEASON is loading ...Hi guys Hope you well.
The things you can see in the four-hour time frame, you can see the change of structure market . Also, in the daily time, we are at the ceiling of the long-term trading range. Let's see the altcoin market.I expect that altseason is so near. Please see the previous analysis for a better understanding in the previous channel
SecondChanceCrypto
11/May/23
(DYOR)
Always do your research .
If you have any questions, you can write them in the comments below, and I will answer them.
And please dont forget to support this idea with your likes and comments
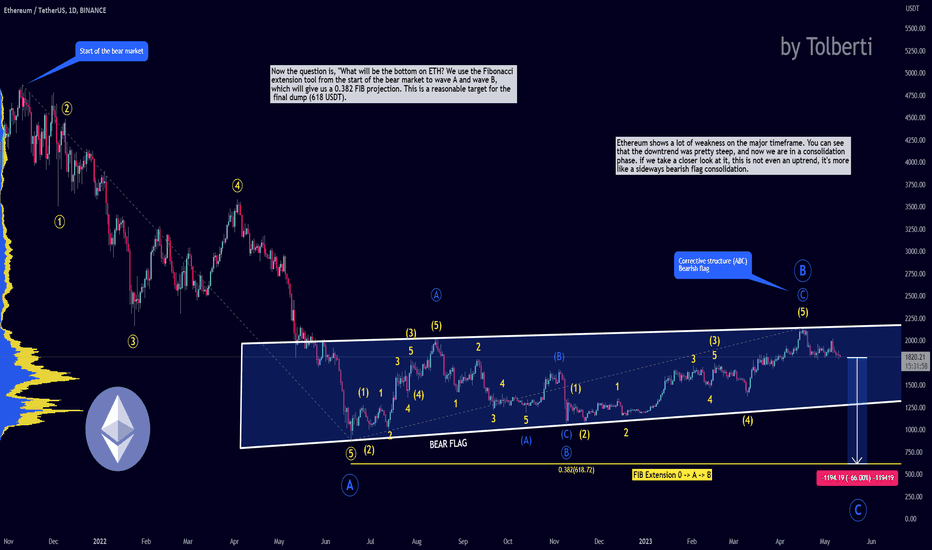
Ethereum - Weekly bearish flag will send ETH to 618 USDT (gg)
Ethereum shows a lot of weakness on the major timeframes. You can see that the downtrend was pretty steep, and now we are in a consolidation phase. If we take a closer look at it, this is not even an uptrend; it's more like a sideways bearish flag consolidation.
A trendline from 2015 on the ETHBTC chart is breaking down, which is a significant bearish technical event. Make sure you check out the trendline in the related section down below!
Now the question is, "What will be the bottom on ETH?" We use the Fibonacci extension tool from the start of the bear market to wave A and wave B, which will give us a 0.382 FIB projection. This is a reasonable target for the final dump (618 USDT).
This analysis is not a trade setup; there is no stop-loss, entry point, profit target, expected duration of the trade, risk-to-reward ratio, or timing. I post trade setups privately.
You can see my Elliott Wave count on the chart. I don't know what's yours, but you can take some inspiration. A lot of people are very bullish at this moment, but the chart does not look bullish. The previous downtrend from 2021 - 2022 was extremely steep and impulsive, which you do not want to see as a bull. We need to finish the major ABC correction to start the true bull market.
ETH is going sideways. It has been almost 1 year of sideways price action. I don't see anything bullish, and it's better to sell all your ETH if you haven't already and short ETH to make money.
Thank you, and for more ideas, hit "Like" and "Follow"!
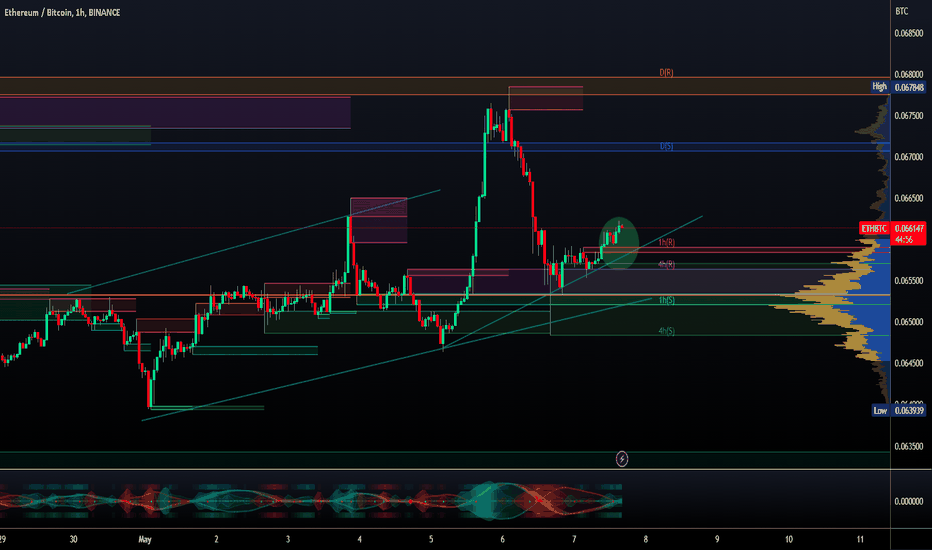
ETH/BTC - Ethereum: Resistance_Breakout_Confirmation◳◱ A Resistance Breakout and Confirmation has been detected on the CRYPTOCAP:ETH / CRYPTOCAP:BTC chart. The price has broken above a key resistance level and has been confirmed by a strong candle, indicating a potential bullish trend. The next resistance key levels are located at 0.066486 | 0.068992 | 0.072769, and the major support zones can be found at 0.062709 | 0.061438 | 0.057661. Consider entering a trade at the current price zone of 0.06616 and targeting higher levels.
◰◲ General info :
▣ Name: Ethereum
▣ Rank: 2
▣ Exchanges: Binance, Kucoin, Huobipro, Gateio, Poloniex, Mexc
▣ Category/Sector: Infrastructure - Smart Contract Platforms
▣ Overview: Ethereum is a distributed blockchain computing platform for smart contracts and decentralized applications. Its native token is ether (ETH), which primarily serves as a means of payment for transaction fees and as collateral for borrowing specific ERC-20 tokens within the decentralized finance (DeFi) sector.
◰◲ Technical Metrics :
▣ Mrkt Price: 0.06616 ₿
▣ 24HVol: 4,456.371 ₿
▣ 24H Chng: 0.994%
▣ 7-Days Chng: 2.69%
▣ 1-Month Chng: 3.04%
▣ 3-Months Chng: 19.03%
◲◰ Pivot Points - Levels :
◥ Resistance: 0.066486 | 0.068992 | 0.072769
◢ Support: 0.062709 | 0.061438 | 0.057661
◱◳ Indicators recommendation :
▣ Oscillators: NEUTRAL
▣ Moving Averages: STRONG_BUY
◰◲ Technical Indicators Summary : BUY
◲◰ Sharpe Ratios :
▣ Last 30D: 0.07
▣ Last 90D: 1.20
▣ Last 1-Y: -0.05
▣ Last 3-Y: 1.26
◲◰ Volatility :
▣ Last 30D: 0.55
▣ Last 90D: 0.56
▣ Last 1-Y: 0.82
▣ Last 3-Y: 0.90
◳◰ Market Sentiment Index :
▣ News sentiment score is 0.69 - Bullish
▣ Twitter sentiment score is 0.53 - Bullish
▣ Reddit sentiment score is 0.54 - Bullish
▣ In-depth ETHBTC technical analysis on Tradingview TA page
▣ What do you think of this analysis? Share your insights and let's discuss in the comments below. Your like, follow and support would be greatly appreciated!
◲ Disclaimer
Please note that the information and publications provided are for informational purposes only and should not be construed as financial, investment, trading, or any other type of advice or recommendation. We encourage you to conduct your own research and consult with a qualified professional before making any financial decisions. The use of the information provided is solely at your own risk.
▣ Welcome to the home of charting big: TradingView
Benefit from a ton of financial analysis features, instruments and data. Have a look around, and if you do choose to go with an upgraded plan, you'll get up to $30.
Discover it here - affiliate link -
ETH: The drop is on the horizon! After thorough analysis, it is apparent that the price of ETH has developed a Head and Shoulders pattern. In the event of a breach below the neckline, a substantial downward movement is anticipated. It is, therefore advisable to closely monitor the neckline for any such movement.
Furthermore, based on the strong correlation between BTC and ETH, it is expected that the latter will follow a similar trajectory as the former. Given the likelihood of BTC decreasing from its present levels, ETH is expected to move downwards as well. Thus, it is reasonable to anticipate that ETH will break below the neckline and experience further downward movement.
With regards to BTC:
It is evident that the price got rejected from the bear market downtrend resistance! There is a possibility that the recent bear market rally has come to an end. The rejection from the downtrend resistance is indicating a potential move to the previous bottom of $15.5k. This notion is consistent with the concept of the price following a pattern reminiscent of the 2021 summer period!
Furthermore, It appears that the current market period is unfolding similarly to the one observed in 2021. If this trend continues, the market will likely experience a downward movement, potentially leading to a decline in value to 13.5k.
While it's true that history doesn't necessarily have to repeat itself, it is often observed that historical patterns tend to rhyme with the present.
It also appears the price is forming a head & shoulder pattern, indicating a weakening trend! If the price breaks below the neckline, the return to 15k will begin! It is, therefore, advisable to keep an eye on the neckline in case it breaks to the downside!
In conclusion, it is anticipated that the price will continue to exhibit a downward trend, with a likelihood of revisiting the 15k level.
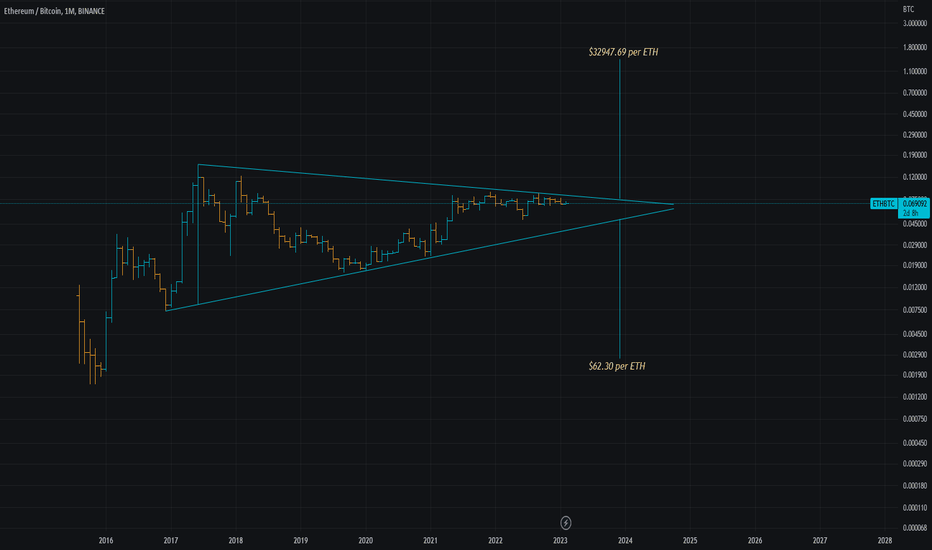
Ethereum to $62.30 - Time to scare the Ethereum kids!
When a macro super symmetrical triangle trend occurs on the log scale, any people holding this Ethereum hopes the trend moves up and not down, a move down will mean the end of Ethereum.
Really failing to rise above near the upper line too.
reducing the supply should do it right?, right? :)
Ethereum ETH Price Targets after the FOMC meeting this weekThe upcoming FED meeting on May 3rd could cause a further decline in the crypto market due to the potential rate hike and ongoing unease around banking system developments.
The outlook for the crypto market after the upcoming FED meeting on May 3rd is bleak.
Fears of a deep credit crunch caused by Silicon Valley Bank's collapse have not yet materialized, and the financial situation is much steadier.
Additionally, inflation remains elevated, and with evidence of stubbornness in underlying inflation, it could be in the 4% to 5% range, far above the 2% inflation target. The markets are pricing in a 25bp Fed Funds rate hike to 5.25% at the May FOMC meeting, and given the steadiness in financial markets, persistence in price pressures, and continued decent activity, this could contribute to a further downturn in the crypto market.
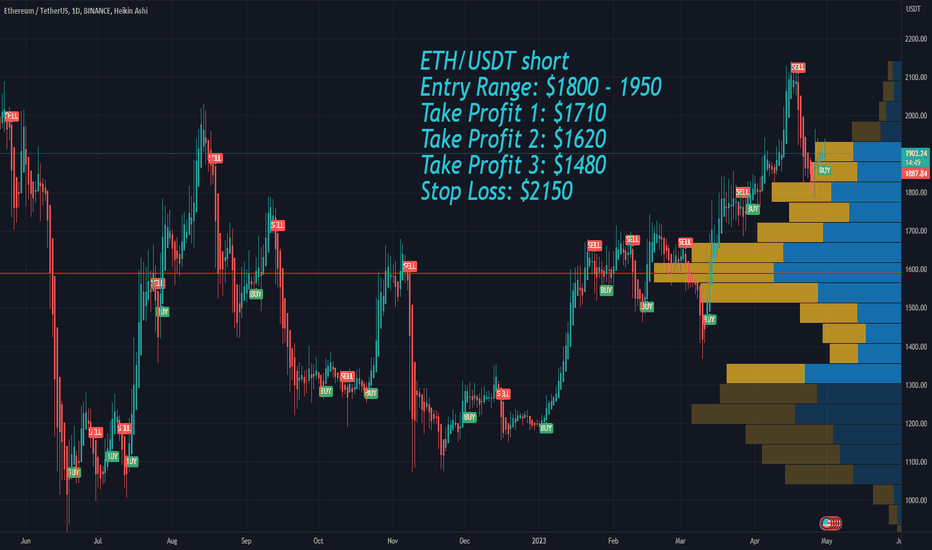
ETH/USDT short
Entry Range: 1800 - 1950 usd
Take Profit 1: 1710 usd
Take Profit 2: 1620 usd
Take Profit 3: 1480 usd
Stop Loss: 2150 usd
