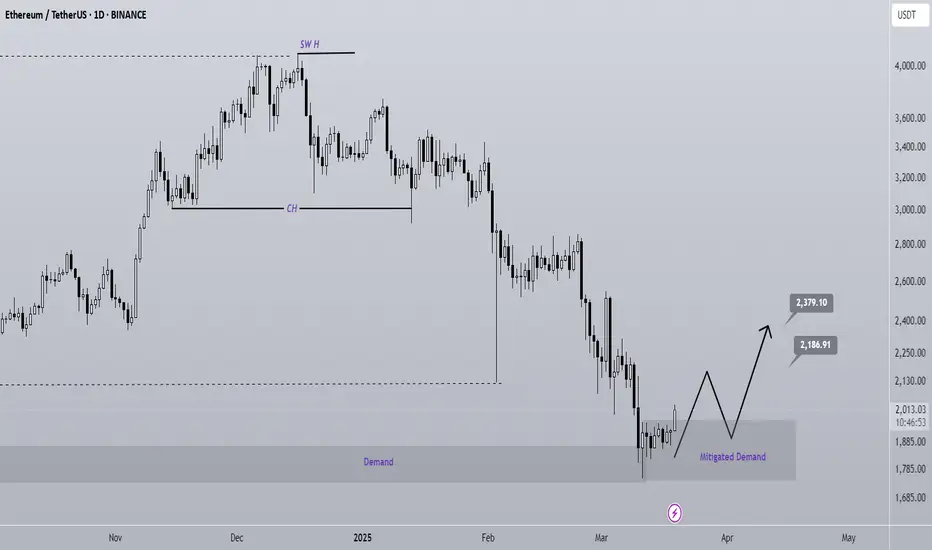
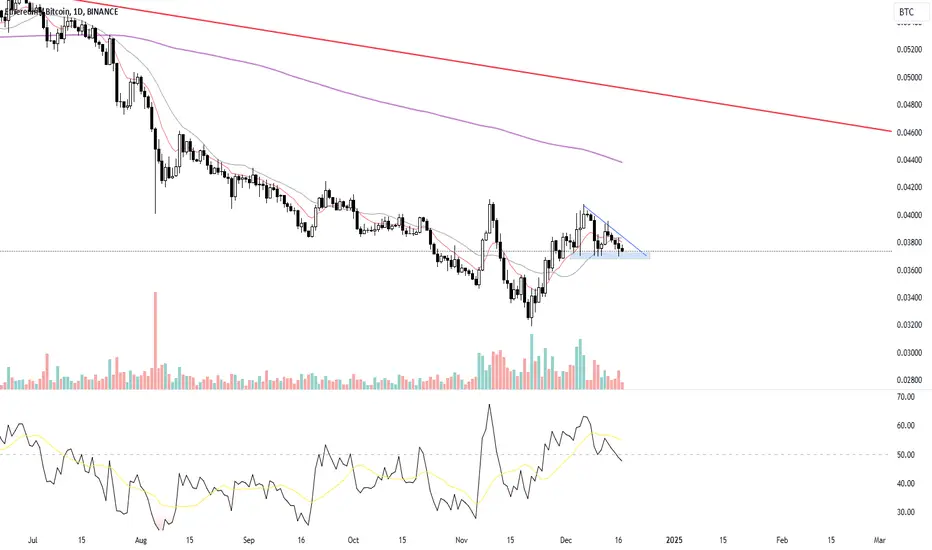
ETH Looks Bullish (1D)Before anything else, you should know that Ethereum's structure in higher time frames is bearish. However, we currently expect an internal pullback to higher levels because the price has reached a significant zone.
The expectation is that the price will move from the mitigated demand zone toward the targets.
A daily candle closing below the invalidation level will invalidate this analysis.
Do not enter the position without capital management and stop setting
Comment if you have any questions
thank you
ETHBTC
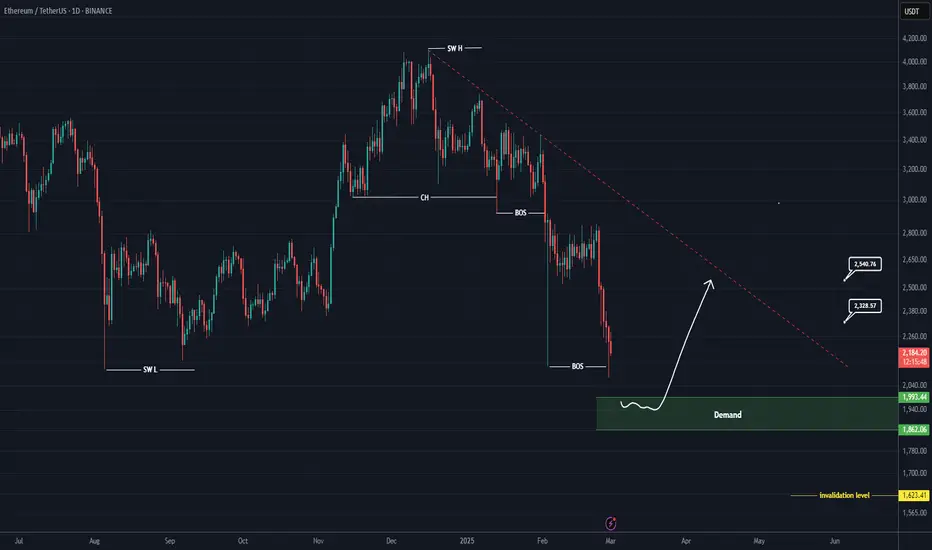
ETH Analysis (1D)Ethereum is approaching a support level.
The risk-to-reward ratio is not very attractive since we are in a bearish trend, but we expect a reaction to the green zone.
There are two targets ahead of the price, which we have marked on the chart.
A daily candle closing below the invalidation level will invalidate this analysis
For risk management, please don't forget stop loss and capital management
Comment if you have any questions
Thank You
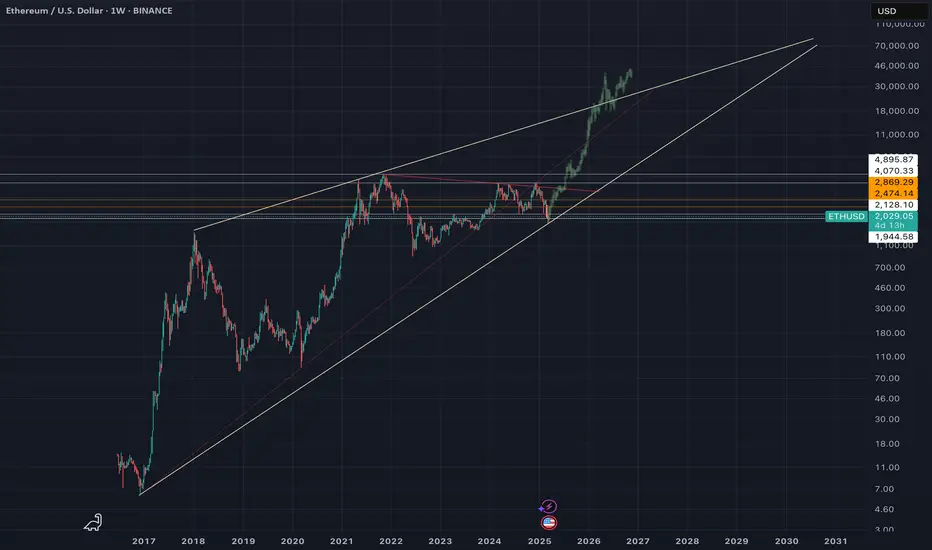
Bullish ETH theories I think this could be a possible scenario for ETH's next breakout. I think it's possible because of the ETH ETFs that will most likely gain some traction over time, and retail will have to play "catch up" due to the price consolidation over these past years. The winds will turn, and I think everything will play out quite quickly when it happens.
I also think the FED will announce the end of QT today at the FOMC, which COULD trigger the next ETH bull run.
Looking at the ETH/BTC chart, I think this will trigger the next leg up and complete the pattern when looking at the weekly chart, testing the previous highs.
When I look at ETH relative to SOL/USD, it also looks bullish in the short term. I think this is quite reliable, but we will see over time. Although I think ETH will outperform both BTC and SOL and play catch-up with them both.
Conclusion: I have deployed most of my crypto portfolio to ETH now, believing ETH will give me the most beta in this bull run over the coming months. I know the sentiment looks quite bad at the moment for ETH, but I believe there is a saying: "Buy when others are fearful, sell when everybody is greedy." I think this is quite similar to value investing, and I believe there is a lot of value in BTC, ETH, and SOL.
Good luck! And share your thoughts, I like to discuss things like this. =)
End of Q1 Hope: Is ETH Ready to Bounce?If there’s one area I’ve been **keen to see a reaction on for ETH/BTC**, it’s this one.
The **monthly target has been hit**, with just **one bar left before expiration**.
Overall, I think the odds of a bounce are increasing—or at the very least, we get a breather in this region.
We’re still halfway through the month, and one key thing I’d love to see is a monthly close above February’s low while holding above the 0.023 zone—a historically pivotal area.
Bidding here carries a 20% drawdown risk, and with the downtrend still active, the chances of getting stopped out remain high. That’s why I’ll wait for the monthly close and alert everyone if bullish signs emerge on lower timeframes—this helps minimize stop-outs.
It’s looking more promising, but for now, I can only act on clear bullish triggers. This pair has been in a multi-year downtrend and is now at the tail end of its last monthly bearish phase. From here, two scenarios:
1. It **stabilizes**, forming a **larger consolidation** before continuing lower.
2. If there’s enough strength, we could see a **relief rally**.
Let's wait a bit more. MARKETSCOM:ETHEREUM CRYPTOCAP:ETH
ETHBTC MACROthe memecoin market dieing off means the market gets a second to think,
conviniently timing up with ethbtc low of december 2020
the complete floodgates of memes and narrative coins that flooded the market over the last few years diluted any liquidity that was educated on the blockchain and its challenges
everyone basically was looking for the next best thing that the obvious infrastructure that was neccesary to even have blockchains online was ignored mostly seen as too obvious an investment and a slow mover..
all the while given how obvious the trade seemed most traders resorted to scalping ethereum lows looking to catch the swing trade into highs
this simply brought the price crashing downward by marketmakers who saw the easy liquidity grab
once you regrasp what this market is and what its thesis' for the future really are not many of the narrative driven coins really fit into it..
for instance xrmr and ltc not dieing off like most other l1s memes and ai coins
long term projects that actually stand the test of time over multiple cycles in this crazy market space..
upon reevaluating this... ethereum becomes the obvious conclusion for an L1 that can withstand multiple cycles, its on the stockmarket with etfs and is used mostly for financial tools rather than meme p+ds
if ethereum really does die off, then btc and other scarcity coins that are holding up just fine around the narrative driven ones
this pivot all coming after ww3 and trade war fears..
all the while btc is trading above 80k
and ethbtc is at opportunity levels not seen for the last 5 years
meanwhile eth etf staking is rumoured for this year and btc public company adoption is going parabolic
intersting times and i still think eth doesnt bleed to 0
that doesnt discount any further down spikes though which there is always a chance of during volatility.
Is it ETHEREUM waking up now? ETHBTCI´d love to see how this one goes. We can see a breakout, and should ride it at least for a +25%.
Ready For ATH?Ethereum's three-month timeframe analysis shows that the price could reach all highs from here.

Ethereum ETHBTCOn this chart I see only cycles, eventually we should arrive at the lower horizontal levels
+Wyckoff
Best regards EXCAVO

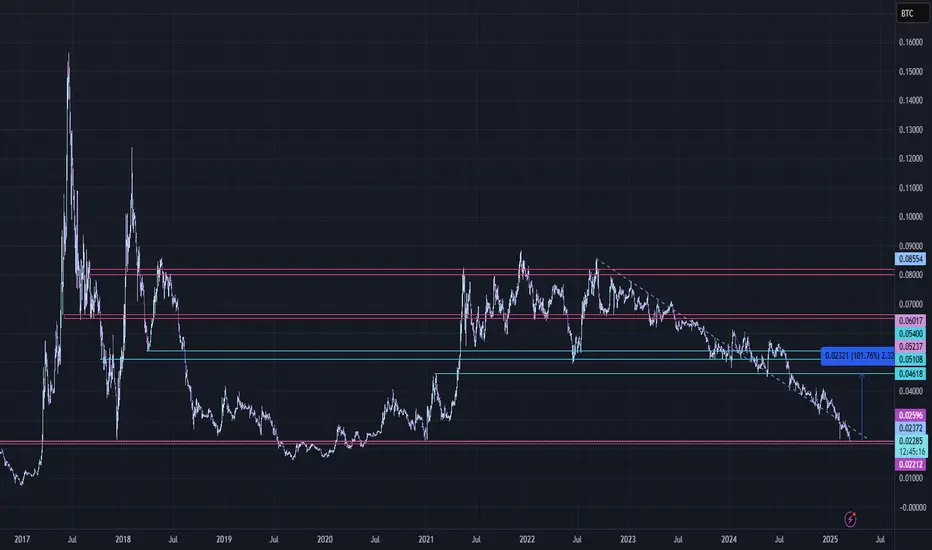
Is SOL/BTC following the ETH/BTC distribution pattern?
As the big red weekly candle closes for BTC, we should see some volatility this week.
Solana valued in BTC has exited a rectangular distribution topping pattern.
Failure to recapture the rectangular box and enter back into it in a spring like move is looking increasingly unlikely.
Ethereum valued in BTC followed a very similar pattern in Nov 2023, exiting the rectangular distribution rectangle and fell much much lower.
The 50 week (blue line) and 200 week (purple line) moving averages also follow a similar trajectory for both instruments / coins.
If SOL / BTC does not recover into the box, and fast I will be exiting a long term position I hold.
Defensive Strategy based on this chart and the USD chart warrants consideration
PUKA

Huge divergence on ETH/BTCETH will soon rise up and we can see signs since now, i predict a epic altseason this year probably ATH Q3 or Q4 of 2025
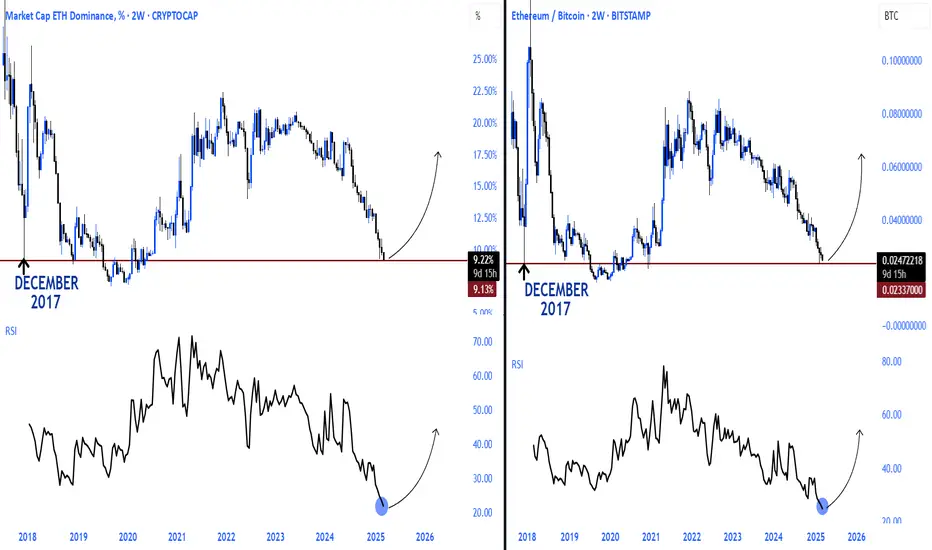
ETHBTC x ETHDBINANCE:ETHBTC and CRYPTOCAP:ETH.D Test December 2017 Lows Ahead of Altseason!
Ethereum Bitcoin pair and Ethereum dominance rsi are at historic lows, which is the most plausible area for a bounce!
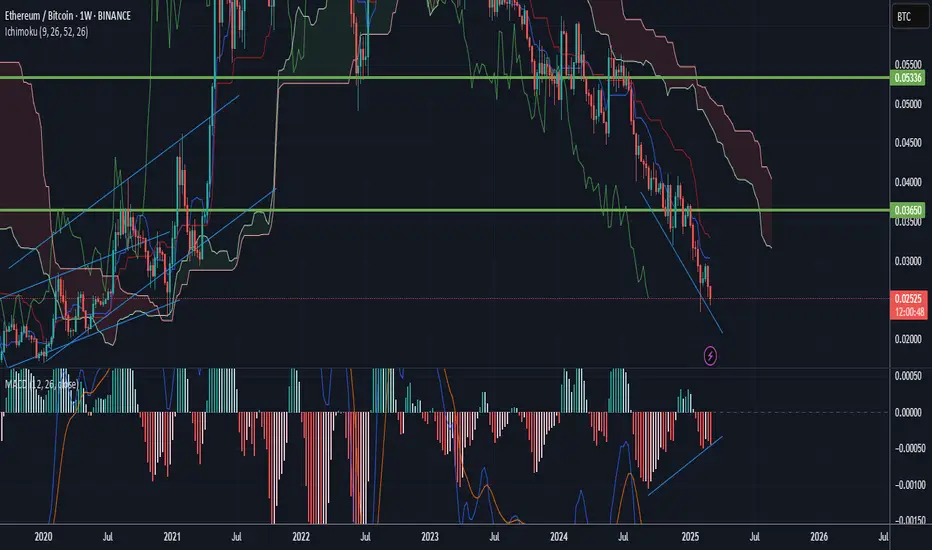
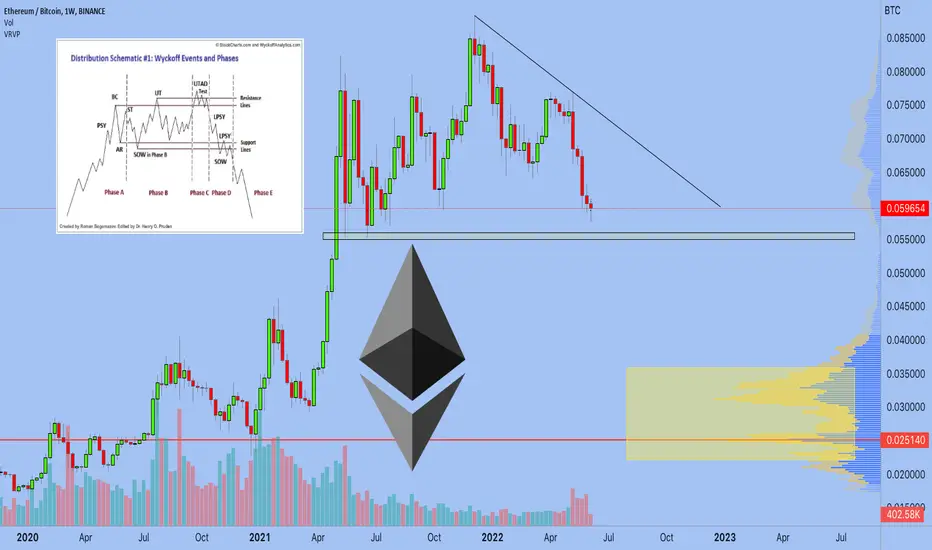
Ethereum - Wyckoff Events and PhasesThe dominance of Bitcoin is growing. When Bitcoin is growing - altcoins are growing less or without rising. Bitcoin falls - alts fall even more.
Paired with ETHBTC, we see a Wyckoff Distribution Schematic #2. We are currently in Phase D. The price is approaching a support zone. Most likely, there will be some descending trading near this zone. We will form LPST (a last point of supply) and SOW (a sign of weakness). Next, we are waiting for Phase E.
Best regards,
EXCAVO
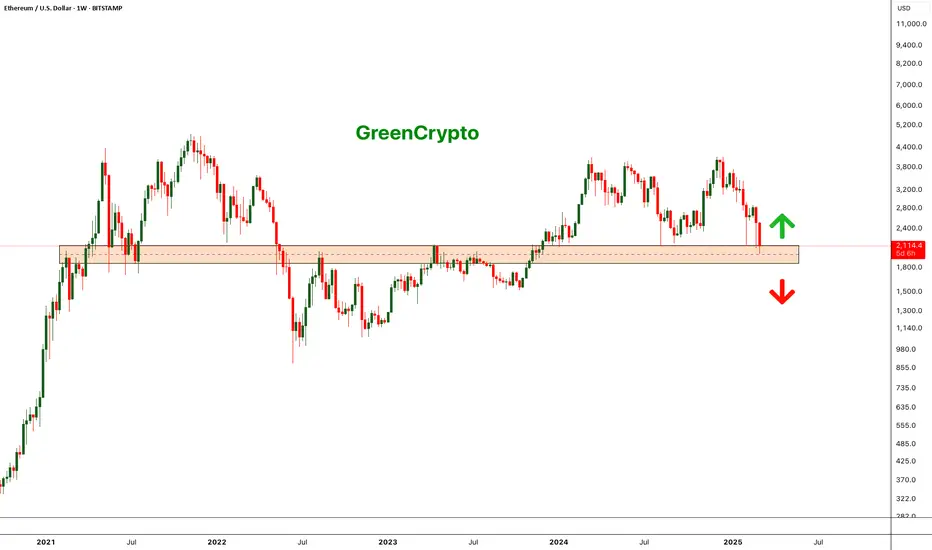
Death of ETH ?ETH is currently trading at a crucial support zone. A breakdown from this strong level could push ETH into a bearish trend, making recovery difficult.
However, if ETH manages to reverse from the $1,800–$2,000 support zone, there’s hope for a strong performance ahead. A further crash below this zone could have a severe impact on the entire Ethereum ecosystem.
The next two weeks will be critical—let’s see how things unfold. Hoping for a reversal from this support level!
Stay tuned for more updates.
Cheers,
GreenCrypto Team
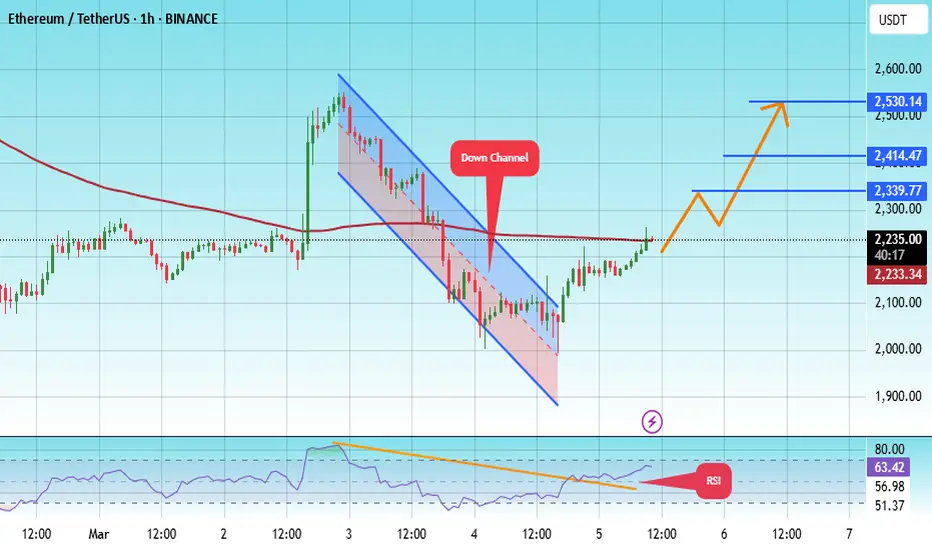
#ETH/USDT#ETH
The price is moving in a descending channel on the 1-hour frame and is adhering to it well and is heading to break it strongly upwards and retest it
We have a rebound from the lower limit of the descending channel, this support is at a price of 1950
We have a downtrend on the RSI indicator that is about to break and retest, which supports the rise
We have a trend to stabilize above the moving average 100
Entry price 2236
First target 2340
Second target 2414
Third target 2530
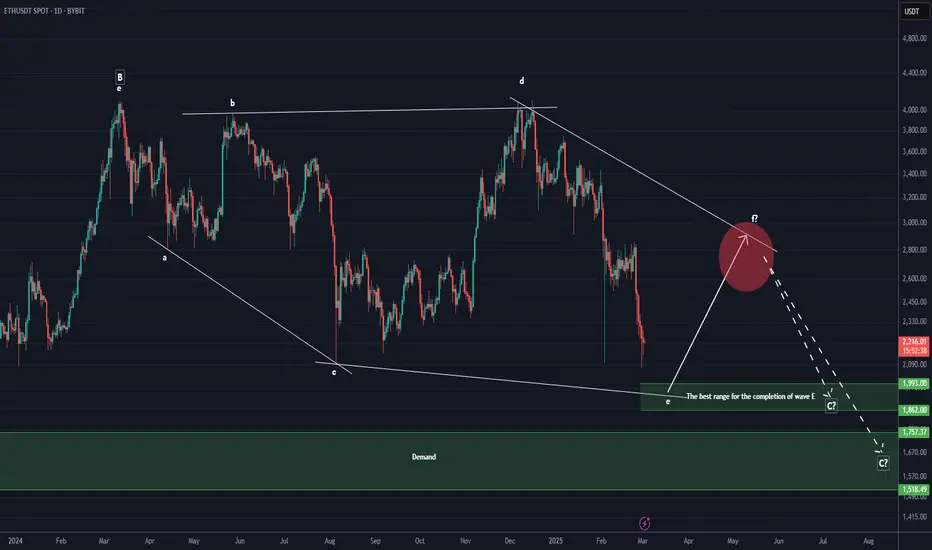
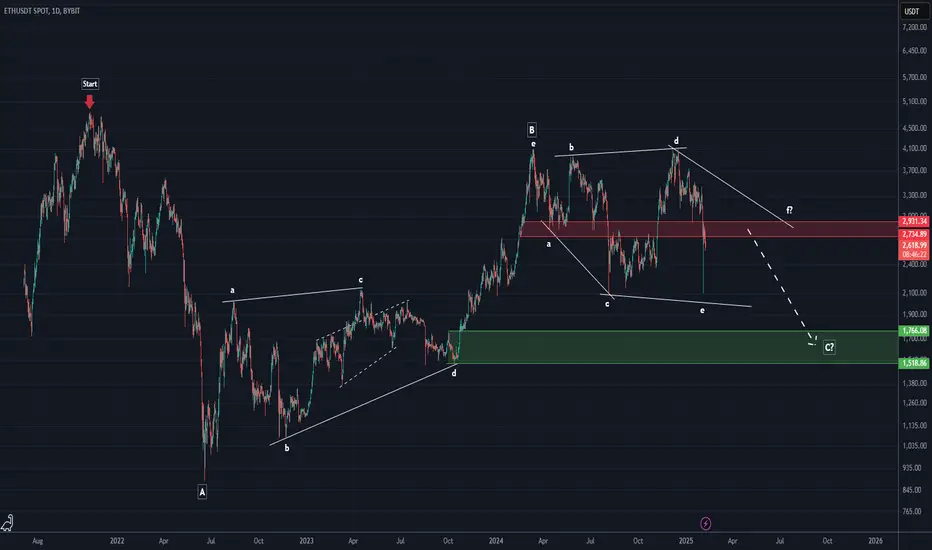
ETH NEW ANALYSIS (1D)A more comprehensive analysis for Ethereum is as follows:
It seems that wave E of our Diametric is nearing completion. For wave F, Ethereum should experience upward retracements and spend some time consolidating.
The best zone for the completion of wave E is marked on the chart as the upper green box.
The optimal rejection area for price to move downward and complete wave F is marked by the red circle. Now, we wait to see whether the price reaches this zone for wave F or not.
Wave G may have two potential targets: either the upper or lower green box at the bottom of the chart.
For risk management, please don't forget stop loss and capital management
Comment if you have any questions
Thank You
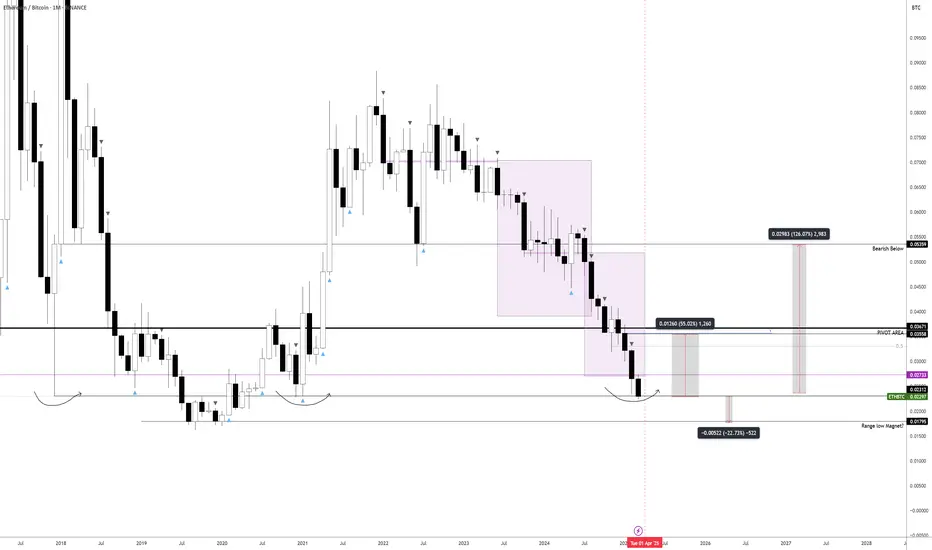
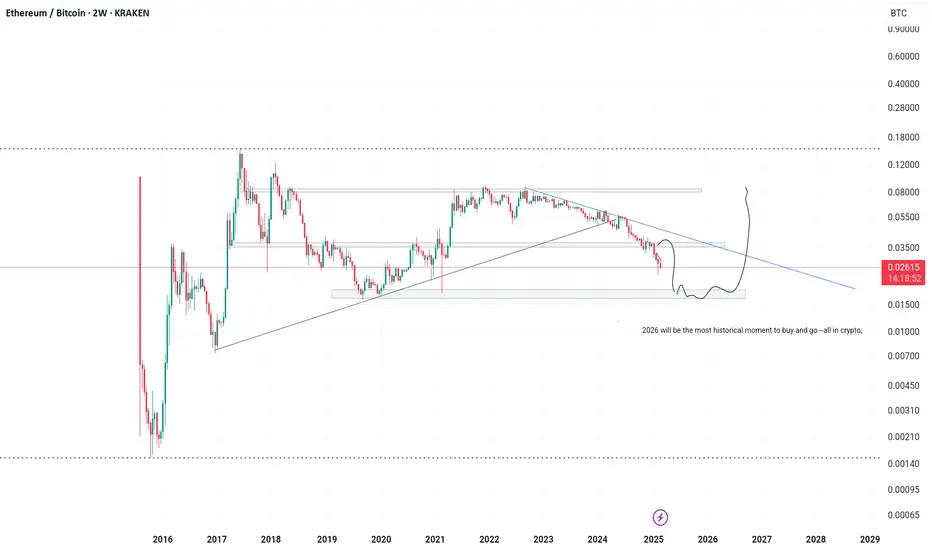
ETHBTC analyse for 2025-2026I did my analyse on this chart around December 2024 and I showed some friends too. My bad to place it now, but the real pain will start soon. If you look closely at the ETH/BTC charts, you’ll see ETH has broken its 8-year uptrend and lost a key level, pausing around 0.036. My expectation is that price will move down to the lower green bar I’ve marked; if it can hold there, we could see a local bottom forming.
It’s wild that so many paid “crypto gurus” have been calling for an altseason over the last nine months even 1 year... despite the clear downtrend. This chart alone shows how misguided those calls have been. Always do your own analysis and don’t let anyone sell you illusions!!
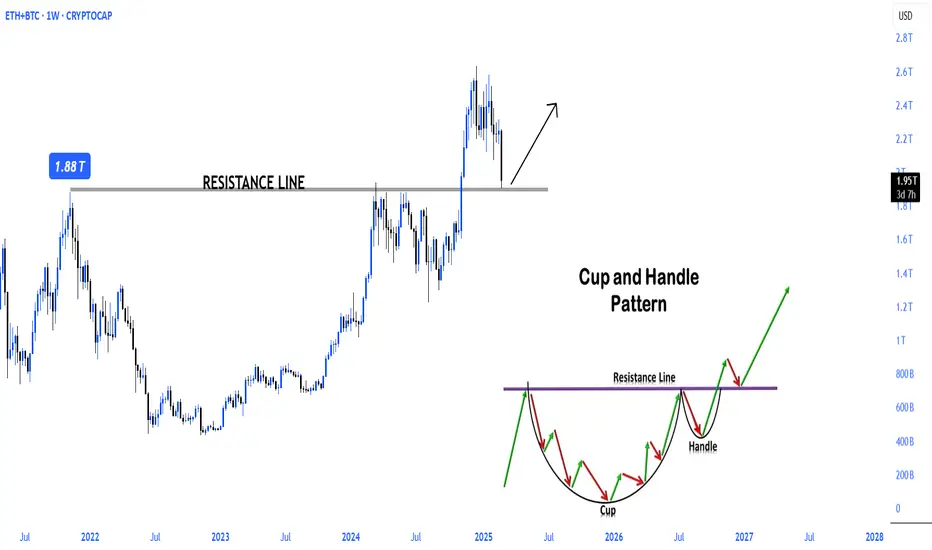
$ETH + $BTC CryptocapCRYPTOCAP:ETH + CRYPTOCAP:BTC Cryptocap pair confirms the r-test phase after the handle cup formation breakout
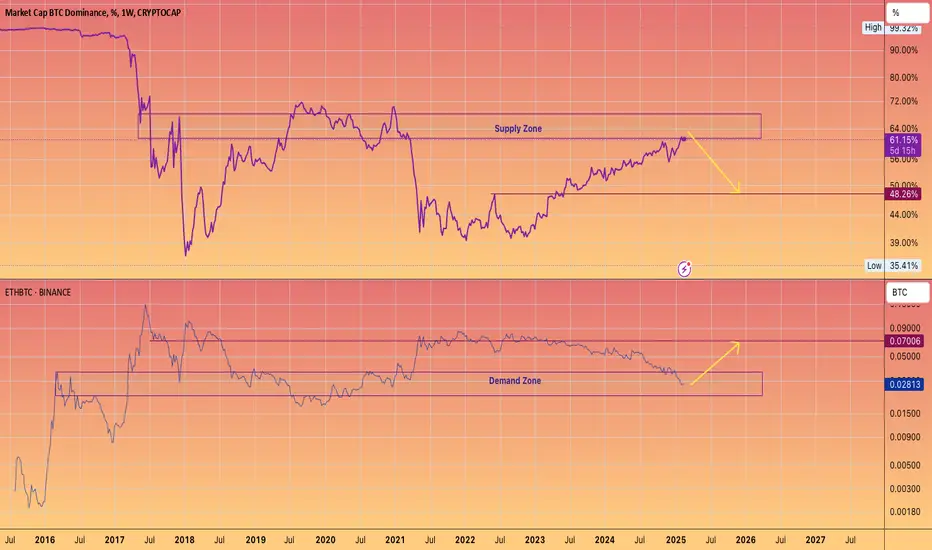
Supply & Demand for BTC.d <---> ETHBTCA notable change may be occurring in the market dynamics surrounding Bitcoin dominance, which reflects BTC’s share of the overall cryptocurrency market. Recently, it has displayed a shooting star candle, indicating a potential decline in BTC’s market influence. These signs point towards the beginning of an alt season, a time when alternative cryptocurrencies tend to outperform Bitcoin. With BTC stabilising around the significant $100k mark, the environment appears ripe for altcoins to attract investor interest. The upcoming weeks will be crucial in assessing whether this trend will gain traction, possibly transforming the market landscape for 2025.
Bitcoin experienced an impressive 2024, achieving new milestones and reinforcing its status as the market frontrunner. As we move into 2025, BTC remains robust, yet a shift in market dynamics may be imminent. Historically, Bitcoin’s dominance tends to wane when altcoins start to gain momentum, and this year might follow that pattern.
As Bitcoin finds stability around crucial price points, we often see liquidity shifting towards altcoins, sparking what many refer to as an alt season. Historically, during these times, altcoins tend to surpass Bitcoin in performance, offering significant returns for those investors ready to explore beyond BTC. With TOTAL3 approaching new price discovery and Bitcoin's dominance on the decline, the potential for altcoins to take center stage is becoming more apparent.
The crucial factor for BTC.d to unlock is how ETH performs against BTC. With the ETH/BTC ratio below 0.03, it appears appealing, but until it begins to rise, the alt season will be postponed. Alt season typically arises when Bitcoin dominance is high, not when it's low.
Typically, Bitcoin dominance tends to decrease in the years following a halving event. Therefore, I suspect that by the end of the year, dominance will be in the negative. However, up to this point, we have seen an increase in dominance this year.
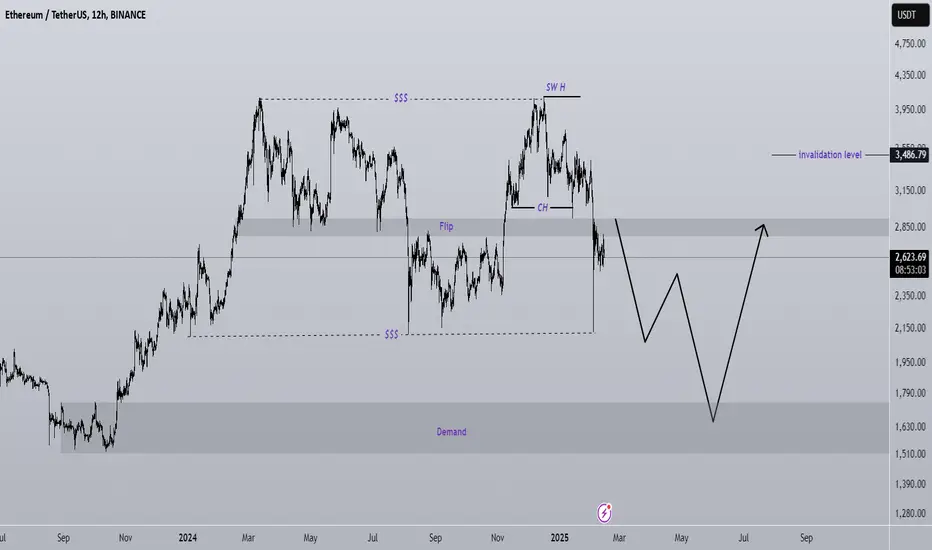
Ethereum has turned bearish (12H TF)After the CH turned bearish and lost the flip zone, along with the formation of a large liquidity pool below the chart, there are multiple confirmations that Ethereum is in a bearish structure.
It is expected to reach the lower demand zone and sweep the liquidity pool along its path.
A daily candle closing above the invalidation level will invalidate this analysis.
Do not enter the position without capital management and stop setting
Comment if you have any questions
thank you
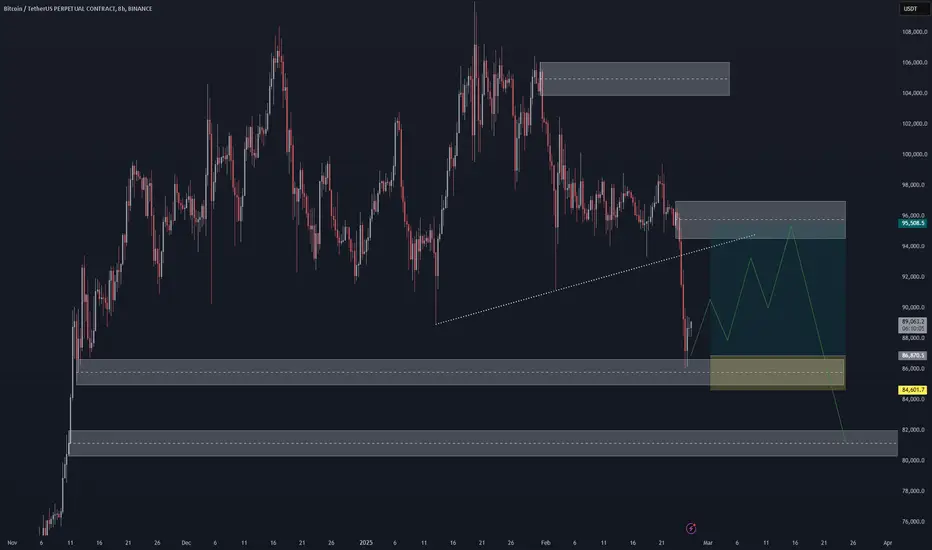
BTCUSDT H8 : SHORT positionHi Guys ,
This my new analysis for BITCOIN , Please check it and do your best.
SecondChanceCrypto
⏰ 26/FEB/25
⛔️DYOR
Always do your research.
If you have any questions, you can write them in the comments below and I will answer them.
And please don't forget to support this idea with your likes and comments.
The bearish scenario for Ethereum is now active (1D)We have always relied on the flip zone from our previous Ethereum analyses. Now that this zone has been broken, the bearish scenario for Ethereum is active.
A more accurate interpretation suggests that this is the correct structure. Given this, we have been in Ethereum's bearish Wave C for some time.
Ethereum is expected to move from the red zone toward the green zone soon.
For risk management, please don't forget stop loss and capital management
Comment if you have any questions
Thank You
ETH Is Always "Dead" On Support MartyBoots here , I have been trading for 17 years and sharing my thoughts on ETH here.
ETH is looking beautiful , very strong chart for more upside if this support can hold
Do not miss out on ETH as this is a great opportunity
Watch video for more details

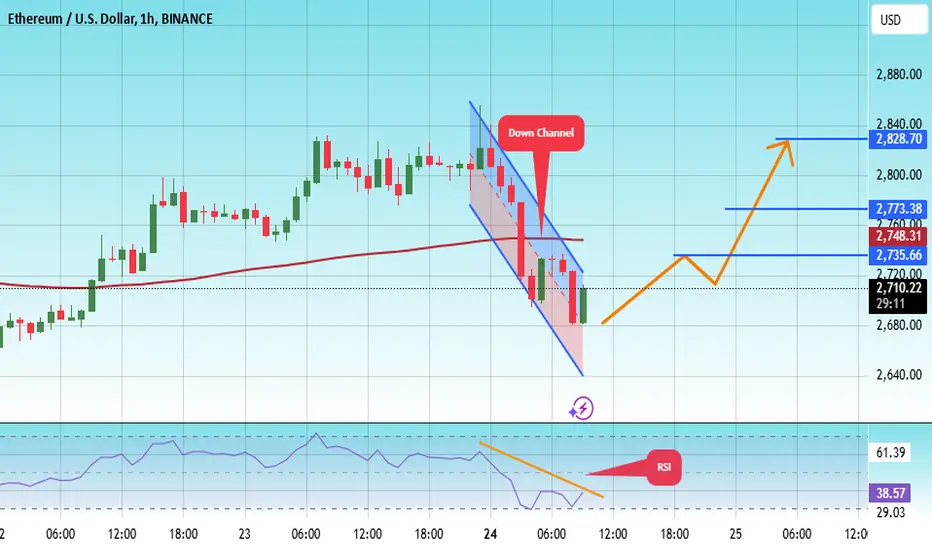
#ETH/USDT#ETH
The price is moving in a descending channel on the 1-hour frame and is adhering to it well and is heading to break it strongly upwards and retest it
We have a bounce from the lower limit of the descending channel, this support is at a price of 2660
We have a downtrend on the RSI indicator that is about to break and retest, which supports the rise
We have a trend to stabilize above the moving average 100
Entry price 2694
First target 2735
Second target 2773
Third target 2828