ETH.D (Ethereum Dominance) Weekly TF 2025
Summary:
Ethereum Dominance (ETH.D) has likely bottomed after retracing to its 78.6% Fibonacci level (~6.59%) and is showing early signs of a structural reversal. With institutional inflows, growing staking adoption, and key upcoming Ethereum upgrades, ETH.D may reclaim significant market dominance over the next 12–18 months. Our chart anticipates a bounce-pullback-rebound structure, aiming for 3 target zones: TP1 (23.5%), TP2 (30.8%), and TP3 (39%).
Contextual Market Alignment:
This ETH.D bullish bias aligns strongly with our broader market outlook:
TOTAL Market Cap Analysis → Bullish breakout structure, indicating overall crypto expansion.
TOTAL2 (Altcoin Market Cap Ex-BTC) → Bullish retracement completion and extension targets active.
BTC.D (Bitcoin Dominance) → Bearish confluence zone, suggesting Bitcoin may underperform versus ETH and altcoins, freeing up dominance space for ETH.D to rise.
Chart Context:
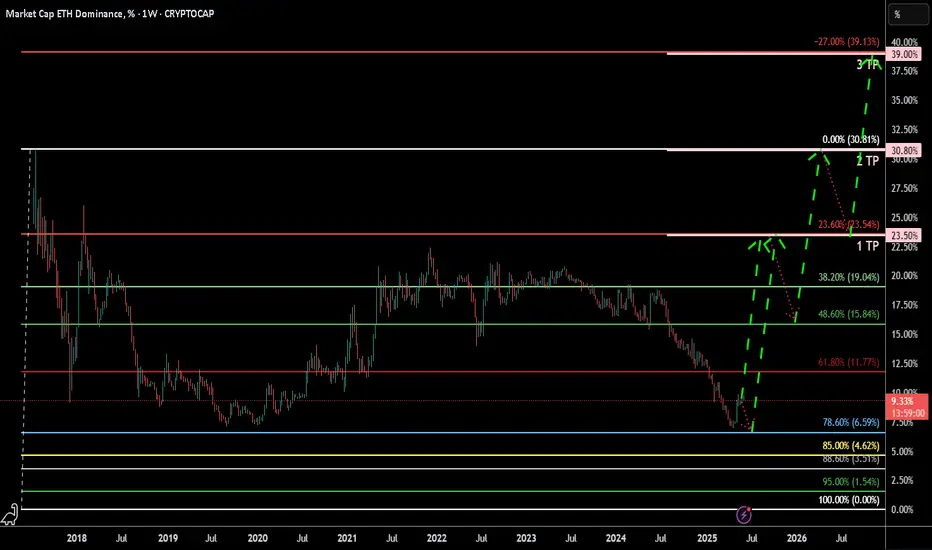
This weekly ETH.D chart uses a Fibonacci retracement from the top (~30.81%) to bottom (0%) to identify potential reversal zones. The dominance hit a key support area at the 78.6% Fib retracement (6.59%), showing a reaction that may develop into a reversal. The roadmap includes:
Rebound toward TP1 (23.54% = 23.5%)
Minor correction or consolidation
Breakout continuation toward TP2 (0.0% = 30.8%)
Extension leg targeting TP3 (–27% = 39%)
Key Technical Observations:
Support Levels:
78.60% = 6.59% (bottom support)
88.60%=3.5%
Possible Resistances:
61.80% = 11.77%
48.60% = 15.84%
38.20% = 19.04%
Resistance & TPs:
TP1: 23.54% (23.6% Fib)
TP2: 30.81% (Full retrace = 0%)
TP3: 39.13% (–27% extension)
Current level: ~9.36%
Clear bullish structure with a “bounce–pullback–rebound” sequence
Indicators:
Fibonacci retracements from ~30.81% to 0%
Structural pattern: rounded bottom / double bottom
Hidden bullish divergence forming on weekly timeframe
Fundamental Context:
Institutional Inflows & ETF Dynamics:
Since July 2024’s launch of spot Ether ETFs, inflows have been strong with a 15-day streak totaling approximately $837 million (~25% of total net inflows).
Recently, the SEC approved options trading on spot ETH ETFs (e.g., BlackRock, Grayscale), deepening liquidity and offering hedging mechanisms.
BlackRock is now pushing to add staking functionality allowing yield generation within an ETF wrapper. If approved, this could markedly increase demand.
Staking Growth & On-Chain Supply Dynamics:
27% of ETH is already staked, and ETF inflows could lift that by >10%.
A staking ETF would institutionalize ETH staking: more capital locked, less circulating supply → supply constraints could support dominance and valuation.
Ethereum Backbone in DeFi & RWA:
Ethereum still leads the Real-World Asset (RWA) space: over 50% market share and ~$5–6 billion in assets tokenized on-chain.
Its core infrastructure underlies the majority of DeFi, smart contracts, and stablecoins, reinforcing ETH.D’s structural resilience.
Network Upgrades & Tech Progress:
The Pectra upgrade (mid-2025) is on the horizon, introducing EIP-7251/7702, improving validator flexibility and network usability.
Combined with recent Dencun improvements, Ethereum is becoming cheaper and more efficient, boosting adoption in L2 ecosystems.
Price action & on-chain indicators:
ETH price has surged ~46% in the past 30 days, driven by ETF demand; some analyst forecasts target $3,000–5,000 year-end.
The withdrawal of ~$1.2 billion ETH from exchanges suggests increasing long-term holdings and less selling pressure.
Integrating with Your Technical Setup:
Level: 78.6%–61.8% bounce zones (6–11%)
Fundamental Support: Institutional re-entry via ETFs often begins with accumulation near support.
Level: TP1 at 23.6% (23.5%)
Fundamental Support: Could coincide with ETF inflows + early vesting of staking narratives.
Level: TP2 (~30.8%)
Fundamental Support: Full retrace driven by mass ETF adoption, options trading, and upgrade momentum.
Level: TP3 >39% (–27% ext.)
Fundamental Support: If staking ETF and yield-bearing structures go live, ETH.D could reach new dominance highs.
Summary of Fundamental Catalysts:
Spot ETH ETF inflows (~$800 M), with options exposure adding liquidity.
Upcoming staking ETF (BlackRock, Grayscale) with >10% locked-up supply implications.
Ethereum remains the DeFi and RWA backbone, sustaining structural demand.
Protocol upgrades (Pectra, Dencun) enhance scalability and adoption.
On-chain withdrawal trends show growing holder conviction.
Narrative / Bias & Strategy Implication:
ETH.D has likely completed its correction and is primed for a staged bullish reversal, mirroring prior cycles. The chart forecasts a rally toward TP1, where some short-term profit-taking and rotation to alts may occur (Alts season). Following that, a retrace may set up the next impulsive move to reclaim lost dominance and eventually challenge prior highs.
Time Horizon: Mid-2025 to late 2026
Ethd
A wonderful ALTCOIN Bullrunis all set in motion.
If my chart resonates with you in any way.
The combined dominance charts of the big four.
#BTC.d
#ETH.d
#USDC.d
#USDT.d
We are on our way to my anticipated target zone.

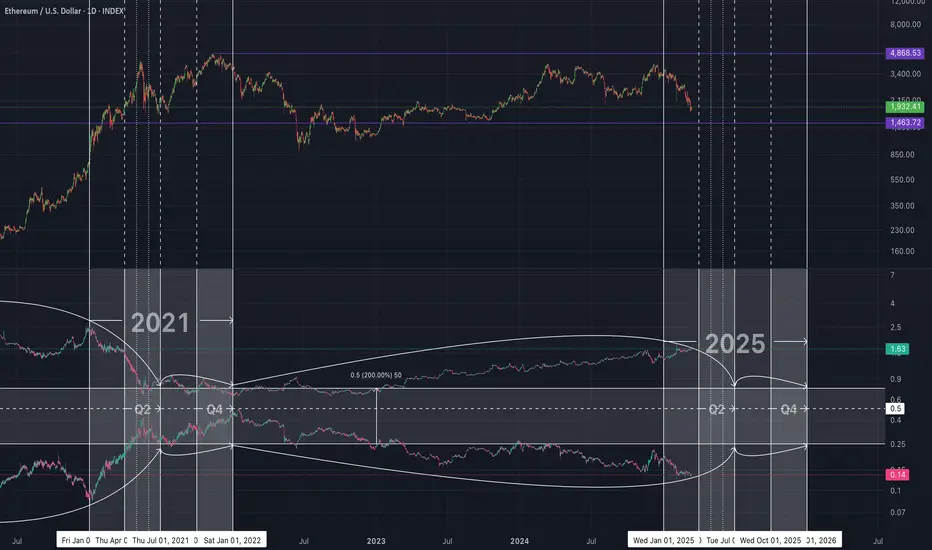
Real Actual Alt Season Tracker!In Crypto Autumn (post halving years), look at how BTC/TOTAL2 collapses and OTHERS/BTC soars into Quarter 2 & 4! Will this year be different?
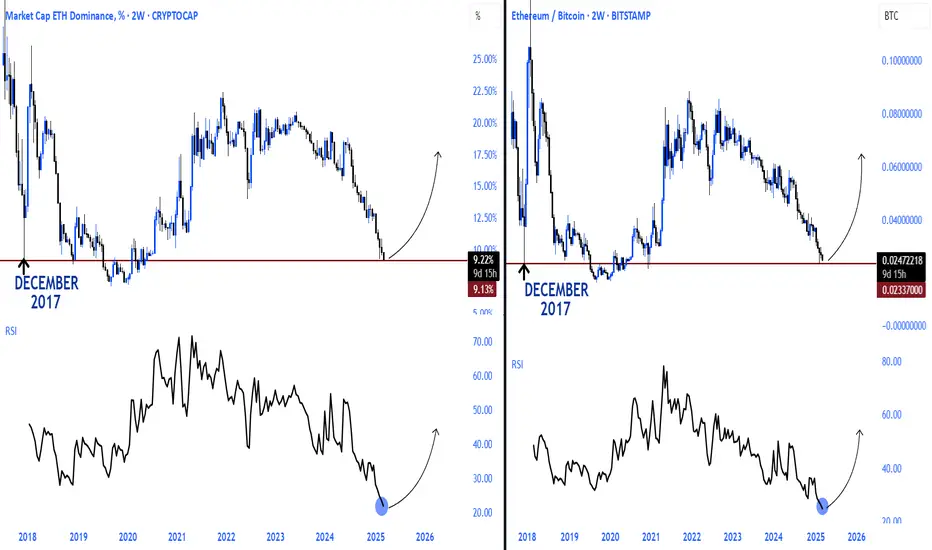
ETHBTC x ETHDBINANCE:ETHBTC and CRYPTOCAP:ETH.D Test December 2017 Lows Ahead of Altseason!
Ethereum Bitcoin pair and Ethereum dominance rsi are at historic lows, which is the most plausible area for a bounce!
Ethereum ETH Will Outperform Bitcoin In 2025!Hello, Skyrexians!
Recently we analyzed the Ethereum price chart and we expect the huge growth, but there is another one important question, what is going to be more profitable in the upcoming year, sit in Bitcoin or Ethereum? CRYPTOCAP:ETH.D can help us to answer this question. Moreover, if ETH will outperform the market, layer 2 such as BINANCE:OPUSDT , BINANCE:ARBUSDT and BINANCE:STRKUSDT will also show the great performance. We know that most of you are thinking that these projects are dead, but in case of this analysis plays out they can revive from the dead zone!
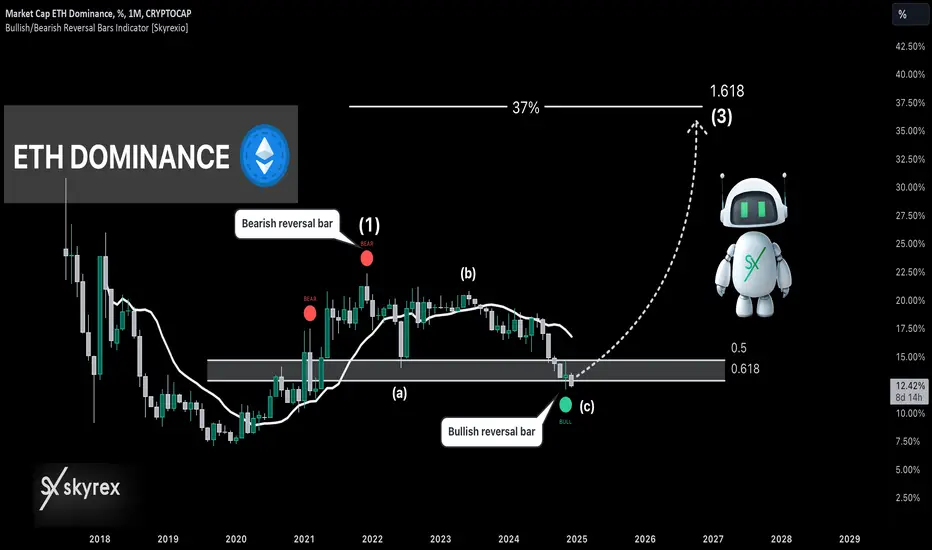
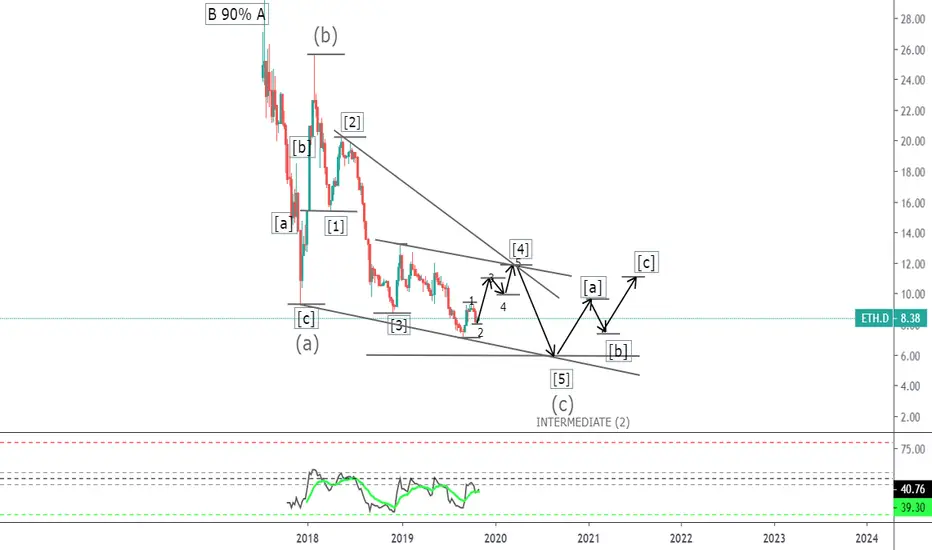
Let's take a look at the monthly time frame. Since the previous bull run ETH dominance is in large correction. Previous growth we can count as the wave 1 which has been finished with the red dot on Bullish/Bearish Reversal Bar Indicator . As always, alerts from this indicator are automatically replicated on my accounts. You can find the information in our article on TradingView .
After this wave we have seen the large wave 2 with the ABC shape. It could be already finished with the green dot in the target area inside Fibonacci 0.61. Now it's time for wave 3 which has the target at 37%.
Best regards,
Skyrexio Team
___________________________________________________________
Please, boost this article and subscribe our page if you like analysis!
Ethereum May Flip Bullish and Surprise UsEthereum dominance has a potential golden cross of its 50/200 day EMAs and MAs in progress as it tests the top of both along the neckline of a W pattern.
The question is how high it'll actually go. For Ethereum to become really bullish again vs. BTC, BINANCE:ETHBTC needs to reclaim the 7.2 year uptrend it lost back in March:

Pattern failure on ETHBTC!!! ***WARNING***Are we going to get a halvening before the Halvening.
Ethereum priced in Bitcoin is giving us the headsup that things are not right in #crypto world
After being so strong for so long
we have broken down through our stop loss for a Bullish #HVF
and now appear to be spilling towards legacy ratio's
if #Ethereum does go on a tumble
expect your #altcoins to lose twice as much value

BTC Dominance, what could be next?Touched that 48% level that was predicted, in order to retest previous resistance.
Personally hoping for a double top and BTC D consolidating between 54 48 levels until bullrun arrives. But I also see 54% and even 57% as a possible final level (black swan).
Alt bags are ready for bullrun. Could definitely wait more for lower levels but many alts are at an insane discount already, its too risky not to be buying.

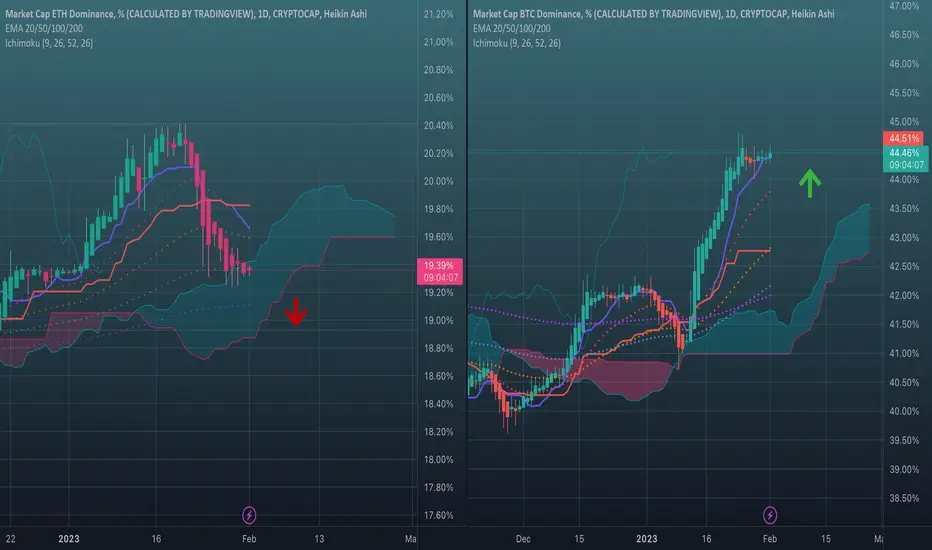
Two dominance.Doesn't look fun for the alt-season.
BTC D hovers above the indicator lines,
ETH D has them as resistance over itself.
ETH.D Is Heavily Supported Since the beginning of May a large support which could be considered a bullflag on a higher timeframe has been forming
This will likely hodl and break out to the upside
I'm excited to see how much ETH will increase in relation to BTC dominance wise

ETH.D, SOUNDS STILL BULLISH ...!
I expect a good bull run to the previous summit after breaking that dynamic resistance.
----------------------
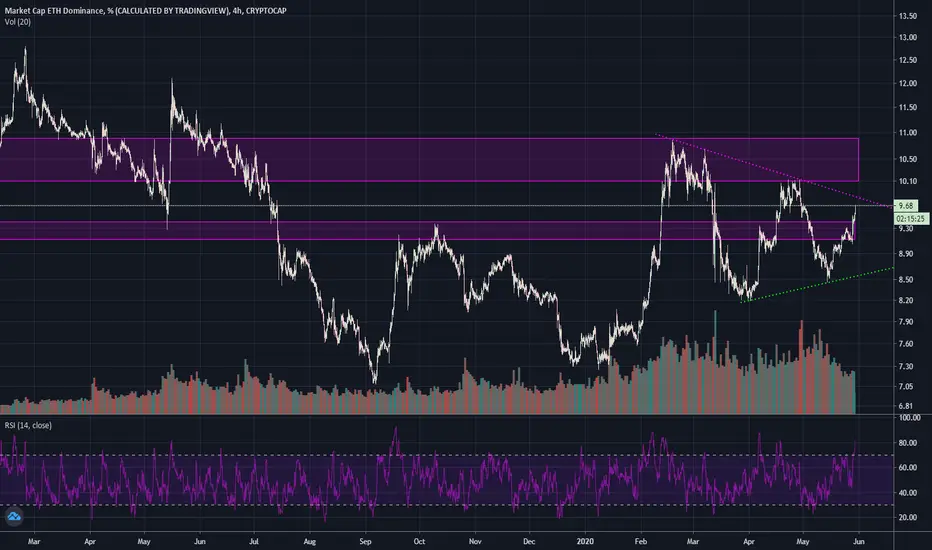
ETH Dominance Pivot Point0.618 can be seen as a pivot point, prior rejection at this level, even though a bounce was seen at the 50MA
Now price is at the 50MA and above this pivot point level, the dominance is likely going to bounce again (as seen previously) off the 50MA and push Ethereum's dominance higher.
This aligns with my current stance on ETHUSD

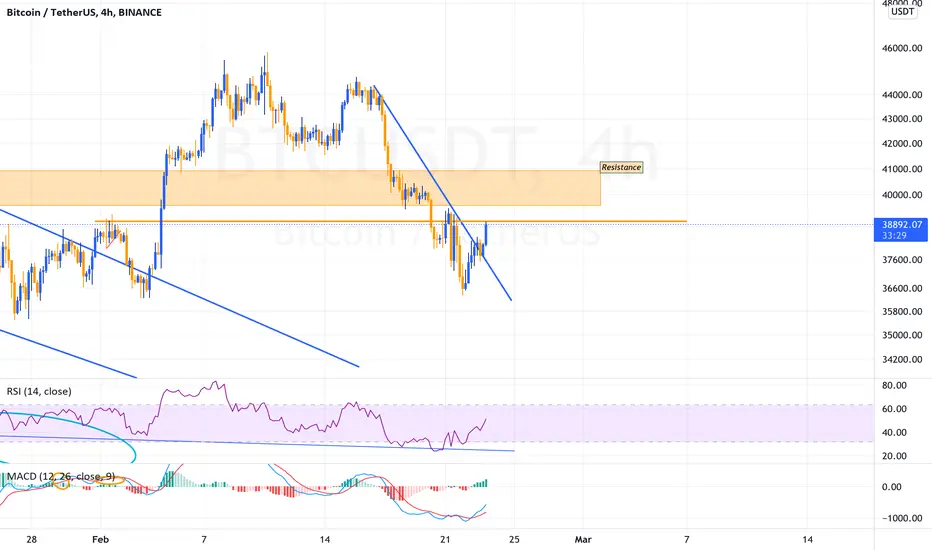
BTC UpdateBTC, crypto and global markets give a good bounce in the last 24 hours after Biden's conference last night, as well as no more negative news from the Russia/Ukraine crisis. Must watch the crisis very closes as any news will affect BTC price. FED interest rate is another factor that can create speculation in the market. On chart we can see BTC broke the downtrend resistance and is now at a new resistance line at $39k and has a bullish MACD. ETH.D is up, BTC.D is down and MCAP is up, this is good sign as it shows more money is flowing into alts.
Trade the range, trade safely.
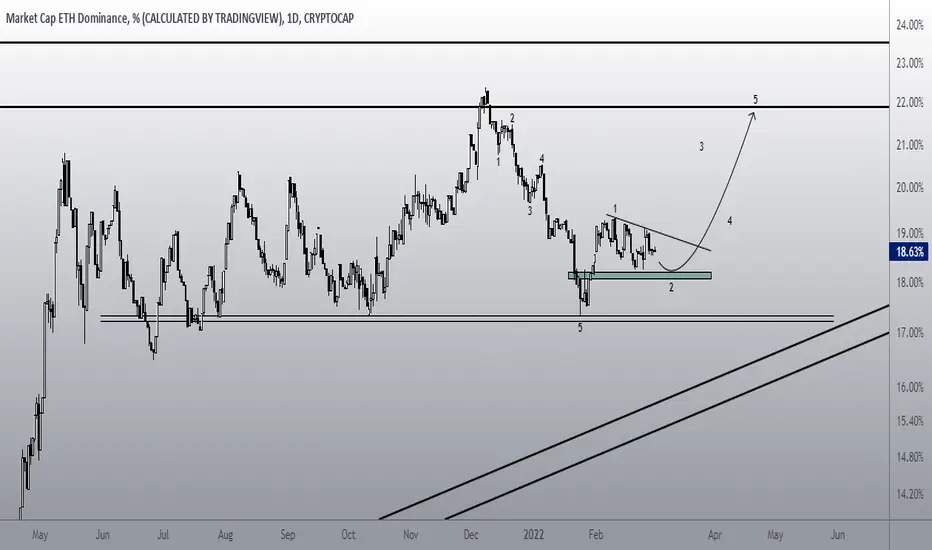
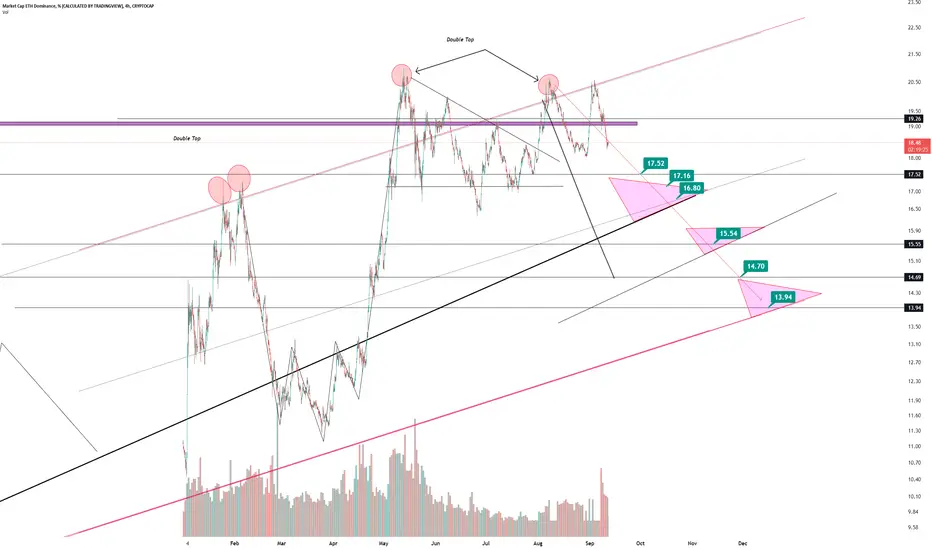
Ethereum Dominance ETH.D - Explosive move! + Ascending Triangle- The chart is printing a bullish consolidation pattern (rectangle, triangle).
- The Ethereum dominance should reach 27% in next weeks.
- Be sure to hold some ethereum as we are still very early!
- For expected duration of the trade, probability, stop loss, profit target, entry price and risk to reward ratio (RRR) - please check my signature below ↓
- If you want to see more of these ideas, hit "Like" & "Follow"!
- You really do not want to miss this opportunity!

eth dominanace 4h scaleAS we are seeing, very careful double top and reducing in momentum, can forward the index into the lower level which is showing in the chart by price ticket..... in 4 h scale downtrend is more obvious than the other prediction
Are Alts about to get a boost?We have few scenarios here, BTC is currently trading below its Support level as per Volume Profile, and same goes for ETH. BTC.D is also about to fall, indicating slight rise in either Dollar Index or OTHERS.D.
If the charts are right, and everything is following its Fibonacci range, we at ChainAssets.Capital are expecting BTC to fall even more and see a new Movement in Alts.
I wouldn't be too sure about major ALTS as they have already had their Fun, though it is highly possible that some of the major alts might be the reason for this further Push, I'd rather have my focus fixed on Shit Coins (Value less that $5).
For now, Looks like re entry in Alts is a favorable condition and we at chainassets.capital would recommend that you do not think much about investing in BTC and be prepared with Shorts on BTC.
NOTE: If BTC takes support from its current level, it will certainly be a good news for BTC holders and later comers, as we will again see some major movement in BTC and ETH.
If you have some positions in Market at Recent Highs, First suggestion would be of averaging out positions as much as possible. Secondly, if averaging out is not possible, then plan on holding your investments for a longer duration of time.
we at chainassets.capital wish you happy trading with this little insight. Feel free to comment your suggestions down below, and let's see if we can come on to a conclusion over market as a community!
Cheers!!!!

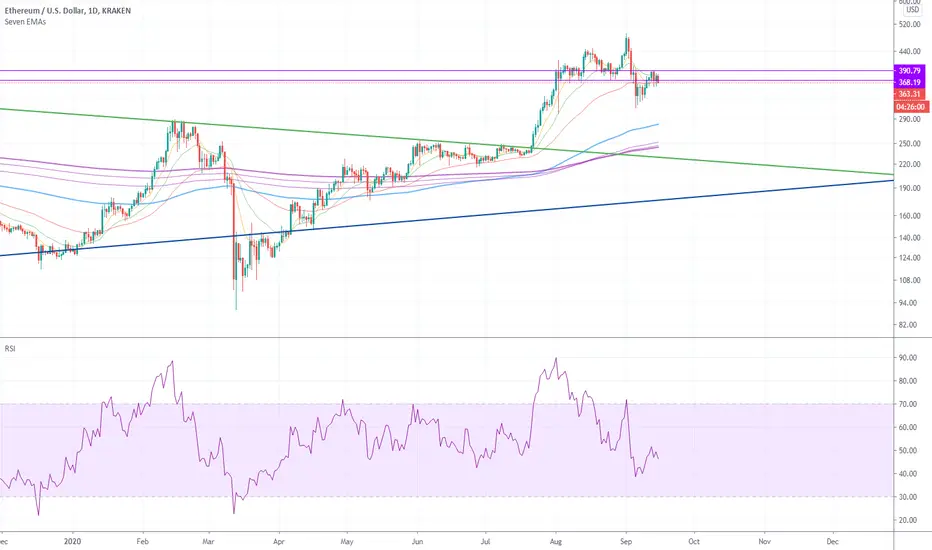
ETHUSD going to crash soonBroke horizontal resistance on the Weekly chart. Lost it again.
Hit horizontal resistance now again. Ready to move lower. Let's target somewhere around 220$.
Happy Trading!
ETH.D - Looks Inevitable LongEither now or on the pull back, one way or other.. Long. Caveat if BTC rips through major 10.5K resistance. Seems likely BTC either stays supressed or is just able to follow alts. Halving narrative over. Staking narrative has been taking over, and will probably continue.
ETH.D - Benchmark for AltsAside from BTC, looks like ETH is back as the benchmark for alts. Especially for "smart" chains. Daresay also for permissioned blockchains. Blockchains still infant. There is a lot of competition out there. Looking ]for those killer apps. Wild west. Show me the use cases !
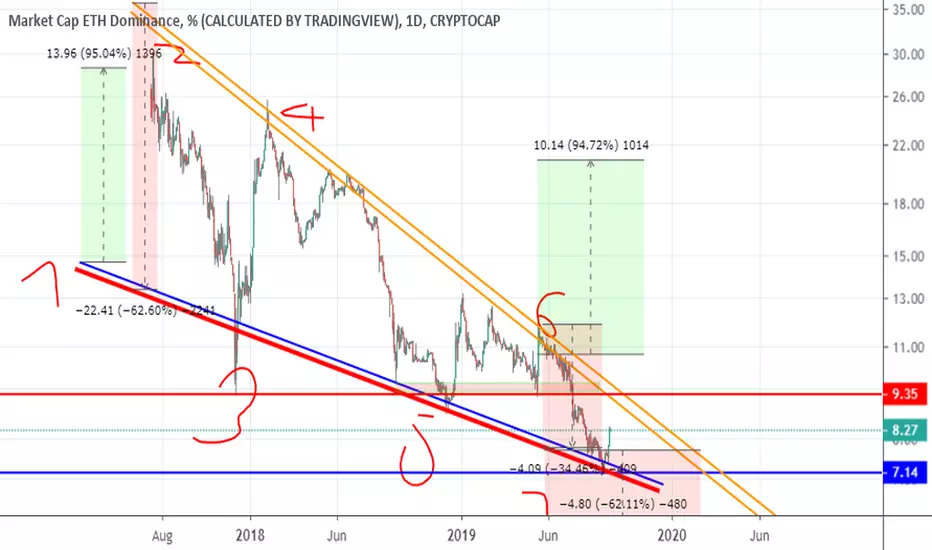
UPDATE: 05/11/2019: #ETHDominance traject 2019/2020?UPDATE: 05/11/2019: #ETHDominance (#EthereumDominance) traject 2019/2020?
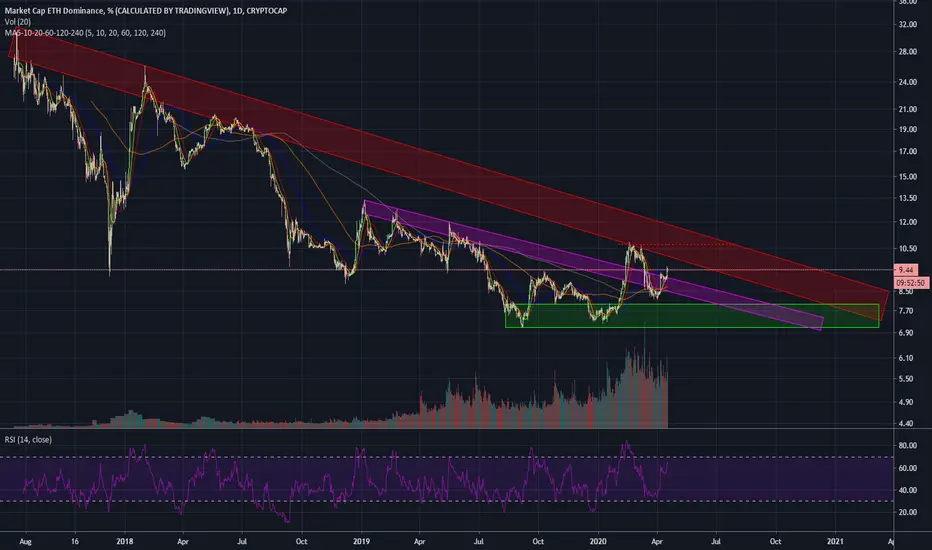
ETH Dominance Back on Track!That's the signal I was waiting for forever!
The falling wedge finally hit it's bottom, and I missed the proper entry because I was away :D
Anyway, if this wedge completes, we have a lot of room to regain Dominance on Ether. Don't miss the train!
Happy trading!