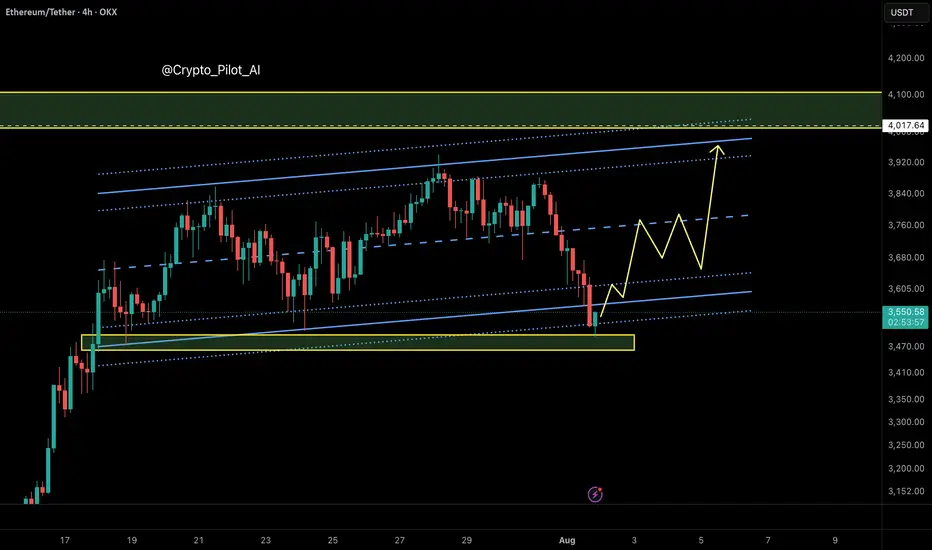
ETH BREAKOUT IMMINENT?Ethereum is currently trading around $3,726, holding just above key support levels, including the 50-day SMA and the psychological $3,700 zone. Despite a minor pullback, ETH continues to show signs of bullish strength and remains in a healthy uptrend.
Momentum indicators like RSI and volume show signs of recovery, and ETH is forming a bullish continuation pattern near resistance. If Ethereum can break above the $3,820–$3,850 zone, we are likely to see a quick push toward higher levels.
Ethereum is showing solid strength after consolidating above $3,700. The breakout attempt toward $3,850 will be critical. If bulls push through this level with volume confirmation, a move toward $3,900 and then $4000 becomes highly probable.
The market structure is constructive, and the presence of ETF-driven institutional demand adds further bullish pressure. While short-term volatility may create minor pullbacks, the medium-term setup favors upward continuation.
Ethereum (Cryptocurrency)
Ethereum - The moment of truth!🔬Ethereum ( CRYPTO:ETHUSD ) trades at a key breakout level:
🔎Analysis summary:
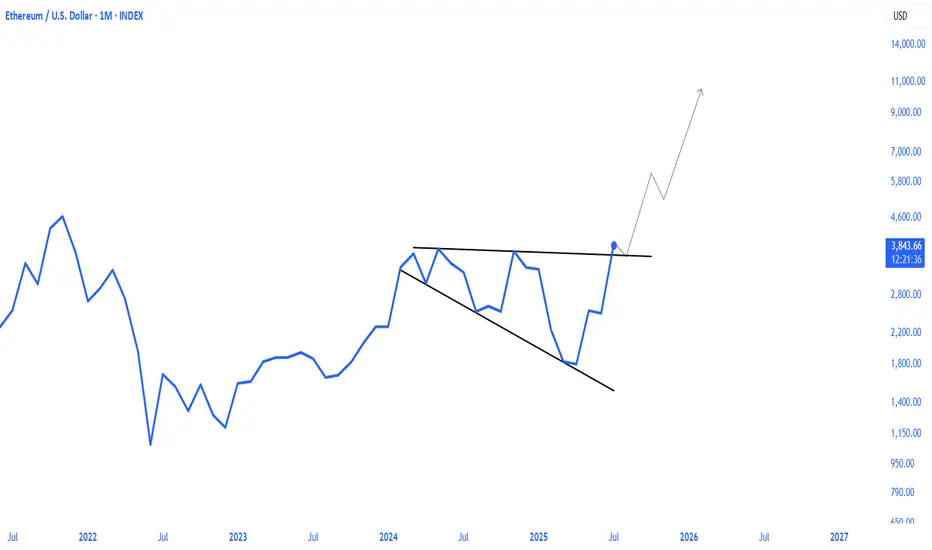
Ethereum - after consolidating for the past four years - is once again retesting the previous all time high. And before we will witness another bearish rejection, Ethereum has the chance to finally break out of the long term triangle pattern. It's time for us to start praying.
📝Levels to watch:
$4.000
SwingTraderPhil
SwingTrading.Simplified. | Investing.Simplified. | #LONGTERMVISION

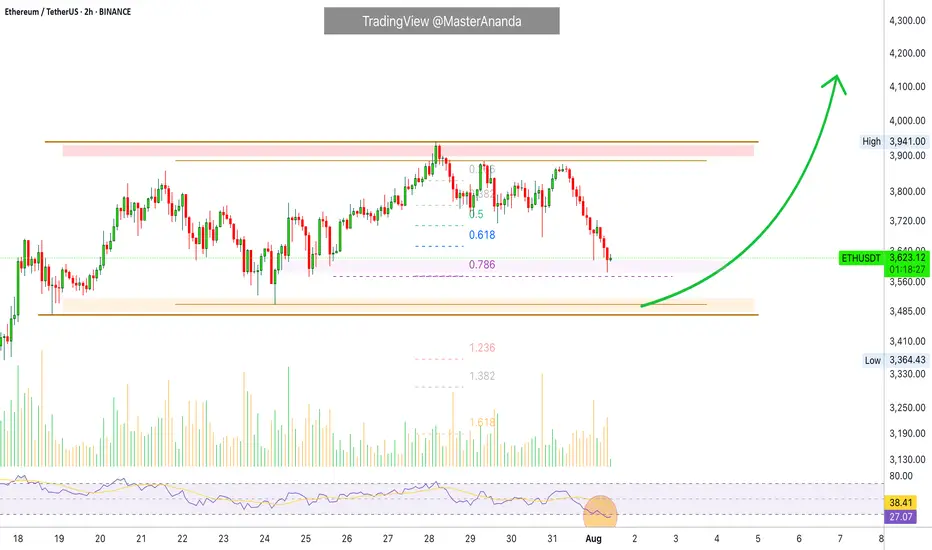
Ethereum Short-Term · Trading within Bullish RangeI am looking at Ethereum short-term using the same timeframe I used for Bitcoin, 2h. We have some interesting signals.
Here ETHUSDT is trading within higher lows. This is interesting because Bitcoin produced a lower low recently. The same volume signal is present here, ETHUSDT has been producing lower bearish volume since last month.
The RSI produced a lower low while ETHUSDT produced a higher low. This is called a hidden bullish divergence. Ethereum's bears did not only fail to take out the last low 24-July but also the previous one, and this clearly reveals bullish support.
The RSI being oversold is also a positive condition and can signal a reversal happening soon. Not truly a reversal because we are not in a downtrend, we are still witnessing a small pause after a strong rise; consolidation near resistance. A continuation reads better.
Ethereum's price continues really strong and the short-term signals are pointing to bullish action being favored in the coming days. We can wait easily and patiently because the best is yet to come. Never SHORT in a bull market, the market will surprise you with how fast things can turn. Better wait for support and go LONG.
Namaste.
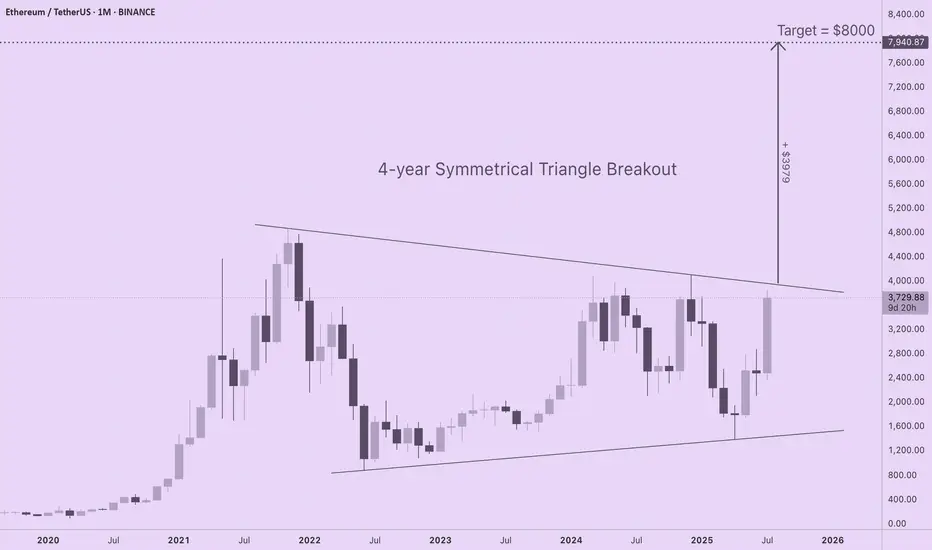
ETH Targets $8000 with 4-Year Symmetrical Triangle BreakoutIf you are seeking realistic ETH price targets based upon solid long-term market structure, check out this 4-year symmetrical triangle forming on the ETH/USD monthly chart. ETH is coiling for a major move to $8000, yet none of the CT "influencers" I follow are talking about this. I am new to technical analysis, so I am interested in learning your thoughts about this pattern and which tools or indicators you prefer for setting price discovery targets.
For those of you new to technical analysis, symmetrical triangle patterns can form on long timeframes (weeks, months, or years), indicating indecision between bulls and bears as price compresses within a continually narrowing range. A breakout from a symmetrical triangle typically follows the direction that preceded their formation, and the longer the consolidation period, the stronger the move.
The chart shows a strong euphoric phase in 2021 followed by a bear market low. Subsequent failure to reach previous ATHs is balanced by a pattern of higher lows. Since ETH was in an uptrend prior to triangle formation, odds are this is a continuation pattern, especially given profound shifts in capital flows and sentiment for the asset over the last several weeks.
With trendlines set at the price extremes, the height of the triangle is roughly $3980. If a breakout occurs at a price of $3960, ETH will target a price of $7940 (height of triangle + breakout price). A more conservative price target of $7000 is obtained by resetting the trendlines at the monthly opening and closing prices (omitting the wicks).
Regardless of the specific method for drawing the triangle, ETH is primed for a major move to the upside that has been four years in the making.
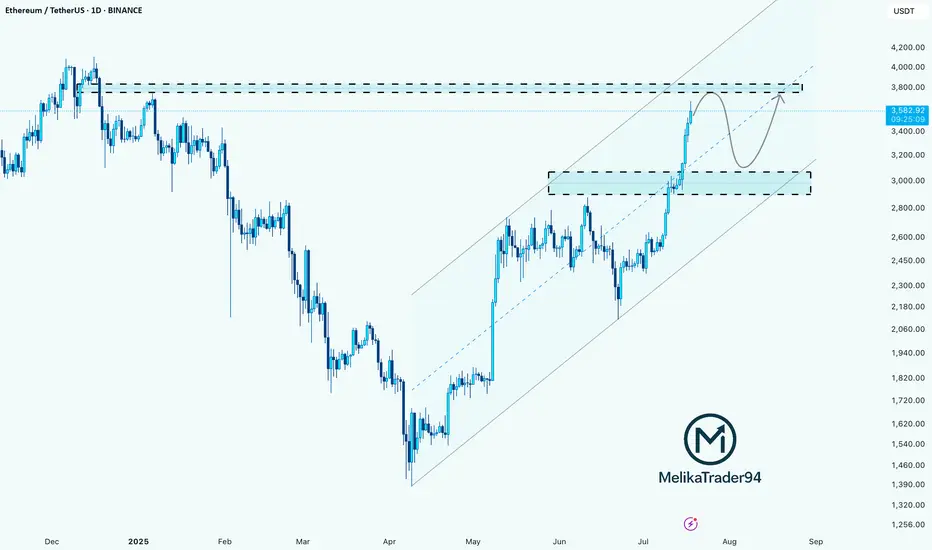
ETH Approaching Major Resistance – Expecting Pullback Hello guys!
Ethereum has been rallying strongly within a well-respected ascending channel, pushing past key levels and now approaching a major resistance zone around $3,900–$4,000.
According to the chart structure, it looks like price could soon react from this resistance, leading to a pullback into the $3,000–$3,200 demand zone, which aligns with the midline of the channel.
This would be a healthy correction before potentially continuing the bullish trend and attempting a clean breakout toward new highs.
ETH is still bullish, but it may need to retest support before continuation.
Watch for a bounce from the $3,000–$3,200 zone for a high-probability long opportunity.
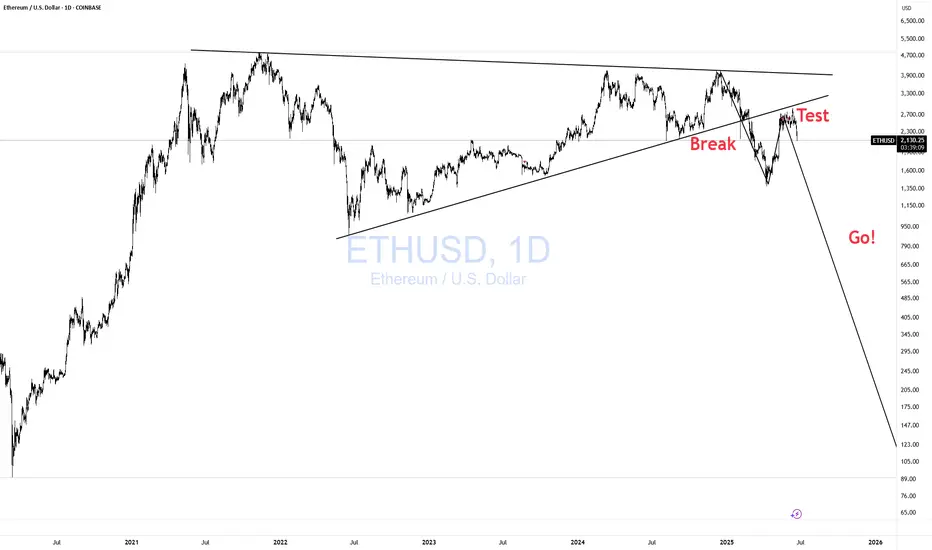
ETHUSD Break- Test- GO!!! Nothing Changed! 3rd EditionI have been warning about this for some time. Please visit my previous two posts for more info and updates.
Magic!
Click boost, follow, and subscribe for more. Let's get to 5,000 followers ))
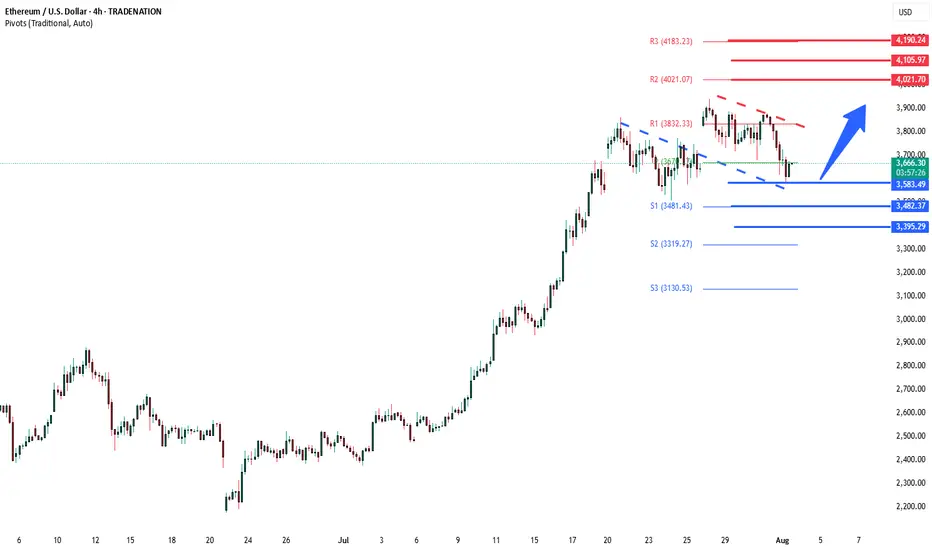
ETHUSD previous resistance new support The ETHSD remains in a bullish trend, with recent price action showing signs of a corrective pullback within the broader uptrend.
Support Zone: 3,667 – a key level from previous consolidation. Price is currently testing or approaching this level.
A bullish rebound from 3,667 would confirm ongoing upside momentum, with potential targets at:
4,020 – initial resistance
4,105 – psychological and structural level
4,190 – extended resistance on the longer-term chart
Bearish Scenario:
A confirmed break and daily close below 3,667 would weaken the bullish outlook and suggest deeper downside risk toward:
3,584 – minor support
3,482 – stronger support and potential demand zone
Outlook:
Bullish bias remains intact while the ETHUSD holds above 3,667. A sustained break below this level could shift momentum to the downside in the short term.
This communication is for informational purposes only and should not be viewed as any form of recommendation as to a particular course of action or as investment advice. It is not intended as an offer or solicitation for the purchase or sale of any financial instrument or as an official confirmation of any transaction. Opinions, estimates and assumptions expressed herein are made as of the date of this communication and are subject to change without notice. This communication has been prepared based upon information, including market prices, data and other information, believed to be reliable; however, Trade Nation does not warrant its completeness or accuracy. All market prices and market data contained in or attached to this communication are indicative and subject to change without notice.
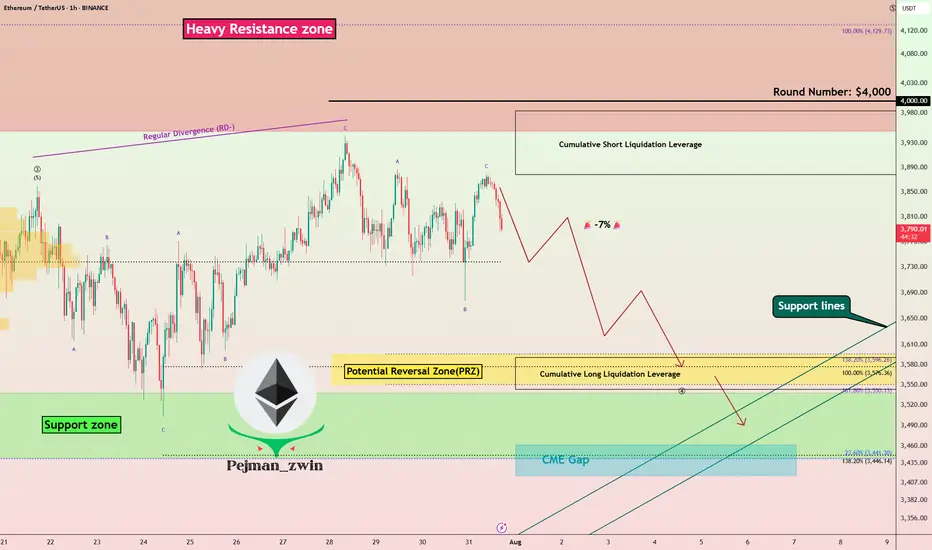
ETH at Critical Resistance + Liquidation Zone | Time to Short?Today I want to analyze Ethereum ( BINANCE:ETHUSDT ) on the 1-hour time frame . Is there a short position opportunity?
Please stay with me.
Ethereum is currently trading near a Heavy Resistance zone($4,390-$3,950) , Cumulative Short Liquidation Leverage($3,983-$3,878) and the $4,000 ( round number ). $4,000 could be a psychological number to sell .
In terms of Elliott Wave theory , Ethereum appears to have completed the main wave 3 at $3,860 and is currently completing the main wave 4 . The main wave 4 could have a Double Three Correction(WXY) or Expanding Flat(ABC/3-3-5) , with the Expanding Flat structure being more likely .
One of the reasons why shorting Ethereum could be better than shorting Bitcoin right now is that ETHBTC ( BINANCE:ETHBTC ) is currently trading above the ascending channel and is likely to correct to Fibonacci levels .
Also, we can see the Regular Divergence(RD-) between Consecutive Peaks.
I expect Ethereum to drop to at least the Potential Reversal Zone(PRZ) and attack the Support lines ( Second target ) .
Cumulative Long Liquidation Leverage: $3,591-$3,543
CME Gap: $3,461-$3,417
Note: Stop Loss: $4,023
Please respect each other's ideas and express them politely if you agree or disagree.
Ethereum Analyze (ETHUSDT), 1-hour time frame.
Be sure to follow the updated ideas.
Do not forget to put a Stop loss for your positions (For every position you want to open).
Please follow your strategy and updates; this is just my Idea, and I will gladly see your ideas in this post.
Please do not forget the ✅' like '✅ button 🙏😊 & Share it with your friends; thanks, and Trade safe.
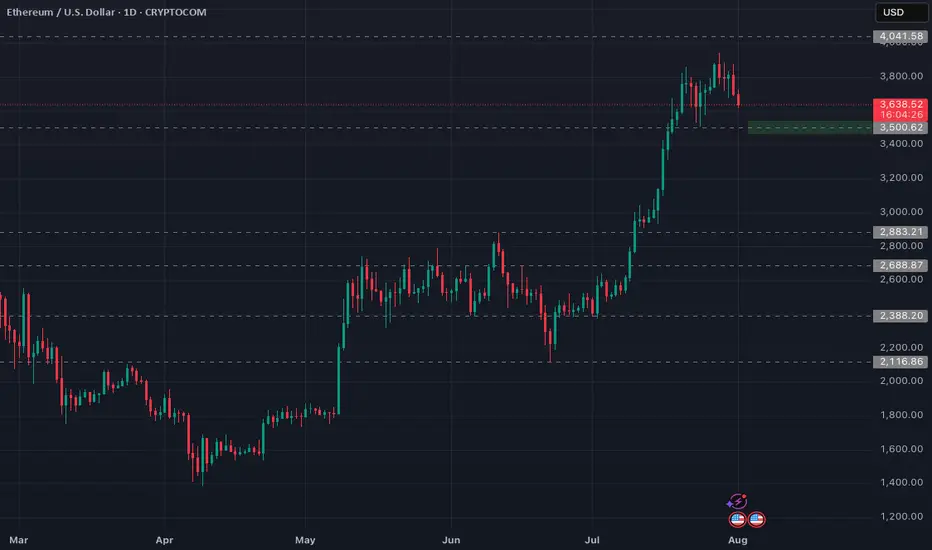
ETH/USDT | ETH Under Pressure – Watch $3500 Support!By analyzing the Ethereum chart on the weekly timeframe, we can see that after reaching the $3940 zone, ETH faced selling pressure and is now trading around $3540. If the price fails to hold the key $3500 support, a deeper decline is likely, with potential targets at $3040 first and possibly $2680 as the second bearish target.
Please support me with your likes and comments to motivate me to share more analysis with you and share your opinion about the possible trend of this chart with me !
Best Regards , Arman Shaban
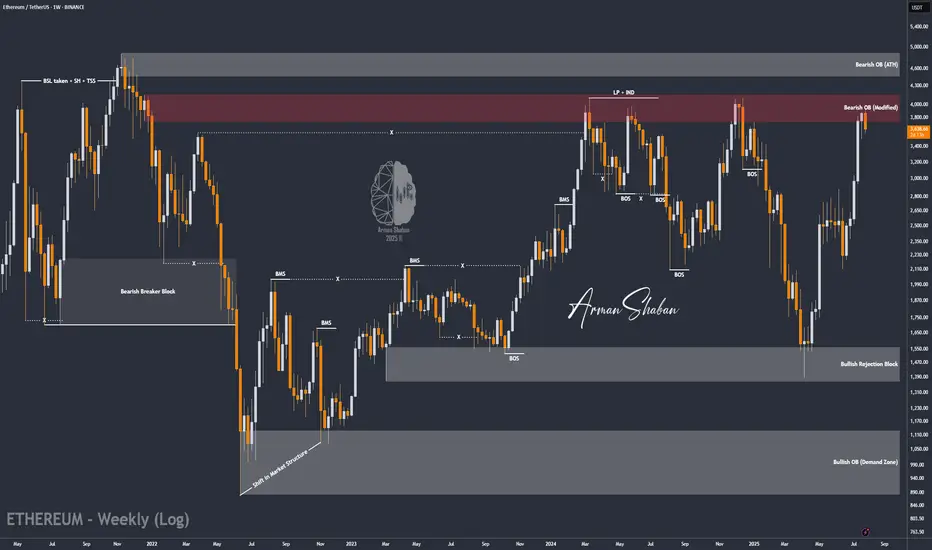
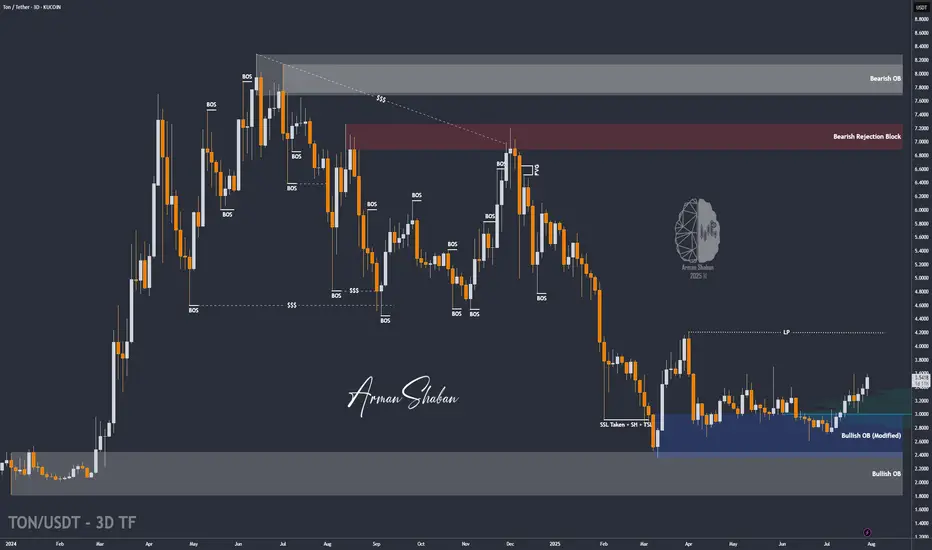
TON/USDT | Surges 18% – Eyes on $3.63, Then $4.20 and $4.68!By analyzing the Toncoin chart on the 3-day timeframe, we can see that after a pullback to the $3 area, strong demand kicked in, and within just one week, the price surged over 18%, reaching above $3.5. Toncoin is currently trading around $3.53, and I expect it to hit the $3.63 target soon. The next bullish targets after that are $4.20 and $4.68.
Please support me with your likes and comments to motivate me to share more analysis with you and share your opinion about the possible trend of this chart with me !
Best Regards , Arman Shaban
ETH accumulation season 3 has begun at 3.4k. Start loading up!!!ETH has seen impressive price growth for the past few weeks from our original spot at 2.4k -- and it run as high as 3.9k -- almost at our target of 4k.
Now, as with any parabolic moves, eth has to hibernate a bit for that well deserved recharge. This healthy correction at current levels is warranted. 23.6%, 38.2% FIB taps are usually ETHs favorite zone area. This is where most buyers converge as far the most bargain area to position. And we are now at that elusive zone.
A seed from this area is ideal. From our current diagram, you can see we are now on season no.3. This has been doin the same behavior since 160B mcap, and for this next phase, ETH is eyeing 600B mcap from here.
This is in line with our original forecast.
We are now on Month no. 3 as we entered August, my predicted cycle duration would be 17 bullish months till December 2026.
-----------
STONG BUY HOLD at this area. We got a rare elusive season of accumulation that doesnt come very often.
Happy profiting everyone
See you up there.
Spotted at 3.4k
Mid target 5k.
Long term target. 10k.
TAYOR.
Trade safely.
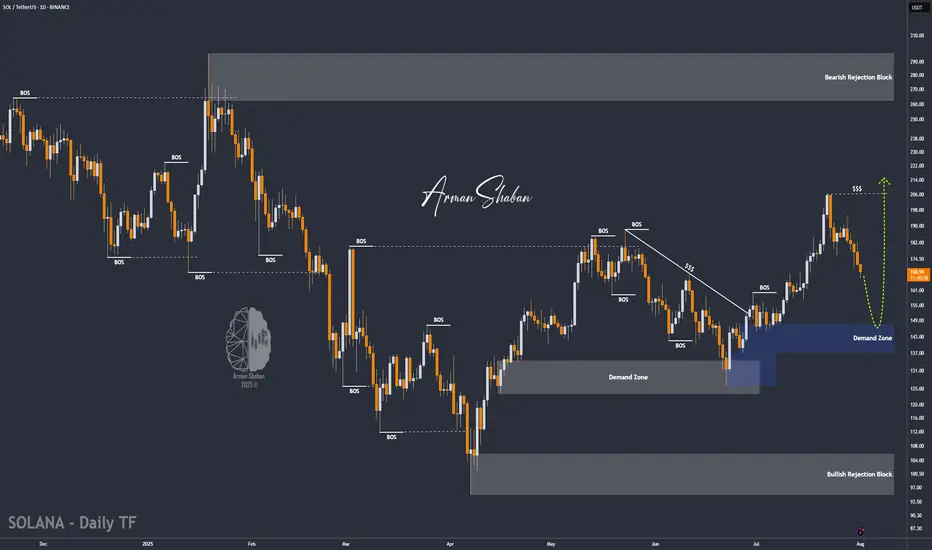
SOL/USDT | NFP Volatility Could Trigger Drop Toward $154!By analyzing the Solana chart on the daily timeframe, we can see that the price is currently trading around $169. If it fails to hold above the $168 level, a deeper drop could follow. With the upcoming NFP data release, increased volatility is expected across the markets. If Solana begins to decline, the potential correction targets are $163, $157, and $154. Watch the $145–$154 zone closely for a possible bullish reaction and buy opportunity.
Please support me with your likes and comments to motivate me to share more analysis with you and share your opinion about the possible trend of this chart with me !
Best Regards , Arman Shaban
Ethereum: Smart Money Reversal After Stop Hunt?In the previous update, we warned that Ethereum might drop lower before any meaningful bounce — especially if it failed to hold the midline of the ascending channel. That scenario played out exactly as anticipated.
🟡 Price action summary:
ETH broke below the midline of the weak ascending channel, hunted the liquidity below recent lows, and tapped into the key bullish order block near $3,490 – $3,520. Price is now reacting to this zone with early signs of a reversal.
📌 Key observation:
Midlines of weak or low-momentum channels often act as liquidity traps in smart money models. Buying at these levels can be extremely risky — especially during corrective or distribution phases.
⸻
📚 Educational Note:
Never enter long positions solely at the midline of a weak ascending channel, especially when there’s a high probability of liquidity sweep below. Smart entries usually occur at order blocks formed after stop hunts.
⸻
🎯 Next steps:
Wait for confirmation (such as internal BOS or FVG closure) before entering longs. The structure suggests a potential move back toward the upper boundary of the channel if this OB holds.
⸻
🔗 Save this analysis and share it with fellow traders.
💬 Thoughts? Drop your view in the comments.
Ethereum (ETH/USD) Analysis - Aug 01, 2025ETH is showing a strong uptrend on the 1D chart, recently hitting $3,639.37 after a -1.59% dip. A key support zone around $3,500 is in sight, which I’m eyeing as a potential buy opportunity. The chart suggests a solid base here, with historical price action holding firm.
Watch for a bounce or consolidation around $3,500-$3,600 before the next leg up.
Target: $4,000+ if momentum holds.
Risk: A break below $3,300 could invalidate this setup.
ETHUSDT.PIf you look at the chart, you will notice an uptrend that has somewhat lost its strength and we may not be able to hit higher highs like the next strength in the next move.
Support: 3.660 - 3.590 - 3.160
Resistance: 3.900 - 4.260
Entry: 3.700
SL: 3.500
TP: 4.240
Please control risk management.⚠️

The key point to watch is whether it can rise to 3900.73-4107.80
Hello, traders. Nice to meet you.
If you "Follow," you'll always get the latest information quickly.
Have a great day.
-------------------------------------
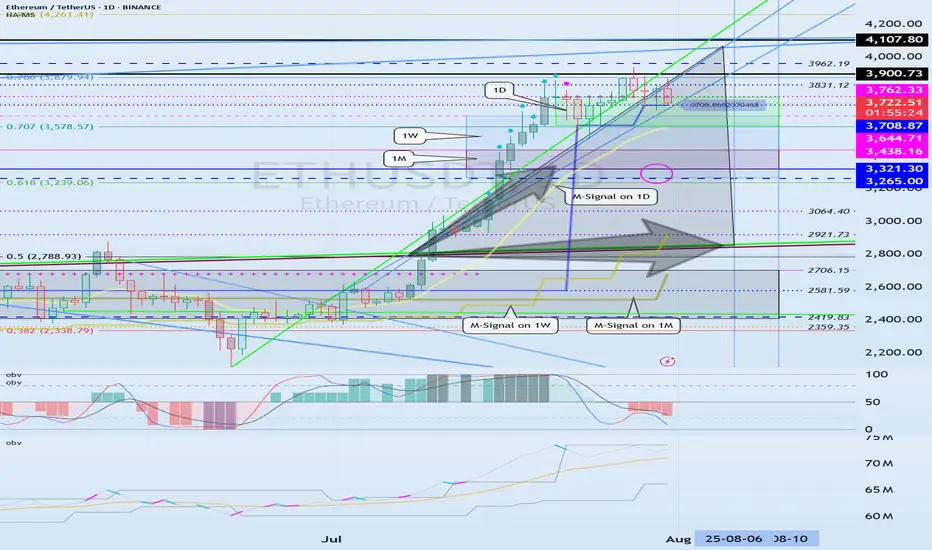
(ETHUSDT 1D Chart)
The upward trend continues, with the M-Signal on the 1D chart > M-Signal on the 1W chart > M-Signal on the 1M chart.
Therefore, if the price holds above 3265.0-3321.30, a medium- to long-term uptrend is likely.
Currently, the HA-High ~ DOM(60) range is formed across the 3265.0-3762.33 range on the 1M, 1W, and 1D charts.
Therefore, the key question is whether support is found within the 3265.0-3762.33 range.
-
While the price is trending upward along the short-term trendline, if it falls below the short-term trendline and encounters resistance by falling below the M-Signal indicator on the 1D chart, a decline to the 3265.0-3321.30 range is likely.
ETH's volatility period is expected to last from August 6th to 10th.
The key point to watch is whether it can rise above the 3900.73-4107.80 range after this volatility period.
-
Since the StochRSI indicator has entered an oversold zone, the downside is likely to be limited.
Since the OBV indicator of the Low Line ~ High Line channel remains OBV > OBVEMA, a significant decline is unlikely.
However, since the TC (Trend Check) indicator is below zero, selling pressure is dominant.
Therefore, a decline below 3708.87 could lead to further declines. However, as previously mentioned, the decline is likely to be limited, so a significant decline is not expected.
Once the M-Signal indicator on the 1D chart is encountered, the trend is expected to re-establish itself.
-
Thank you for reading to the end.
I wish you successful trading.
--------------------------------------------------
- This is an explanation of the big picture.
(3-year bull market, 1-year bear market pattern)
I will explain in more detail when the bear market begins.
------------------------------------------------------
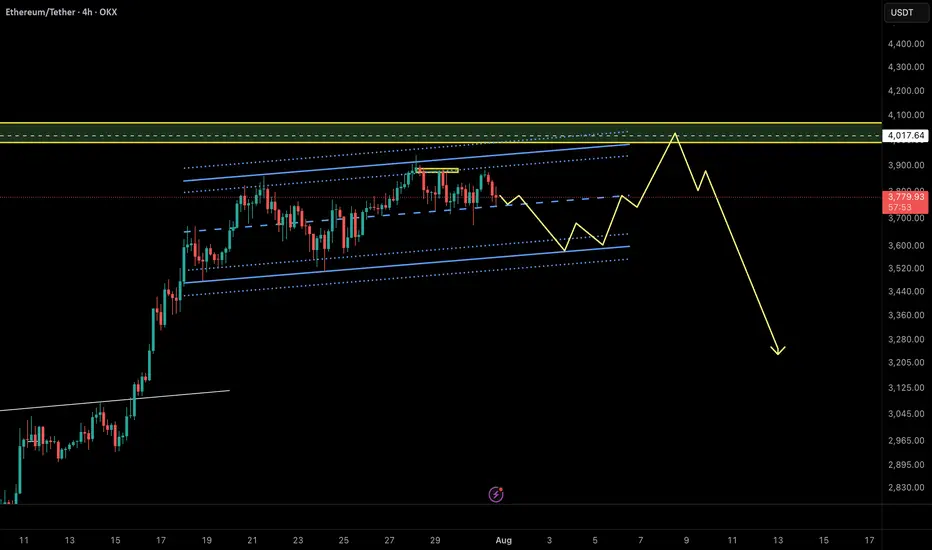
Ethereum Quick Outlook – Potential Trap Before Drop?ETH is moving within a rising channel, but momentum is fading. Price failed to break above the midline and is now testing lower support.
A fakeout to the upside toward the $4,015–$4,050 supply zone is possible before a deeper drop. The projected path suggests a short-term bounce, final liquidity sweep, then potential reversal.
🟡 Key Resistance: $4,015
🔻 Breakdown trigger: Below $3,620
🎯 Bearish Targets: $3,250 → $3,100
Structure hints at a possible Ending Diagonal (Neowave), or a Trap-Wave E inside a Complex Correction.
⚠️ Watch for manipulation near highs – confirmation needed for short entry.
The next levels for Solana coinIn this video I recap the previous video and discuss what may be next after the current retracement .
I reveal some important levels that sit below as well as the relationship with the Eth/Btc chart.
Tools used vwap, Fibs and volume profile .

ETHUSD BROKE THE LOWER BORDER OF THE WEDGE. PRICE IS MOVING TOWAETHUSD BROKE THE LOWER BORDER OF THE WEDGE. PRICE IS MOVING TOWARDS THE LOCAL SUPPORT.
Yesterday, Ethereum saw its largest monthly increase since July 2022, thanks to strong inflows into exchange-traded funds and increased activity in the Ethereum treasury. US exchanges are working to obtain regulatory approval for a standardized framework for listing crypto funds. Coinbase and JPMorgan have joined forces to provide Chase customers with access to crypto products.
Despite these positive developments, the short-term outlook does not indicate a bullish setup. It appears that all the information has already been factored into the price. The pair moves towards the local support of 3,500.00. However, in the long term, these developments are favorable for investment.

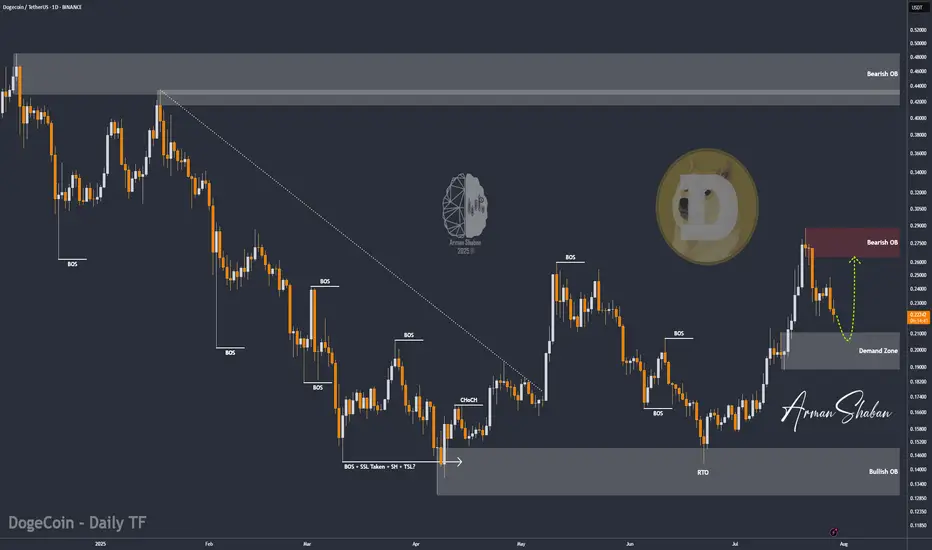
DOGE/USDT | Eyes Bounce from Key Support – Next Targets Ahead!By analyzing the Dogecoin chart on the daily timeframe, we can see that after reaching the $0.29 area, the price entered a correction and is now trading around $0.22. If DOGE dips into the key support zone between $0.19–$0.21, we could expect a strong bullish reaction. The next potential targets are $0.287, $0.32, $0.41, and $0.70.
Please support me with your likes and comments to motivate me to share more analysis with you and share your opinion about the possible trend of this chart with me !
Best Regards , Arman Shaban
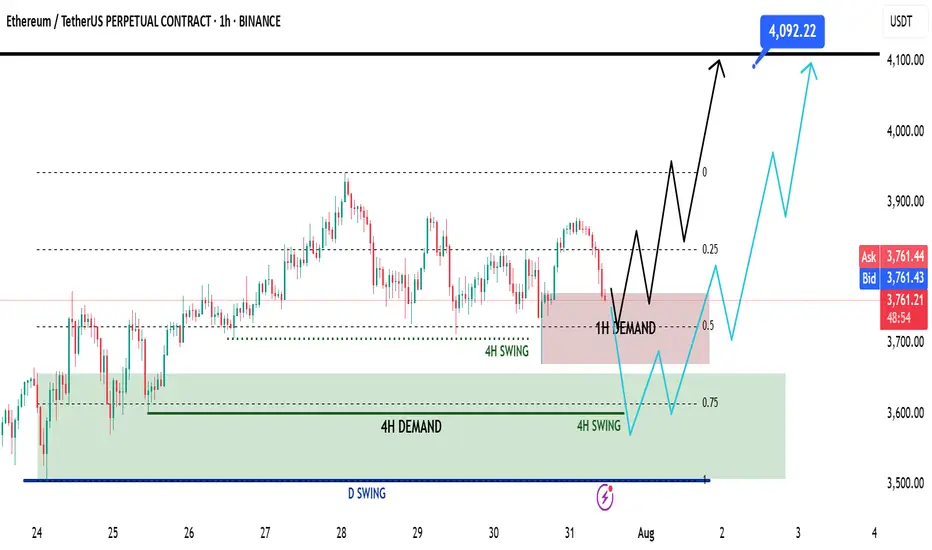
Ethereum Mid Week Update - Swing Long Idea📈 Market Context:
ETH remains in a healthy bullish structure. Despite the recent retracement, price action is still supported by strong demand zones on higher timeframes. No change in the overall sentiment from earlier this week.
🧾 Weekly Recap:
• Price rejected from the Fibonacci 0.5 EQ level — a discounted zone in my model.
• While doing so, it also ran 4H swing liquidity.
• After taking liquidity, ETH formed a 1H demand zone — a sign to look for lower timeframe confirmations for long setups.
📌 Technical Outlook:
→ Price has already tapped into the 1H demand zone.
→ From here, we have two possible scenarios:
Black scenario (ideal):
• Wait for 15M bullish break of structure (BOS).
• Enter after confirmation for long setups from 1H demand.
Blue scenario (deeper retrace):
• If no bounce from 1H demand, expect price to dip toward 0.75 Fib level (max discount).
• Watch for another liquidity run & 1H–4H demand formation.
🎯 Setup Trigger:
✅ 15M bullish BOS inside 1H or 4H demand zones
→ This would be the entry confirmation trigger for longs.
📋 Trade Management:
• Stoploss: Below the swing low of the 15M BOS
• Target: 4090$
💬 Like, follow, and drop a comment if this outlook helped — and stay tuned for more setups each week!
Crypto market review: Bitcoin, ETH, and Altcoins Setting Up for Prepared a new in-depth crypto market video update covering BTC, Ethereum, and key altcoins. Here’s a quick summary of the current landscape and what I’m tracking in the charts:
We’ll begin with Bitcoin. After the Fed’s decision, BTC showed a constructive shakeout and has been consolidating tightly around the same range for three weeks. I previously anticipated resistance near the 1.23 area and expected a sideways phase within the 1.15–1.13 support zone. That’s exactly what we’re seeing—shakeouts and quick recoveries. As long as we stay above 1.13 structurally, and especially above yesterday’s highs short-term, I expect BTC to push higher toward the 1.26–1.30 resistance zone.
Institutional buying during the post-Fed dip has been significant. Volume on Coinbase and Binance indicates strong participation, and Bitcoin treasuries have been accumulating. This bolsters confidence in the underlying trend structure.
I wrote in mid-July about BTC’s broader macro structure—this resistance region may trigger a prolonged consolidation, but ideally without breaking June lows. Short-term bias remains bullish.
Ethereum remains the strongest large-cap altcoin. It has respected the 8EMA on pullbacks and shows strength to target 4300–5100 in the coming weeks. It continues to lead risk-on sentiment.
XRP has been deep in consolidation, but we may be seeing a higher low forming. Any rally in BTC and ETH could lift XRP toward 3.30–4.60 levels, possibly even 5.00.
Solana showed strong action through late July, pulling back into mid-term support. As long as this structure holds, I expect upside toward 220–230 and potentially reclaiming ATH zones.
Hyperliquid has been a laggard but held its key macro support. If yesterday marked a bottom, I’ll be watching for higher lows and a move toward 55–60.
Other notable setups:
Brett: Both showing impulsive structures from April lows. Brett in particular looks poised for 74–77, potentially retesting May highs around 95.
ONDO: Recovering key zones and shaping a potential bottoming pattern.
SUI: Leading structure from July lows. After a likely wave-one completion, it could extend toward 5.15–7.70 before topping.
RENDER: Looks to have finished its correction. Potential long-term upside beyond May highs; the macro uptrend might already be underway.
SUPER: Since July breakout, forming a strong trend structure. If it holds the higher low, could reach 1.20–1.46 in coming weeks.
TON: Slow mover, but the macro pattern suggests a bottom with potential toward 4.60 short-term.
LINK: Hasn’t finished its move. Watching for 21–22 as a next target.
FET / Fetch.AI: Macro structure looks great. Watching for recovery from June lows with potential for strong continuation if structure holds.
Trump Coin: In a diagonal pattern post-failed impulsive breakout. If higher lows hold, watch for rally toward 13–14.
LTC: Linear and clean structure. Looks ready to push toward 130–145 before potential base-building.
UNI: Targeting 14–18+ in wave continuation if structure holds.
Let me know in the comments if there’s a specific coin you’d like me to go over. I’ll include it in future updates or make a quick standalone video.
Thanks for watching, and I wish you a successful trading week ahead. Let’s see how far this rally can go through the rest of the summer!

ethereum breakout bullish megaphone pattern ETHEREUM broke the bulish megaphone pattern in the 1M timeframe. it will continue to rise after the retest phase that will occur with the monthly closing today.