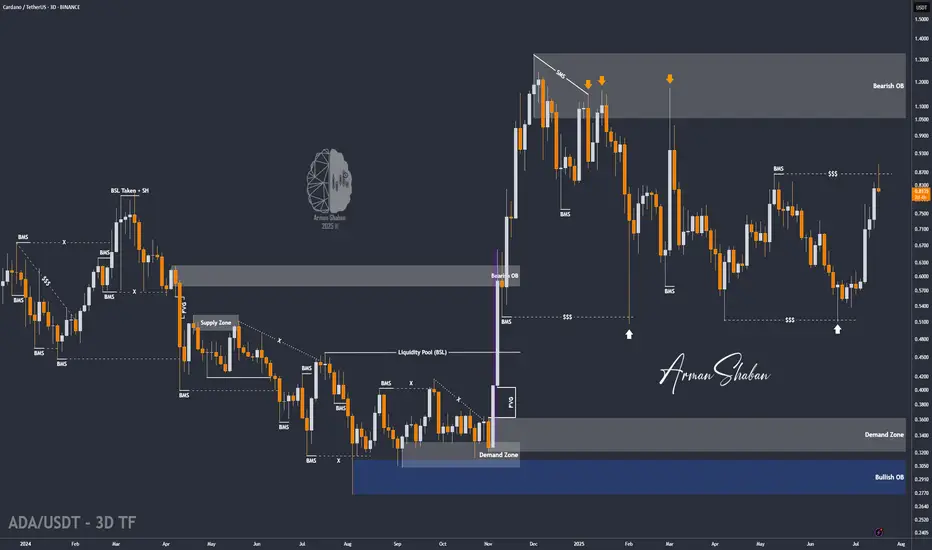
ADA/USDT | BIG Bullish Move Ahead! (READ THE CAPTION)By analyzing the Cardano chart on the 3-day timeframe, we can see that, as expected, the price continued its rally, reaching $0.89 before collecting liquidity above the $0.86 level and then facing a correction. Currently trading around $0.81, we expect the bullish trend to continue after this minor pullback. Key demand zones are at $0.78, $0.69, and $0.61. Based on the previous analysis, the next short- to mid-term bullish targets are $0.93, $1.05, and $1.33.
Please support me with your likes and comments to motivate me to share more analysis with you and share your opinion about the possible trend of this chart with me !
Best Regards , Arman Shaban
Ethereum (Cryptocurrency)
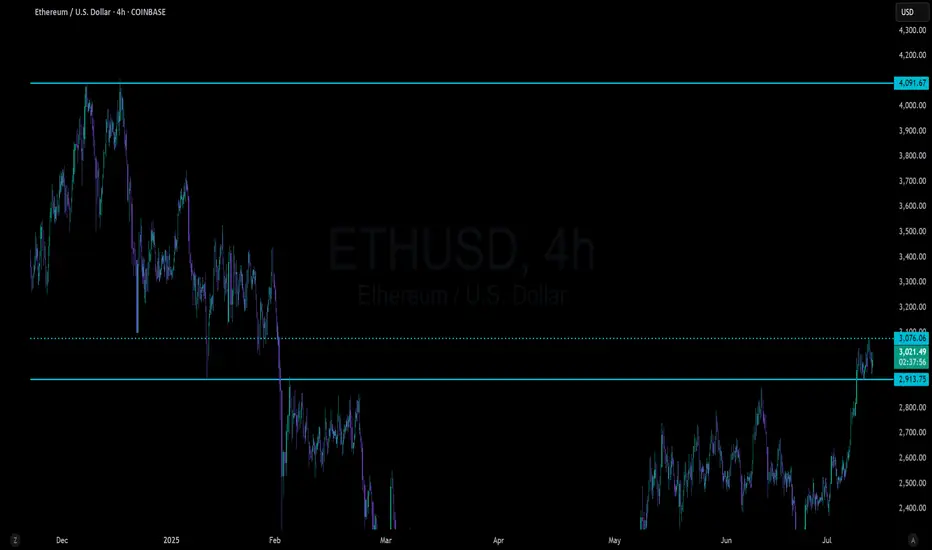
ETH Charging Familiar Resistance
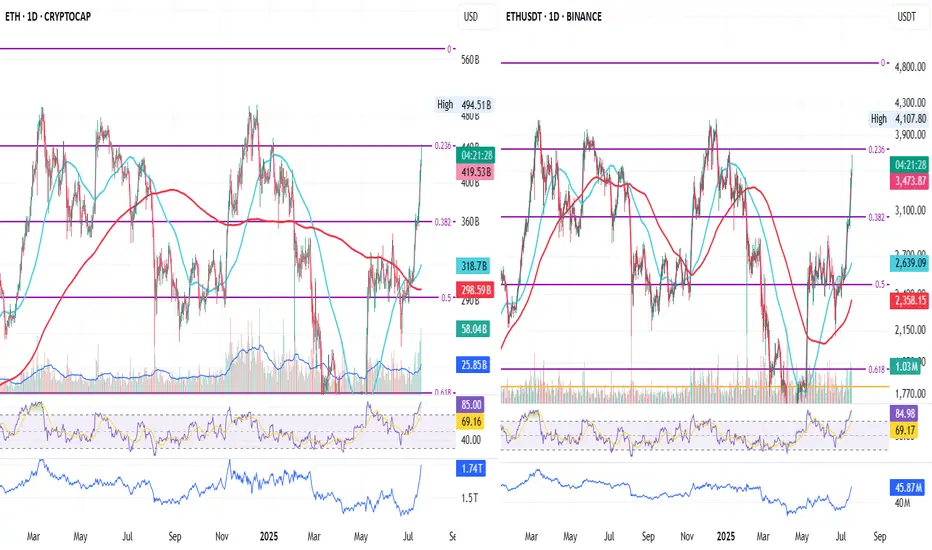
We’re looking at ETH Cryptocap (left) and ETHUSDT (right), both on the daily timeframe.
ETH Cryptocap has just touched the 0.236 Fib level, and ETHUSDT is only a few dollars away from it.
Since March 2024, this level has consistently acted as resistance — each time price crossed it, it eventually retraced after hovering briefly above.
Will this time be different?
What’s clearly different now is volume : it’s rising along with price.
In the past 10 days, there’s only been one red volume candle, and even that was minor.
Meanwhile, RSI is firmly in the overbought zone.
I don’t know if ETH will go higher or start retracing, but I can prepare for both.
The simple solution: place a trailing take-profit order and let price move.
If it pulls back, I’ll lock in some gains.
If it keeps climbing, I’ll stay with the trend.
For me, everything else is just unnecessary complication.
Always take profits and manage risk.
Interaction is welcome.
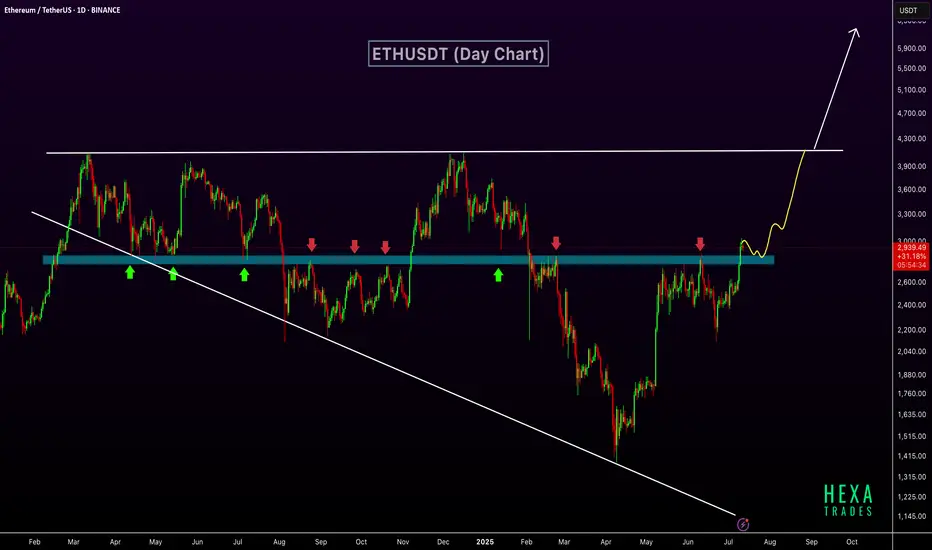
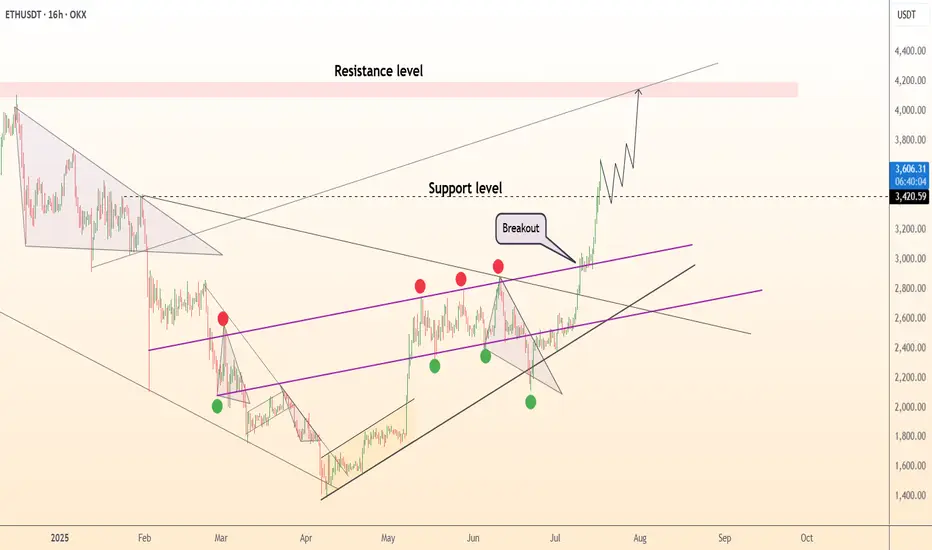
ETH Breaks Key Resistance – $6K Possible if Wedge BreaksETHUSDT has broken out above a key horizontal resistance zone that has historically acted as a strong support and resistance level. This zone, marked in blue, has seen multiple rejections and bounces over the past year, confirming its significance.
The recent breakout above this zone indicates a shift in market structure and suggests growing bullish momentum. The price action shows a clean move above resistance, with potential for a retest before continuing higher. The market is also forming a long-term broadening wedge pattern. The next target lies near the upper resistance of the wedge, around $4,000. If the price breaks above this broadening wedge, it could open the path toward the $6,000 level.
Regards
Hexa
ETH 3rd Attempt at Resistance — Breakout or Bull Trap?Ethereum is back at a major level that’s rejected it twice already. A breakout here could finally end the range and send price into discovery — but if history repeats, this might be the ultimate fakeout before a sharp reversal. All eyes on the next few candles.

*ETH 4H — Charging the 0.236 @3700$ETH on the 4H is getting ready to charge the 0.236 Fib level.
MLR > SMA > BB Center — momentum is aligned.
Volume confirms the move.
Even though I don't enjoy it — and last time I sold just a part of the position too soon —
I placed a partial TP again. It needs to be done. The market can always turn.
We’ll be here to see it unfold.
Always take profits and manage risk.
Interaction is welcome.

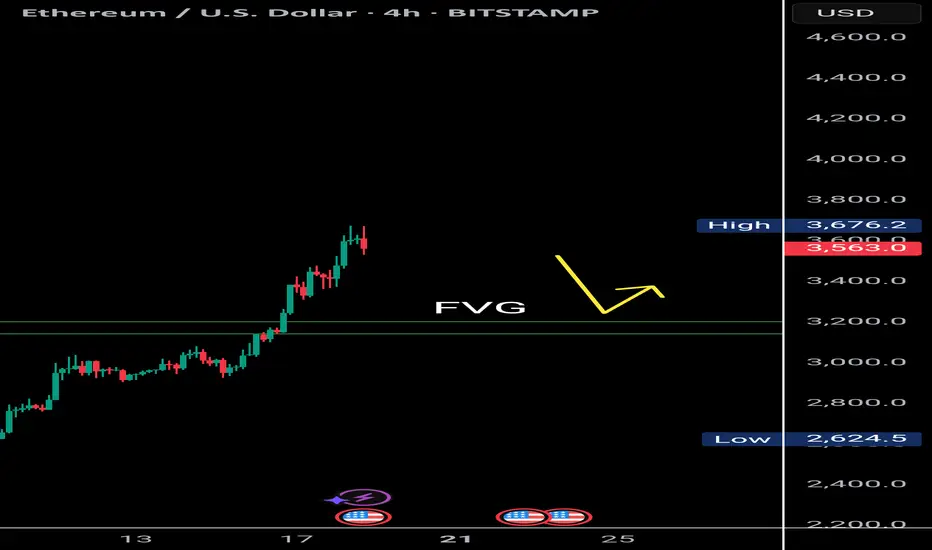
$Eth Faces Double Top Resistance with Bearish RSI DivergenceETH/USDT | 4H Analysis
Ethereum is currently showing signs of weakness on the 4H chart, forming a potential double top pattern around the $3,700-$3,680 range.
Adding to this, the RSI is exhibiting bearish divergence, suggesting that bullish momentum is fading. There's a visible liquidity gap between $3,200–$3,180, which might act as a magnet in the short term. A retest of this zone is likely before ETH attempts to resume its upward move.
Key Observations:
🟠 Double top structure on 4H chart
🔻 Bearish RSI divergence
🕳️ Favorable gap: $3,200 – $3,180
🔁 Watch for price reaction after retest
⚠️ If ETH holds the $3,180 support after filling the gap, a bullish bounce toward higher levels could follow.
📌 This idea is for educational purposes. Trade wisely with proper risk management.
$ETH Ethereum Market Outlook – July 2025Ethereum Market Outlook – July 2025
Brought to you by ProfessorXtrader
🚀 Ethereum Breakout Confirms Multi-Year Bullish Setup
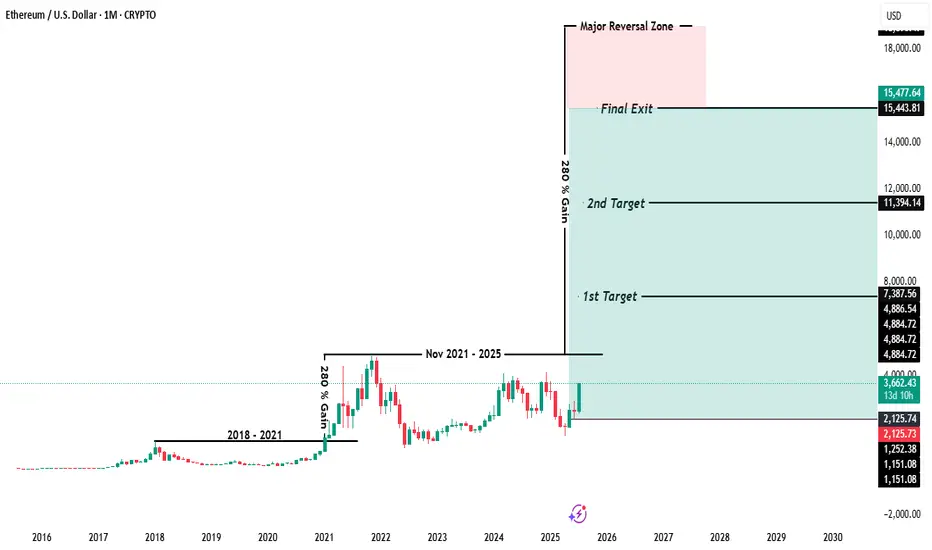
Ethereum ( CRYPTOCAP:ETH ) has officially broken out of a multi-year consolidation range, signaling a strong bullish cycle ahead. With the current price sitting at $3,645.50, ETH has posted a remarkable 46.65% monthly gain as of July 18, 2025.
This move sets the stage for a multi-tiered upside potential — here’s what the chart is telling us.
📊 Key Levels & Targets
🔸 Previous Consolidation Range (2018–2021)
ETH spent over three years capped under the ~$4,884 level, forming a solid accumulation base.
🔸 Breakout Zone
Support: $1,150 – $1,250
Confirmation of Cycle Shift: Price now trading well above breakout zone.
🎯 Upside Targets (Ethereum)
1st Target:
📍 Price: $7,387.56
📈 Potential Gain: ~100%+ from breakout zone
2nd Target:
📍 Price: $11,394.14
📈 Potential Gain: ~180%
Final Exit (Major Reversal Zone):
📍 Price Range: $15,443.81 – $15,477.64
🚨 Total Gain Potential: ~280% from breakout
📌 The area between $15.4K to $18K is marked as the Major Reversal Zone, a region where profit-taking and trend exhaustion are highly likely.
📈 Market Interpretation
Bullish Breakout: Long-term resistance is now support.
Volume & Momentum: Strong monthly candle with expanding volatility confirms conviction.
Structure: Targets are based on clean technical projections, Fibonacci expansions, and market psychology.
🔔 What to Watch Next
📅 Monthly Close above current levels will confirm the breakout.
🔍 Monitor for rejection signals near the first target.
📉 Place trailing stops as we approach the major reversal zone.
💡 Pro Tip from ProfessorXtrader
"The biggest profits in crypto are made during clean breakouts from multi-year ranges. ETH is entering that phase now — plan your targets and protect your capital as you climb."
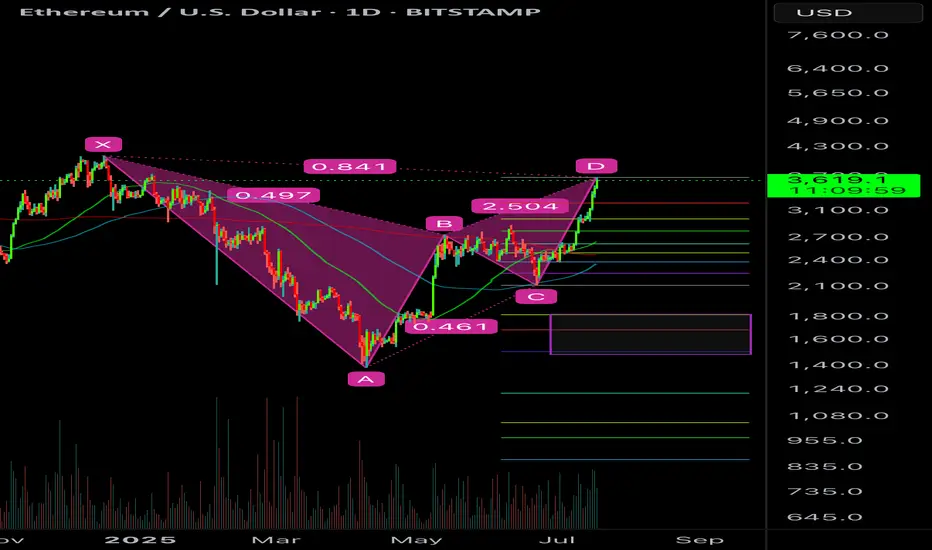
ETH BEARISH BAT POTENTIALETH can go slightly higher but it’s at/near the .886 retracement and meets a valid bearish bat pattern.
I would be targeting a full move if it is unable to break above the .886.
Too many euphoric here. The move has been really scammy off the hype news of Genius Act which everyone saw coming. Expect a sell the news event and BTC.D bounce would destroy alts for one last capitulation most alts may drop 40-50% from here. Then the real bull will start.
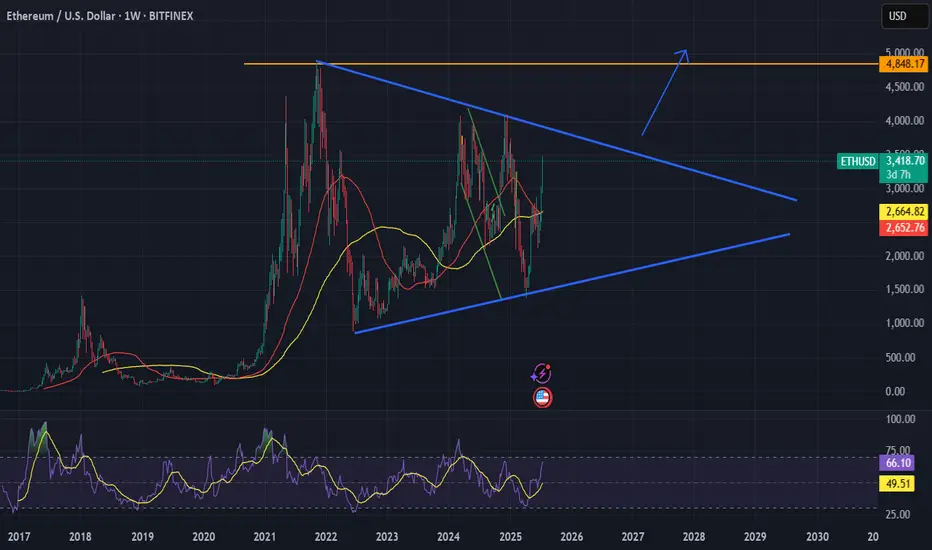
ETHUSD | 1W Time Frame | BITSTAMP ExchangeDate: July 18, 2025
The recent up-trend of Ethereum over the past few weeks has generated optimism among many supporters of this token. However, the critical resistance level at $4,000 poses a significant challenge to this bullish momentum. For the most optimistic Ethereum enthusiasts, who are hoping for a two-digit price, the ultimate goal is for Ethereum to reach $10,000 and beyond. Achieving this will hinge on breaking through the $4,000 resistance. If this barrier remains intact, Ethereum may continue to follow its previous disappointing trend.
On the other hand, Ethereum is currently supported by a substantial price floor around $1,600, which aligns with the SMA400 on the weekly time frame. While this level provides a solid foundation for mid-term and long-term holders looking to re-enter the market, it is essential to approach this support with caution. A sustained hold above this level is crucial for maintaining bullish sentiment; otherwise, a downturn could lead to further declines.

DeGRAM | ETHUSD retest of the support level📊 Technical Analysis
● ETH exploded out of the purple median channel, invalidating March-July lower-highs; retest of 3 210 held as a fresh higher-low, confirming trend acceleration.
● Price is now travelling the channel’s outer parallel; flag pole projected from the 2 430→3 210 thrust aligns with the 4 150-4 250 supply zone shown in pink.
💡 Fundamental Analysis
● CME ether futures OI hit a 14-month high on 17 Jul while exchange balances dropped to a five-year low, signalling strong institutional demand and tight float ahead of expected spot-ETF approvals.
✨ Summary
Long 3 210-3 300; hold above 3 210 targets 3 600 → 4 200. Bull view void on a 16 h close below 3 020.
-------------------
Share your opinion in the comments and support the idea with like. Thanks for your support!
ETH 1D Overview Finally we are seeing altcoins regaining lost ground on Bitcoin and the second largest crypto by market cap is rallying strong.
Since ETH has such strength currently the opportunity to short is quite slim with high risk, however I think it's important to see where ETH may find some resistance or if a pullback was to happen, where would it come from?
The first level is the bearish orderblock level that has just been tapped as of writing. This area previously began the sell-off at the end of 2024 by confirming a new lower high. Naturally this area will present problems for the bulls and so a potential pullback could be initiated from this level. I would like to see a sweep of the stop loss positions just above the area and then a SFP to confirm the pullback is in motion.
Should the bearish orderblock fail the next clear level is the daily local top around $4000. A big even level and the area that started 5 months of downtrend. IMO the most likely level where longs will take profit. I do think if we see any form of consolidation between the bearish orderblock and the local high the bulls will look to carry the rally on, shallow pullbacks maintain momentum
Ten out of the last eleven days have been green candles with the only one day being red just above a key high, I expect if we are to get a pullback that bullish orderblock area ($2900-3000) to be retested as support. Therefor if any of the above areas initiate a pullback this area should provide support and therefor a long entry.
To clarify I am in no way bearish about Ethereum, this is just a plan for different eventualities.

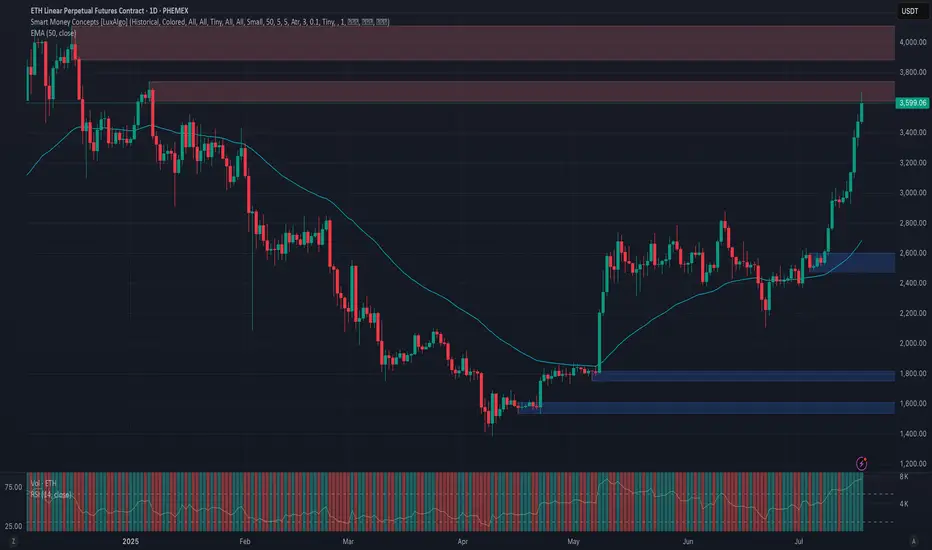
Phemex Analysis #98: ETH Price Explodes— Is $5,000 Finally Next?Ethereum ( PHEMEX:ETHUSDT.P ) has recently shown impressive strength, surging past significant resistance levels and stirring excitement in the crypto market. After an extended consolidation, ETH decisively broke through the crucial $3,300 resistance level, rallying more than 15% in just three days, and is now trading confidently around $3,500.
This renewed bullish momentum has traders and investors eagerly speculating: Could this be the start of Ethereum's next major run? Or should caution prevail amid ongoing market uncertainty? To help navigate this critical period, let's explore several key trading scenarios.
Possible Scenarios
1. Bullish Continuation – Targeting New Highs
Ethereum’s recent breakout above the $3,300 resistance signals strong bullish sentiment. If buying volume continues increasing, ETH could swiftly move towards higher resistance levels at $3,800 and potentially challenge the psychological milestone of $4,100.
Pro Tips:
Profit Targets: Consider locking in partial profits as ETH approaches strong resistance zones around $3,800 and $4,100.
Risk Management: Place tight stop-loss orders on recent lows, approximately around $2,902 to minimize downside risks.
2. Short-term Retracement – Healthy Pullback
Given ETH’s rapid surge, a short-term pullback to retest the recently broken resistance zone at $3,300 to $3,000 (now acting as strong support zone) is plausible. A successful retest would strengthen the bullish case, signaling healthy consolidation before further upward momentum.
Pro Tips:
Buying the Dip: If ETH holds above $3,000 with declining volume, consider cautiously adding to your positions or initiating new longs.
Volume Confirmation: Closely watch trading volume; lower volume during pullbacks typically indicates a healthy retracement rather than a bearish reversal.
3. Bearish Reversal – Breaking Below Critical Support
If Ethereum’s price experiences heavy selling pressure and breaks below the key support at $3,000, bearish sentiment could escalate, potentially driving ETH towards lower support levels near $2,470 and possibly even $2,110.
Pro Tips:
Short Positions: Experienced traders might consider initiating short positions if ETH decisively breaks below the crucial $3,000 support zone on increasing selling volume.
Long-term Accumulation: Long-term investors may strategically accumulate ETH near stronger support areas at $2,470 and $2,110, after clear signs of price stabilization.
Conclusion
Ethereum (ETH) currently offers attractive opportunities, propelled by recent bullish momentum yet balanced by market uncertainties. Traders must closely observe key resistance at $4,000, critical support around $3,000, and carefully analyze trading volumes for confirmation of market direction. By maintaining disciplined risk management and strategically capitalizing on outlined scenarios, investors can effectively navigate ETH’s price action in the weeks ahead.
🔥 Tips:
Armed Your Trading Arsenal with advanced tools like multiple watchlists, basket orders, and real-time strategy adjustments at Phemex. Our USDT-based scaled orders give you precise control over your risk, while iceberg orders provide stealthy execution.
Disclaimer: This is NOT financial or investment advice. Please conduct your own research (DYOR). Phemex is not responsible, directly or indirectly, for any damage or loss incurred or claimed to be caused by or in association with the use of or reliance on any content, goods, or services mentioned in this article.
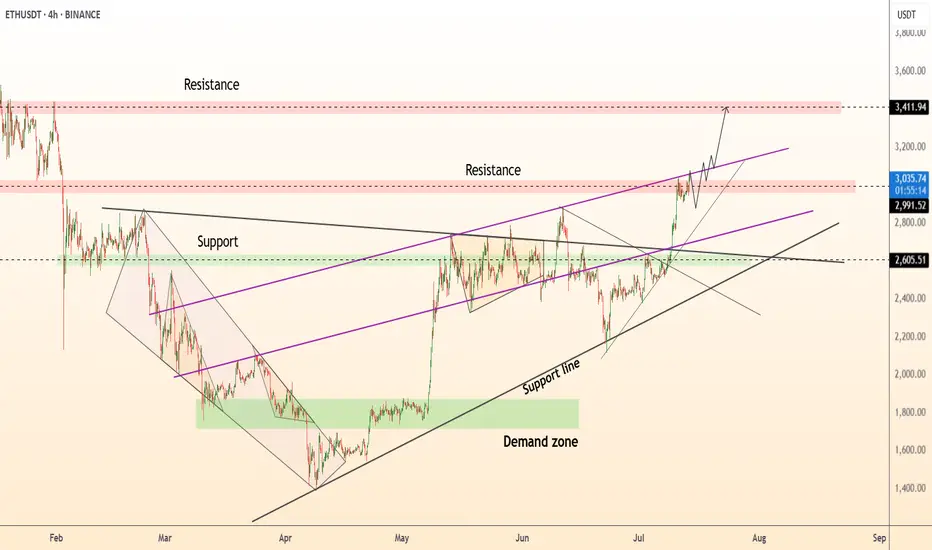
DeGRAM | ETHUSD above the resistance area📊 Technical Analysis
● Price burst through the 12-week compression roof, converting the 2 990 supply into support and printing the strongest close since March.
● The pull-back just retested both the purple trend-fan and the 2 960 flip zone; the active rising channel and flag depth map the next magnet at 3 410.
💡 Fundamental Analysis
● SEC’s 12 Jul request for updated spot-ETH ETF S-1s hints at imminent approval, fuelling fresh inflows.
● Glassnode reports the largest daily net-staking deposit since April, reducing exchange float and adding bid pressure.
✨ Summary
Long 2 960-3 000; holding above 2 990 targets 3 110 → 3 410. Bias void on an H4 close below 2 860.
-------------------
Share your opinion in the comments and support the idea with like. Thanks for your support!
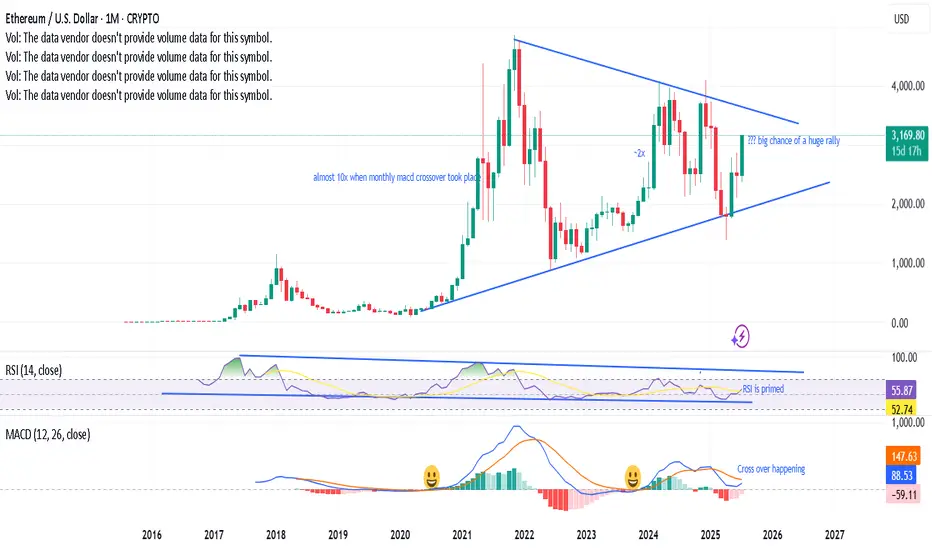
Monthly MACD crossover taking place, a prabolic rise?Last 2 times, when the monthly MACD cross over has happened, ETH has gone bonkers. A third one is on the verge of happening, RSI has enough room with a symmetrical triangle with bullish momentum - looks like a big rally is in the near horizon. Fingers cross.
Technical **chart analysis** for ETH/USDTechnical **chart analysis** for **ETH/USD** based on (15-min timeframe) :
Bullish Outlook**
* **Price Action**: Ethereum is consolidating just above previous resistance (\~\$3,440) after a breakout from the range.
* **Current Price**: \~\$3,446
* **EMA Support**:
* EMA 7: \$3,441 (price holding above)
* EMA 21: \$3,413
* EMA 50: \$3,376 (strong dynamic support)
Key Levels**
* **Resistance Broken**: Former resistance zone (\~\$3,415–\$3,440) now acting as support.
* **S1 Support Zone**: \$3,415–\$3,440 (ideal retest zone for long entries)
* **S2 Support Zone**: \$3,335–\$3,350 (next demand zone if S1 fails)
Analysis Summary**
* **Trend**: Bullish momentum is intact above EMA cluster.
* **Setup**: Retest of breakout zone successful → price stabilizing above EMA7.
* **Target Area**: If momentum continues, next target zone could be \$3,500–\$3,560 (as shown by green arrow).
* **Invalidation**: Drop below \$3,413 (EMA21) and especially \$3,376 (EMA50) would weaken the bullish structure.

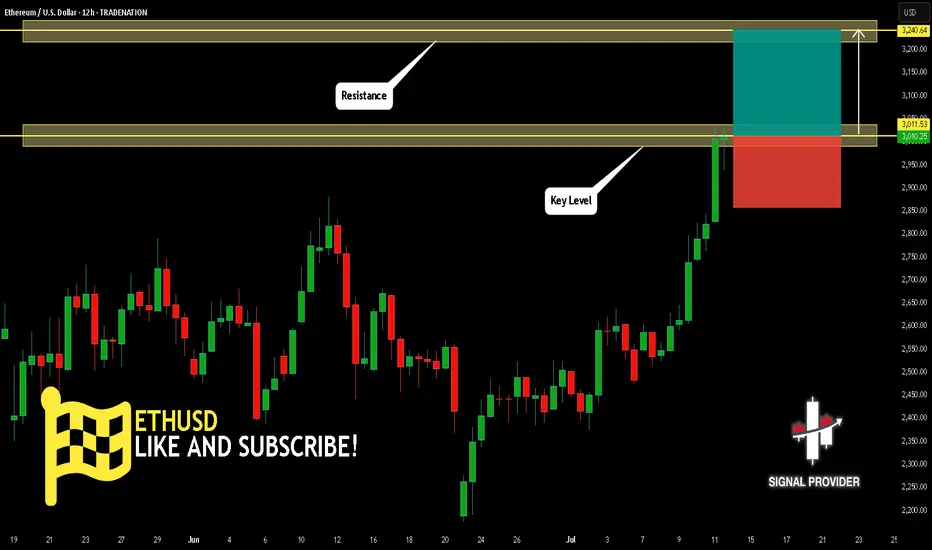
ETHUSD Is Going Up! Buy!
Please, check our technical outlook for ETHUSD.
Time Frame: 12h
Current Trend: Bullish
Sentiment: Oversold (based on 7-period RSI)
Forecast: Bullish
The market is approaching a key horizontal level 3,011.53.
Considering the today's price action, probabilities will be high to see a movement to 3,240.64.
P.S
The term oversold refers to a condition where an asset has traded lower in price and has the potential for a price bounce.
Overbought refers to market scenarios where the instrument is traded considerably higher than its fair value. Overvaluation is caused by market sentiments when there is positive news.
Disclosure: I am part of Trade Nation's Influencer program and receive a monthly fee for using their TradingView charts in my analysis.
Like and subscribe and comment my ideas if you enjoy them!
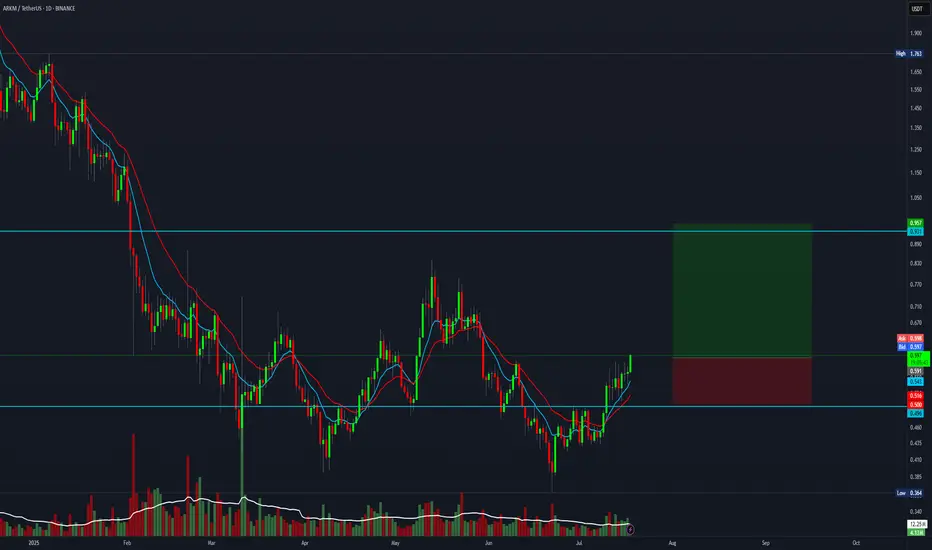
4:1 R:R trade setup for ARKMEverything is pumping right now, and this one also offers a 4:1 R:R setup.
Entry: 0.596
Stop Loss: 0.500
Target: 0.950
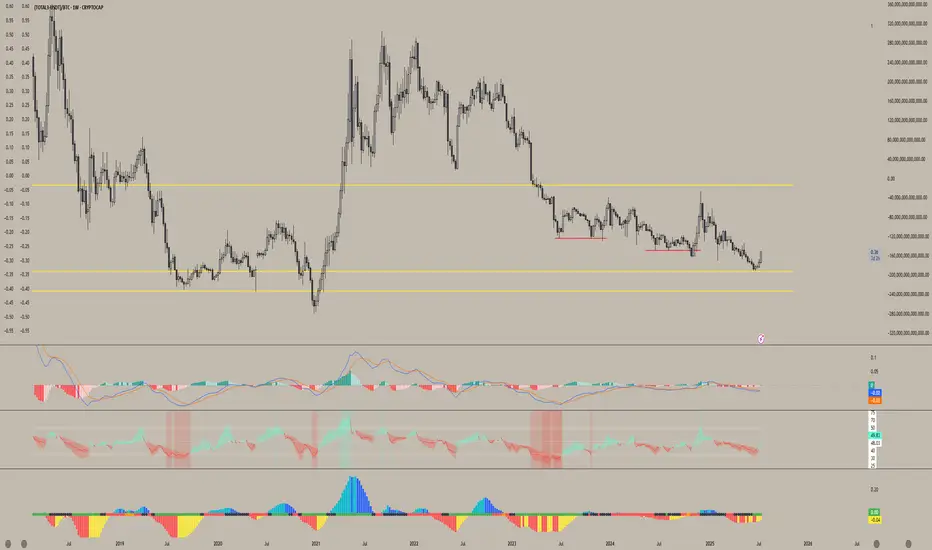
Altcoin Market Structure Outlook | ETH/BTC Rotation AnalysisThis chart outlines a cyclical framework I'm using to anticipate a potential bottom in altcoins heading into Q4. Currently, ETH is outperforming BTC, and altcoins are following its momentum - though many continue to make lower lows relative to ETH.D but as long as eth rallies I see Alts keeping up.
Historically, we've seen altcoin capitulation phases follow a two-stage structure: an initial local bottom in June/July, followed by a final sweep or structural low into October (Q4), as observed in both 2023 and 2024. Given this repeating seasonal pattern, I expect ETH to potentially retrace against BTC in Q4 making a higher low, which could set the stage for altcoins to make a lower low and retest their key range lows — particularly near the 0.25 ETH/BTC level.
Should ETH maintain a higher low and resume trend afterward, it would likely mark a rotation point where capital begins flowing into higher-beta altcoins. Coupled with potential macro tailwinds like rate cuts or dovish policy pivots, this scenario could trigger a strong altcoin rally from Q4 into Q1.
This chart aims to visualize that rotational capital flow and position sizing opportunity across the cycle.
New phase of ETH adoption? holding longLot of bills and adoption of ETH ecosystem, i do like the idea of another 2017 like breakout, CRYPTOCAP:ETH COINBASE:ETHUSD
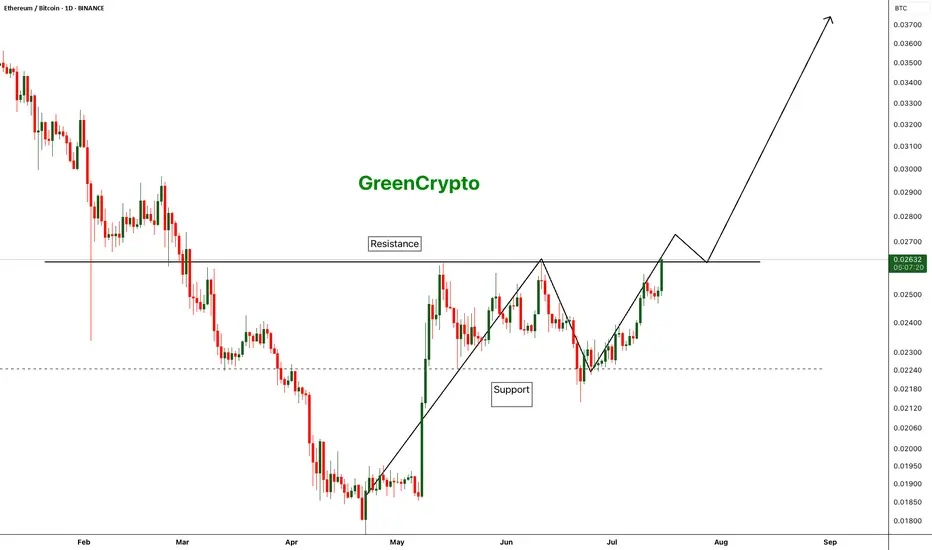
ETH/BTC - Finally Trend is reversing - After a long time we are finally seeing a change in the trend of ETH/BTC pair.
- Compared to BTC, ETH was underperforming for last couple of years and we are seeing some strength in ETH
- If this trend continue we can finally see some new ATH on ETH
Entry: 0.02633
StopLoss: 0.02125
TP1: 0.02825
TP2: 0.03168
TP3: 0.03592
Don't forget to keep stop loss. Stay tuned for more updates
Cheers
GreenCrypto
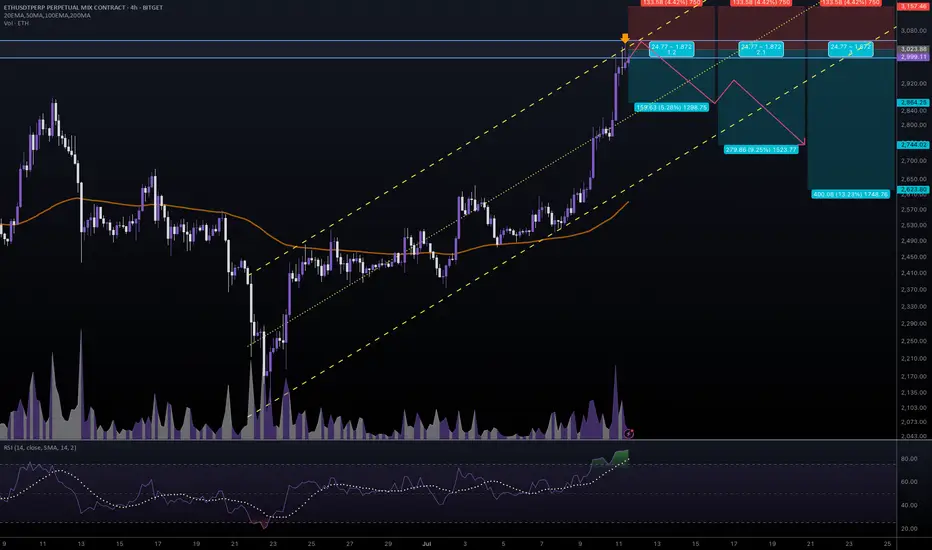
#ETHUSDT #4h (Bitget Futures) Ascending channel on resistanceEthereum printed a gravestone doji followed by a shooting star, RSI is overbought, local top seems in.
⚡️⚡️ #ETH/USDT ⚡️⚡️
Exchanges: Bitget Futures
Signal Type: Regular (Short)
Leverage: Isolated (9.0X)
Amount: 5.0%
Entry Zone:
2996.99 - 3050.49
Take-Profit Targets:
1) 2864.25
2) 2744.02
3) 2623.80
Stop Targets:
1) 3157.46
Published By: @Zblaba
CRYPTOCAP:ETH BITGET:ETHUSDT.P #4h #Ethereum #PoS ethereum.org
Risk/Reward= 1:1.2 | 1:2.1 | 1:3.0
Expected Profit= +47.5% | +83.3% | +119.0%
Possible Loss= -39.8%
Estimated Gaintime= 1-2 weeks
ETH vs 200MA: Another TestETH on the daily has been pushed back so many times by the 200MA. Will price conquer it this time? I guess we’ll just have to wait and see.
Today is Friday, July 4th, so probably a long weekend for most traders. Somehow, price got pushed back again. Just a hunch, but I believe long traders are touching grass this weekend while sellers are grinding.
Anyway, we now have a support zone under price, made up of the 200MA and the 0.5 Fib — which, in theory, should hold against any attempts to push the price lower this weekend.
Always take profits and manage risk.
Interaction is welcome.
