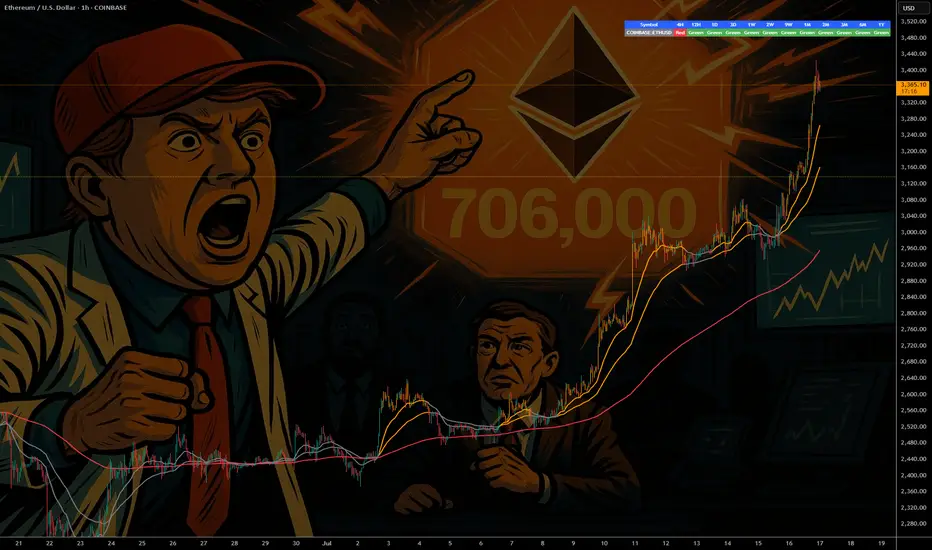
ETH - If You Know ...... You Know whats Coming
NYSE:BLK $BUIDL tokenized U.S.-Treasury fund launched on COINBASE:ETHUSD in Mar 2024—Wall Street is already settling real dollars on-chain.
NYSE:JPM JPMD stablecoin just went live on Base (an COINBASE:ETHUSD L2), piping wholesale payments from a $4 T balance-sheet straight through COINBASE:ETHUSD rails.
COINBASE:ETHUSD isn’t just riding the next crypto cycle—it’s becoming Wall Street’s settlement layer. From BlackRock’s on-chain Treasury fund to JPMorgan’s and soon Bank of America’s dollar tokens, a tidal wave of institutional stable-coin flows is lining up behind ETH. Fewer coins, more real-world volume—if you know, you know what’s coming.
NYSE:BAC CEO says they’ll issue a dollar-backed token the moment regulators nod—another tier-1 bank boarding the Ethereum train.
Stablecoin cap has blasted past $230 B , with 80 %+ of all on-chain transfers riding Ethereum (plus BSC) blocks.
Corporate settlements via stablecoins grew 25 % YoY in 2024 as multinationals replaced SWIFT with instant on-chain clearing.
Daily stablecoin throughput averages $7 B—each hop burning ETH and tightening supply.
BCG projects tokenized real-world assets to exceed $16 T by 2030 , with EVM chains as the default plumbing.
Over 500 M wallets already interact with stablecoins , a 30 % YoY surge led by emerging-market demand.
L2s like BINANCE:ARBUSDT & BINANCE:OPUSDT cut transaction fees 35 % yet still settle back to mainnet—meaning ETH captures the fee stream and the burn.
Bottom line: a tidal wave of bank-grade stablecoins + tokenized assets is lining up behind ETH; supply shrinks, demand soars—if you know, you know what’s coming.
quote] Marty Boots | 17-Year Trader — smash that , hit LIKE & SUBSCRIBE, and share your views in the comments below so we can make better trades & grow together!
Ethereum (Cryptocurrency)
ETH/BTC Poised for a Breakout: A Technical and Fundamental ViewA confluence of technical signals on the weekly ETH/BTC chart, coupled with significant fundamental developments for both Ethereum and Bitcoin, suggests a potential upward move for the pairing in the coming weeks.
Technical Analysis (TA)
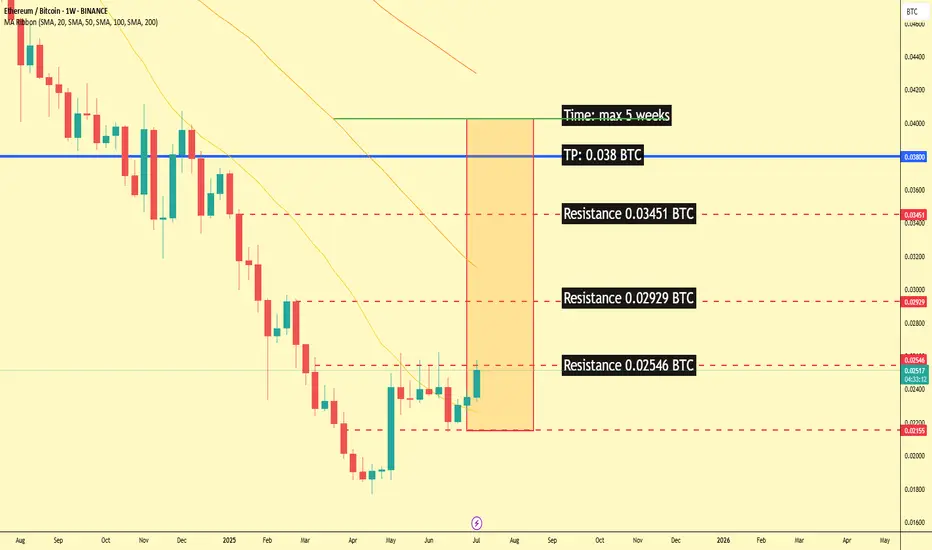
The weekly chart for ETH/BTC on Binance reveals a potential bottoming formation after a prolonged downtrend. The price has been consolidating in recent months, and the latest weekly candle shows a strong bullish engulfing pattern, indicating a possible shift in momentum.
Key levels to watch, as identified on the chart, are:
Immediate Resistance: 0.02546 BTC. A decisive close above this level on the weekly timeframe would be the first confirmation of a potential trend reversal.
Further Resistance: 0.02929 BTC and 0.03451 BTC. These represent subsequent hurdles for the bulls to overcome.
Take Profit Target: 0.038 BTC. This level is marked as the ultimate target for this potential upward move.
Timeframe: The analysis on the chart suggests a maximum timeframe of 5 weeks for this trade idea to play out.
Moving Averages: The price is currently trading below the MA Ribbon (SMA, 20, 50, 100, 200), which could act as dynamic resistance. A break above this ribbon would further strengthen the bullish case.
Fundamental Analysis (FA)
The current market environment in July 2025 provides several fundamental catalysts that could impact the ETH/BTC ratio.
For Ethereum (ETH):
Growing Institutional Interest: Ethereum ETFs have seen significant inflows, with over $890 million in July 2025 alone, driven by increasing confidence from institutional investors. Asset managers like BlackRock are accumulating substantial amounts of ETH, reducing the available supply on the market.
Network Upgrades: The upcoming "Pectra" upgrade, which includes Proto-Danksharding (EIP-4844), is anticipated in Q3 or early Q4 2025. This is expected to significantly reduce Layer-2 transaction costs and improve scalability, further enhancing the utility of the Ethereum network. The earlier Pectra upgrade in 2025 already introduced user-friendly features like smart accounts.
Ecosystem Growth: The Linea project, a prominent player in Ethereum's DeFi ecosystem, has a Token Generation Event (TGE) scheduled for July 2025, which is expected to drive market shifts. The overall DeFi ecosystem on Ethereum is showing signs of revitalization.
For Bitcoin (BTC):
Strong Institutional Demand: Similar to Ethereum, Bitcoin is experiencing a wave of institutional adoption, with significant inflows into spot Bitcoin ETFs. Public companies are now holding BTC in their treasuries, and major financial institutions view it as a strategic asset.
New All-Time Highs: Bitcoin has recently surged to new all-time highs, breaking key trendlines and signaling a new bullish era. This strong performance often has a spillover effect on the broader crypto market, including altcoins like Ethereum.
Favorable Macro Environment: Some analysts point to a looser monetary policy from global central banks and inflation concerns as factors boosting demand for hard assets like Bitcoin.
ETH vs. BTC Dynamics:
While Bitcoin's price has seen impressive gains, some analysts believe Ethereum has room to catch up. The ETH/BTC ratio is a key metric for gauging the relative strength of the two leading cryptocurrencies. An upward trend in the ETH/BTC chart, as suggested by the technical analysis, would indicate that Ethereum is outperforming Bitcoin. The performance of ETH relative to Bitcoin is often seen as a barometer for the broader altcoin market.
My point of view
The technical setup on the ETH/BTC weekly chart presents a compelling case for a potential bullish reversal in the short to medium term. This is supported by strong fundamental developments within the Ethereum ecosystem, including significant institutional inflows and major network upgrades. While Bitcoin's own bullish momentum is a factor to consider, the potential for Ethereum to outperform in the coming weeks, as indicated by the provided chart analysis, offers an interesting trading opportunity. Traders should closely monitor the identified resistance levels for confirmation of a breakout.
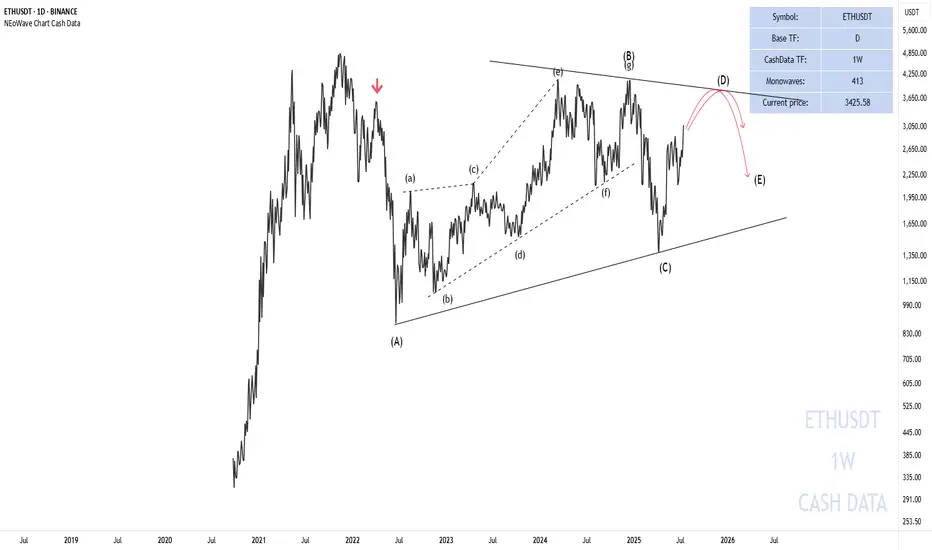
NEoWave Analysis of Ethereum 2025 Cash data chart shows that Ethereum is in a corrective phase and the wave structure from (A) to (C) has been completed. Initially, we expected a flat pattern to form; however, the wave structure-(C) was not an impulse and the flat was not confirmed.
As a result, given that the wave structure (A)-(B)-(C) is corrective and the waves differ in time, it seems that a contracting triangle pattern is forming and we are currently in wave-(D) of this triangle. Furthermore, wave-(D) could rise to $3630-3880 and end. Then a price correction in the form of wave-(E) may occur. This correction could end between $2900-3086 and if this range is broken downwards, wave-(E) could decline to $2000-2230, after which the main bullish move for Ethereum is expected to begin.
Good luck
NEoWaveChart
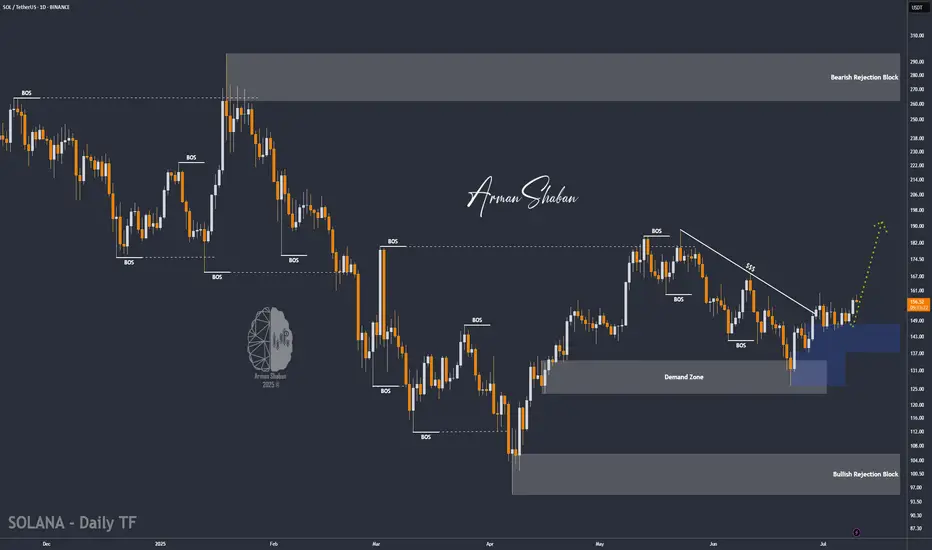
SOL/USDT : SOL Rebounds Strong – Is a 25% Rally Just Beginning?By analyzing the Solana (SOL) chart on the daily timeframe, we can see that after dropping to the $147.75 zone, the price experienced renewed buying pressure and has since rallied to around $159, delivering over 6% return so far.
This cryptocurrency shows strong bullish potential, with short-term gains possibly exceeding 25%.
The next upside targets are $168.5, $187, $220, and $263.
Please support me with your likes and comments to motivate me to share more analysis with you and share your opinion about the possible trend of this chart with me !
Best Regards , Arman Shaban
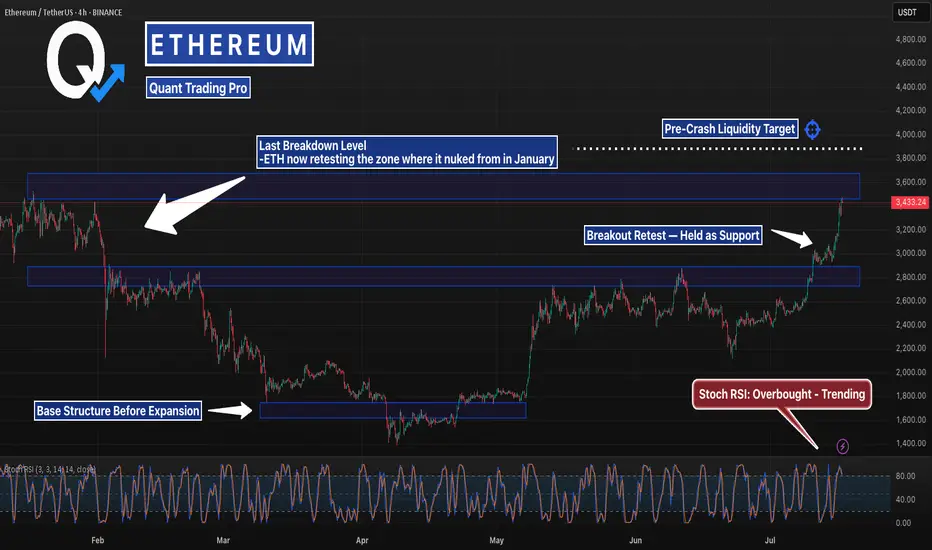
This Level Crashed ETH Last Time… It’s BackETH just blasted back into the same zone it collapsed from in January — but this time the structure underneath is stronger, tighter, and holding.
Stoch RSI is stretched, but bullish momentum remains intact. If it clears $3,870, lights out.
#Ethereum #ETHUSD #CryptoCharts #BreakoutLevels #ChartAnalysis #TradingView #QuantTradingPro #CryptoTraders #BacktestEverything
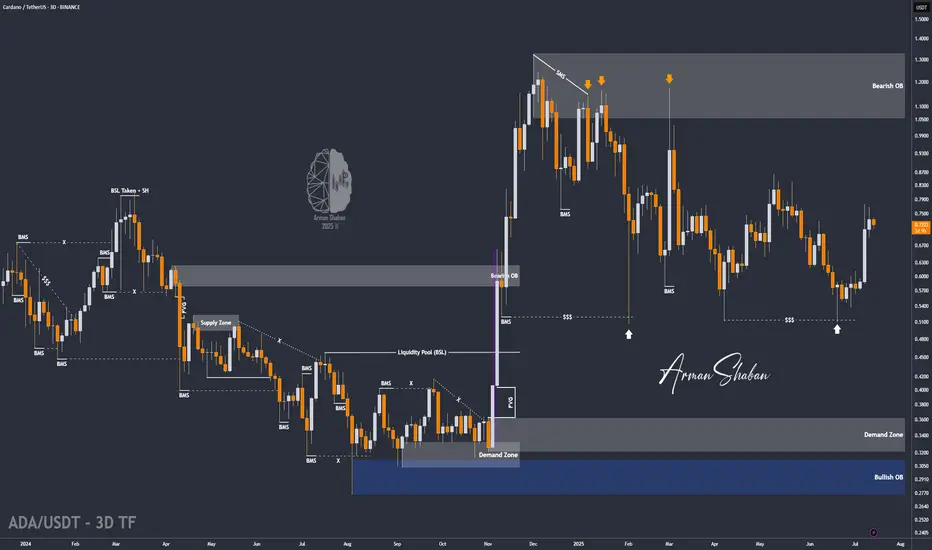
ADA/USDT : +50% in 21 Days, More Rise Ahead? (READ THE CAPTION)Over 50% growth in just 21 days — Cardano’s explosive rally continues, and the $0.76 target has now been hit! Since our last analysis, ADA has kept pushing higher, successfully reaching the next key level and bringing the total return from this move above 50%. Currently trading around $0.73, with strong bullish momentum still in play, I expect it won’t be long before we head toward the next targets. Upcoming levels to watch: $0.93, $1.05, and $1.33 — we’re getting closer to that 100% gain!
Please support me with your likes and comments to motivate me to share more analysis with you and share your opinion about the possible trend of this chart with me !
Best Regards , Arman Shaban
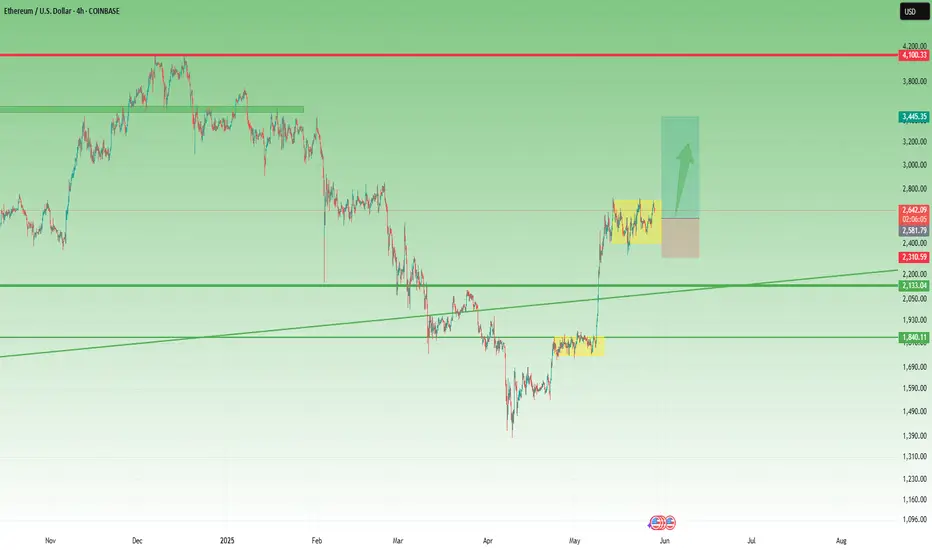
Ethereum – Calm Before the Next Leg Up?Ethereum had a disappointing start in 2025.
After pushing above $4,000 in mid-December 2024 — with headlines full of "$10K ETH coming!" — the new year began around $3,500, and what followed was a slow bleed.
By early April, Ethereum printed a shocking low at $1,380 — a level few believed was even possible.
But the bounce from there? ⚡
It was explosive — nearly +100% in just one month, with price topping around $2,700.
Since then, we’ve been consolidating — and that’s completely normal after such a vertical move.
🔍 So, what’s next?
Technically, ETH is forming a rectangle, a structure that often resolves as a continuation pattern.
The spike down to the $2,300 zone on May 19th was telling — buyers stepped in aggressively and pushed price back above $2,500, which now acts as a comfort zone for bulls.
📌 Conclusion
I’m looking to buy dips, ideally near $2,550, and my target is the $3,500 zone.
No need to reconsider the bullish outlook as long as price holds above $2,300.
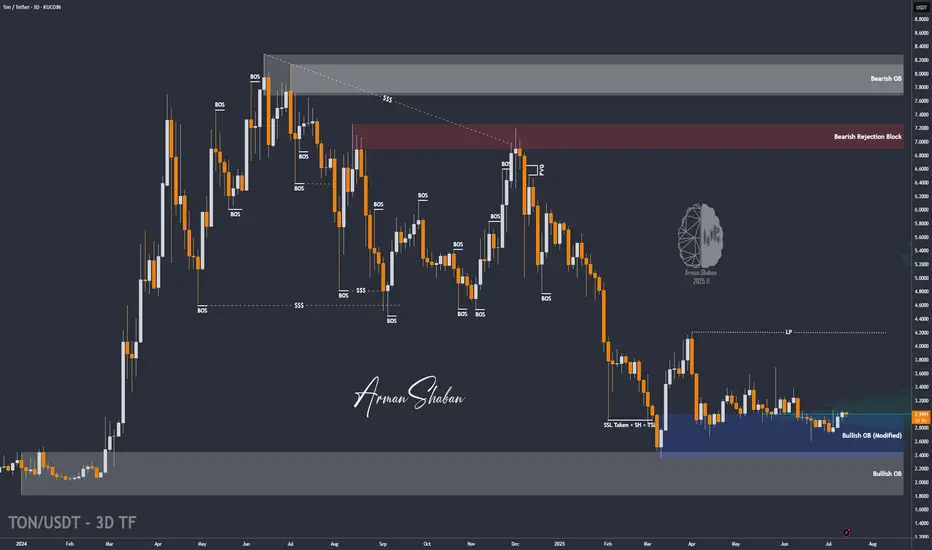
TON/USDT : Get Ready for a new Rally! (READ THE CAPTION)By analyzing the Toncoin chart on the 3-day timeframe, we can see that the price has finally managed to grow over 3% as expected, and is currently consolidating above the $3 level. We’ll have to see how far this bullish momentum can continue — but to be honest, I expected a stronger move considering the market rally and Bitcoin repeatedly hitting new ATHs. Still, no worries — once Bitcoin takes a breather, altcoins will likely begin their powerful runs! Based on previous analysis, the next targets are $3.15, $3.63, $4.20, and $4.68 respectively.
Please support me with your likes and comments to motivate me to share more analysis with you and share your opinion about the possible trend of this chart with me !
Best Regards , Arman Shaban
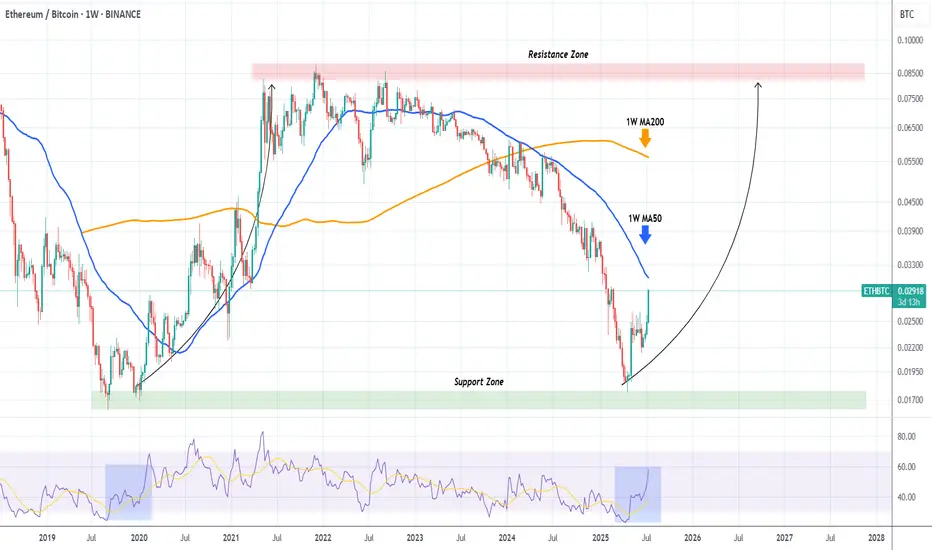
ETHBTC shows that Ethereum will outperform Bitcoin MASSIVELY!The ETHBTC pair has been rebounding hyper aggressively after the April 21 2025 Low on the 6-year Support Zone, and is now facing it's most important test, the 1W MA50 (blue trend-line).
This trend-line has been its Resistance since basically March 13 2023, so if broken, it will be a massive bullish break-out signal.
In fact during the 2020 - 2021 Bullish Leg, once the price broke above the 1W MA50, the market got the final confirmation of the upcoming long-term rally.
We expect Ethereum to outperform Bitcoin for the rest of the year at least.
-------------------------------------------------------------------------------
** Please LIKE 👍, FOLLOW ✅, SHARE 🙌 and COMMENT ✍ if you enjoy this idea! Also share your ideas and charts in the comments section below! This is best way to keep it relevant, support us, keep the content here free and allow the idea to reach as many people as possible. **
-------------------------------------------------------------------------------
💸💸💸💸💸💸
👇 👇 👇 👇 👇 👇
eth,long trend is comingmaybe last from 2025 to 2026
key points:4000,4800
Big big guess, value around $1 trillion, price near $8000

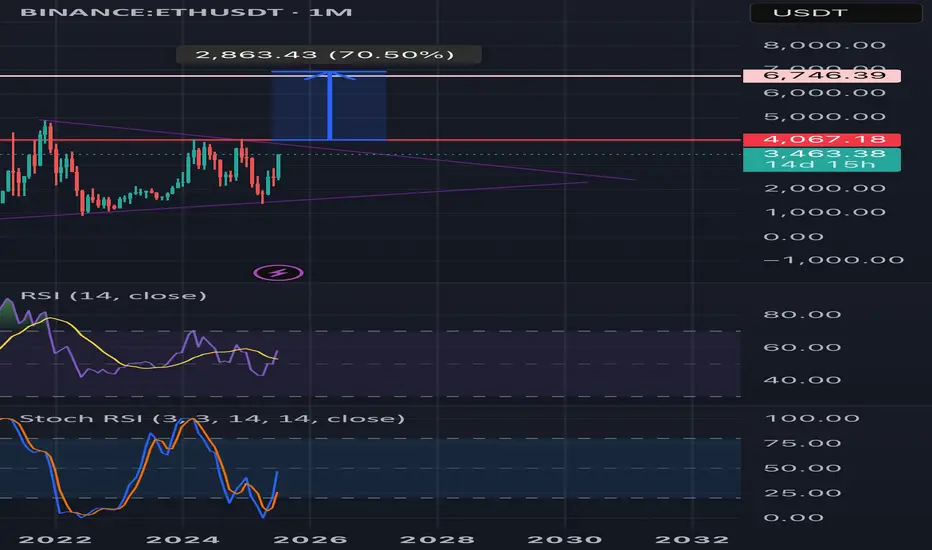
Upward breakout for ETH monthly?🟣 Ethereum Monthly Timeframe Analysis – Large Symmetrical Triangle
📌 Current Situation:
• On the monthly chart (1M), Ethereum (ETH) has formed a large symmetrical triangle pattern.
• This pattern typically signals a major price consolidation before a significant move.
• The descending resistance line connects the 2021 all-time high to recent lower highs.
• The ascending support line is drawn from the 2018 low through the 2022 bottom.
• Price is nearing the apex of the triangle, indicating a breakout is likely soon.
⸻
🔼 Bullish Scenario (Breakout to the Upside):
If ETH breaks above the triangle resistance and confirms the move:
✅ Signs of a Bullish Continuation:
• Strong breakout above the $4,000–$4,500 zone
• Increased volume confirming breakout
• Price holds above resistance-turned-support
🎯 Potential Price Targets by 2027 (based on triangle height & Fibonacci projections):
1. Target 1: $6,800 – $7,500
2. Target 2: $9,000 – $10,000
3. Long-term Target: $12,000 – $15,000 (if macro bull market continues)
⸻
🔽 Bearish Scenario (Fakeout or Breakdown):
If the breakout fails or price breaks down:
• ETH could revisit lower supports around $2,000 or even $1,400
• Bullish momentum delayed until another strong base forms
⸻
🔍 Conclusion:
• This triangle could mark the beginning of a major rally into 2027, especially if supported by fundamentals (e.g., ETF approval, DeFi growth).
• Wait for a confirmed breakout with volume and retest before entering a long-term position.
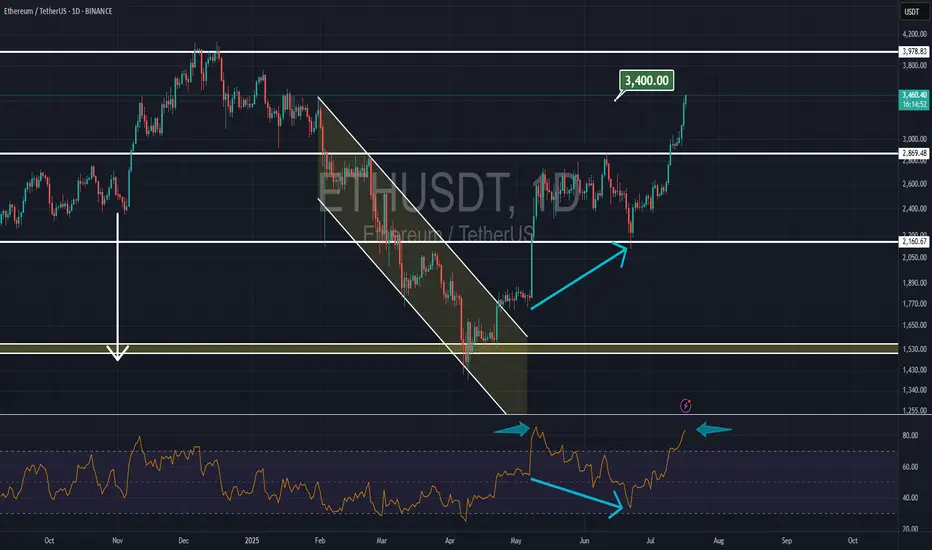
Ethereum reached to our target
Ethereum reached to $3400 that we talked about since weeks ago, but now the daily RSI is at overbought area and we might see a correction.
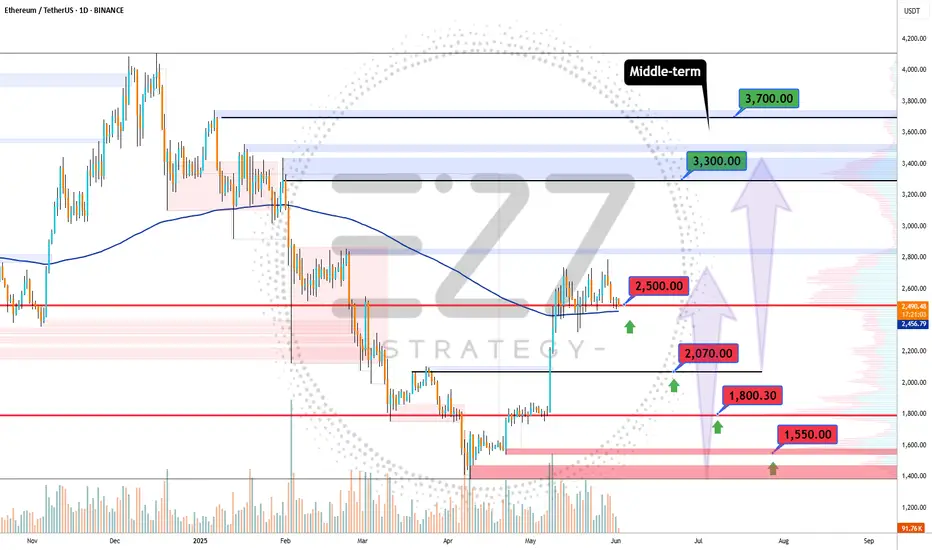
ETHUSDT minor trendsEthereum BINANCE:ETHUSDT is downtrend with lower highs from the bottom is nearly finished 📉 . For a stronger rise, it needs to stabilize above $2500 ⚡. Mid-term targets are $3300 (end of second leg) and $3700 (major resistance) 🎯. Key supports are $2500, $2070, $1800, and $1550, the base where the uptrend began 🛡️.
Supports & Resistances:
Supports: \$2500, \$2070, \$1800, \$1550
Resistances: \$2500 (critical level), \$3300, \$3700
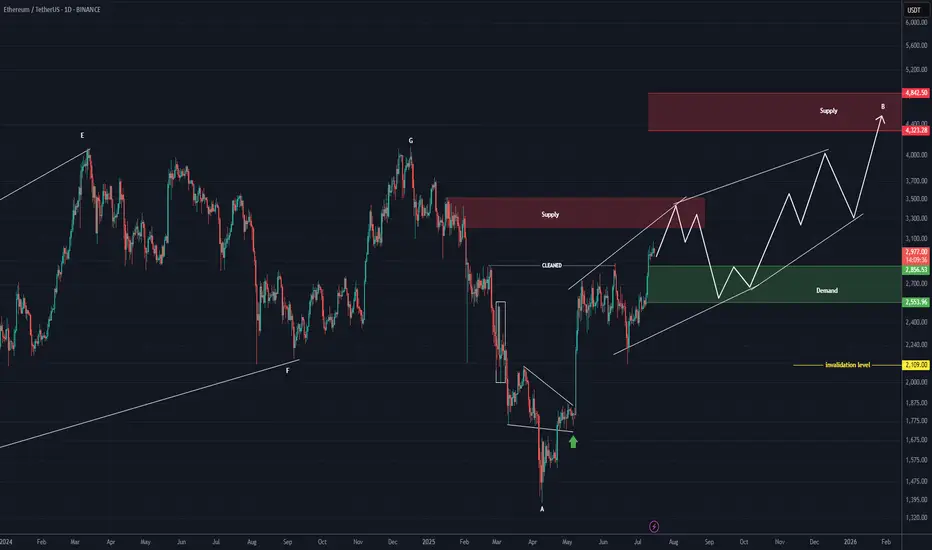
ETHEREUM Roara Map (1D)The previous phase of Ethereum appears to have been a completed diametric, and now it seems we are in a flat pattern.
It can be said that we are currently in wave B of the flat, which itself appears to be a diametric.
This diametric could even extend to the 4300–4800 range.
The green zone is the rebuy area.
A daily candle close below the invalidation level would invalidate this analysis.
For risk management, please don't forget stop loss and capital management
Comment if you have any questions
Thank You
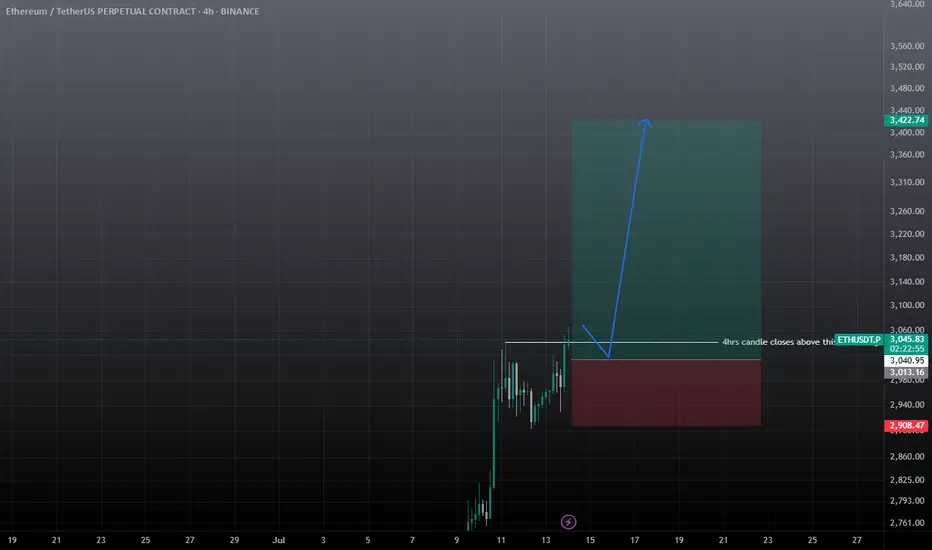
ETHUSDT BUY / Long SetupThis 4hrs candle closes above the mentioned level, then took long from 50% fib level of the fvg, and put sl below the recent swing low, I will update the trade whether it's active or not? tp towards 3.3-3.4k , while btc.d getting recked so becareful shorting any altcoin.
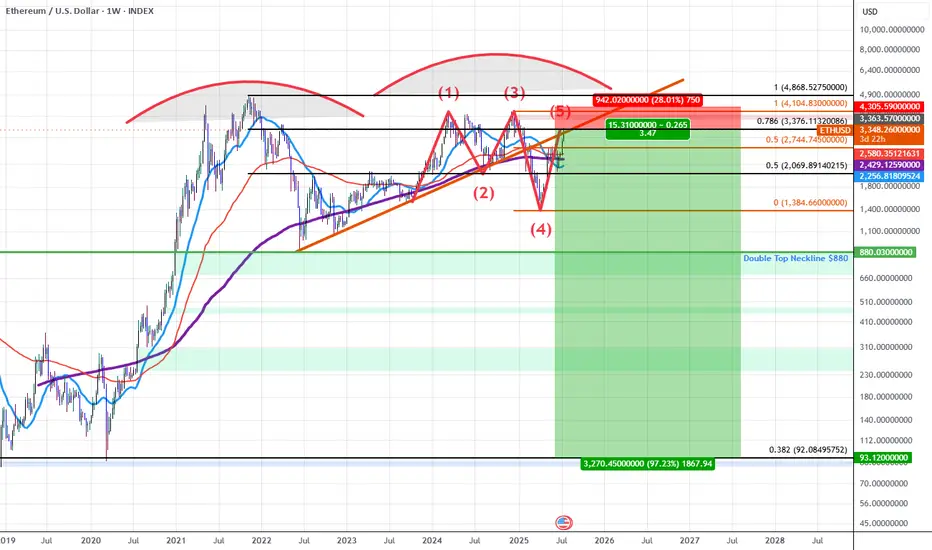
ETHUSD: Double Top into A Bearish 5-0 Breakdown (Extended)Updated Commentary: ETH has extended a bit further than projected as the Pattern Completed at the 0.618 but ETH gapped into the 0.786 instead. The gap up aligned with an upside gap fill on the CME futures as well as a gap fill on the grayscale ETH futures ETF $ETHE. The easier move from here to simply add to the ETH shorts and adjust the stop to be above the previous highs while sizing up at the 0.786 and playing off this gap higher as an anomaly. Beyond this, my view on ETH at the current 0.786 retrace remains the same as the original Idea posted as ETH rose into the initial 0.618 PCZ the details of which I will also include once again below as it still remains relevant.
ETH for the last 5 years has been developing a Double Topping pattern which has put in a series of lower highs during the most recent 2nd run up. As we've confirmed these lower highs we've broken down below trendline and are finding resistance at the trendline which happens to have confluence with the PCZ of a Bearish 5-0 wave formation near a 0.786 retrace.
As we begin to find weakness and Bearish price action begins I suspect price will make it's way towards the neckline of the double top aligning with the $880 price level if ETH breaks below that level there will be no significant support until it reaches the all-time 0.382 retrace down at around $92.10.
In short it seems ETH is in the early stages of a macro breakdown which could result in value declines greater than 80%.
I also suspect that we will see many of the assets that ran up significantly going into this week to sharply reverse those run-ups as this week comes to a close and the new week begins mainly due to the effects of OpEx, this includes: Bitcoin, MSTR, SOL, XLC, META, and BTBT. Long-dated Put accumulation on these assets at these levels is far easier to manage than naked short positions and that's how I will go about positioning here.
ETHUSD – Possible Correction from Channel Resistance!Pair: ETH/USD
Timeframe: 4H
Structure: Ascending Channel
Indicators: RSI Overbought, Bearish Divergence Forming
Volume: Spike into resistance
📉 What’s happening?
Ethereum just tagged the top of its ascending channel, showing early signs of rejection. RSI is hovering near overbought, with weakening momentum on the last push.
⚠️ Caution Zone:
$3,425 acting as upper resistance
Price may retrace to midline or lower channel support ($3,250 → $3,050 range)
📌 Confirmation:
Look for:
A strong bearish candle or
RSI breaking below 60
Volume divergence
Bias: Short-term bearish correction, bullish structure intact as long as price holds the channel.

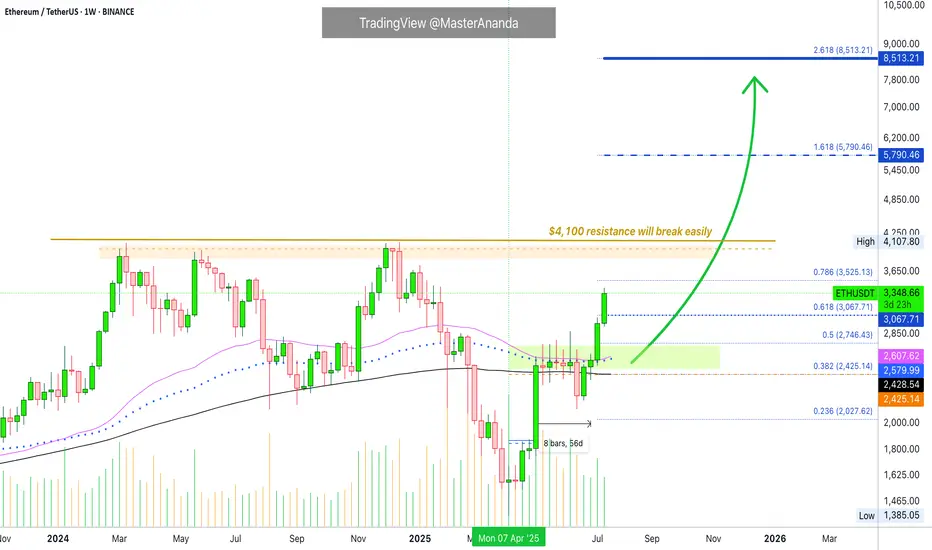
Ethereum · Going beyond $5,790 · $8,513 Next TargetThe eight weeks of consolidation, 56 days, happened as compressed (sandwich style) action right in-between MA200 and EMA55/89.
The EMA55/89 duo worked as resistance while MA200 worked as support.
Before a major move the market always tends to produce a form of shakeout. Sometimes it is call a bear-trap, a shakeout, a liquidity-hunt or stop-loss hunt event, a failed signal, etc.
Here Ether (ETHUSDT) closed below MA200 one week just to recover the next. In this case, we will call it a failed breakdown but we know this is a way to liquidate over leveraged long-traders, also a way to catch unsuspecting bears ready to short. The conclusion is simple, Ether recovered the next week above MA200 and the following week above EMA55/89 which worked as resistance for six weeks. With these levels behind us, the market is full green.
Notice the last two candles, big huge green candle. That is because resistance is no more.
With no resistance to stop prices from rising, Ethereum started to grow and we are now in full blown bullish mode.
The last major high sits at $4,107. This is an easy target, the minimum. Once support is tested the action moves toward resistance and this is where we are headed.
Some people will wonder if resistance will break or hold. Some unsuspecting bears, again, will even short at resistance thinking this is the logical move, they will lose all.
The truth is that this resistance and major high will break easily, we know this based on marketwide action and Bitcoin, Bitcoin is hitting new all-time highs every other day. In this way, we know that Ethereum will soon catch up and do the same.
Many altcoins are moving forward and growing, and some already conquered their December 2024 high price. This is another indication that shows Ether will not stay behind.
Whatever you do when Ethereum goes up, do not short. You can short if you are going to close the short after just a few hours or a few days, but instead of shorting a bullish trend, go LONG and enjoy maximum profits on the way up.
» Ethereum will break $6,000 and move toward $8,500 and beyond in the long-run.
You read it here first.
Thanks a lot for your continued support.
Resistance will break and the altcoins market will continue to grow. Not only for a few months but for a very long time.
When correction time comes, it will last a few months, we will get higher lows and then additional growth. Think of the pattern that came up on Bitcoin but with the altcoins; long-term growth.
Namaste.
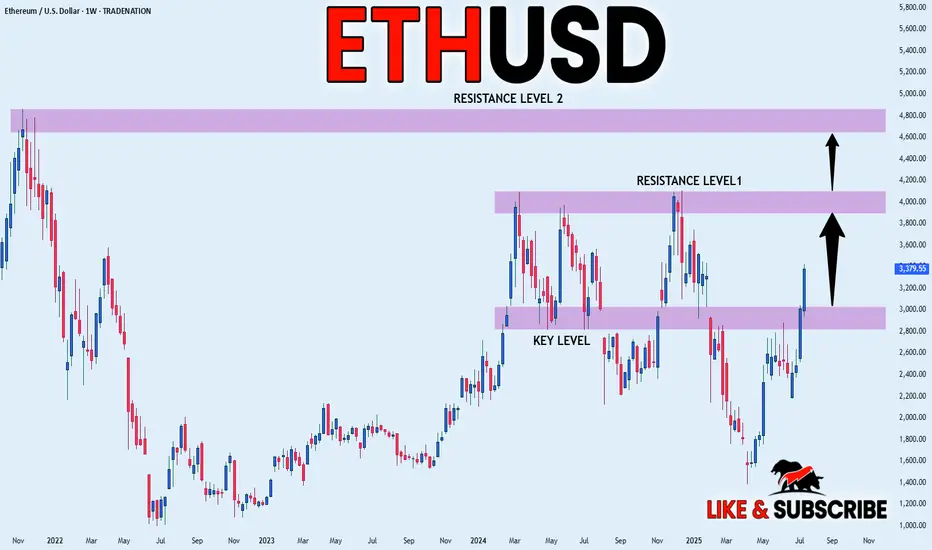
ETHEREUM WILL KEEP GROWING|LONG|
✅ETHEREUM is trading in a
Strong uptrend and the coin
Broke the important horizontal level
Of 3000$ which is now a support
And we are very bullish biased
And we think that ETH will
Reach at least the previous ATH
Of just short of 5000$ but the
First target is to reach and break
A resistance level of 4100$
LONG🚀
✅Like and subscribe to never miss a new idea!✅
Disclosure: I am part of Trade Nation's Influencer program and receive a monthly fee for using their TradingView charts in my analysis.
ETH — Trade Closed! Massive Profit SecuredI’m officially closing my Ethereum position — this trade is now a success story!
I posted right here that ETH was a buy at $2400, then doubled down at $1800. I even echoed the call on Reddit for good measure.
Today, I’m liquidating the entire position with a huge gain. No regrets, just clean execution. 🧠💸
To all the mad lads still holding — good luck and may your conviction be rewarded.
See you next year for the next big swing.
Take your profits, you lunatics! 😄🔥

Major Breakout– Ethereum Broke Free from 'Clashing Resistances'🚀💥 Major Breakout – Ethereum Broke Free from the Clashing Resistances 🔓🟣
ETH has finally done it.
After months of battling overlapping resistances — the Clashing Stones, as we called them — Ethereum has broken out, and $2,912 is now acting as support, not resistance.
This breakout isn't just technical, it’s structural.
The previous 1-2-3 rejection setup has now been invalidated.
🔎 Chart Summary:
✅ $2,912 = confirmed breakout zone
🎯 Destination 1: $4,881 (if Vitalik’s asleep 😴)
🚀 Destination 2: $6,443 (if he wakes up 💡)
🔭 Scroll up for Destination 3
This is the real ETH breakout we’ve waited for — not hopium, not chop. This is clear structure.
If BTC stabilizes near 114,921+, ETH could enter outperformance mode and gain serious traction on the ETH/BTC chart.
📢 Keep your eyes on narrative catalysts:
ETH ETF, L2 growth, and Vitalik waking up...
We are officially off the resistance — and heading to where few have charted before.
One Love,
The FXPROFESSOR 💙
📌 Long — as long as $2,912 holds. If it fails, you already know what to do.
Disclosure: I am happy to be part of the Trade Nation's Influencer program and receive a monthly fee for using their TradingView charts in my analysis. Awesome broker, where the trader really comes first! 🌟🤝📈

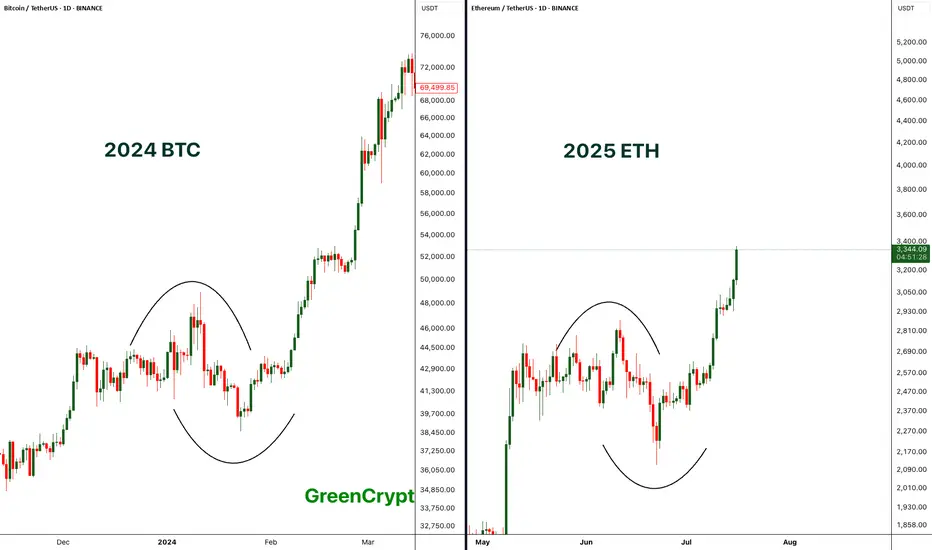
Comparing BTC 2024 with ETH 2025 - Perfect Match- If compare the chart pattern of BTC from 2024 with the current 2025 ETH pattern, wee see exactly similar chart patterns being formed here.
- Price started consolidating then it had fake breakout towards both the sides and finally the real breakout.
- BTC breakout push the price towards the new all time high above 69K, if we ETH follows similar trend then we can expect new all time high on ETH.
Let's see how it plays out.
Stay tuned for more updates.
Cheers
GreenCrypto
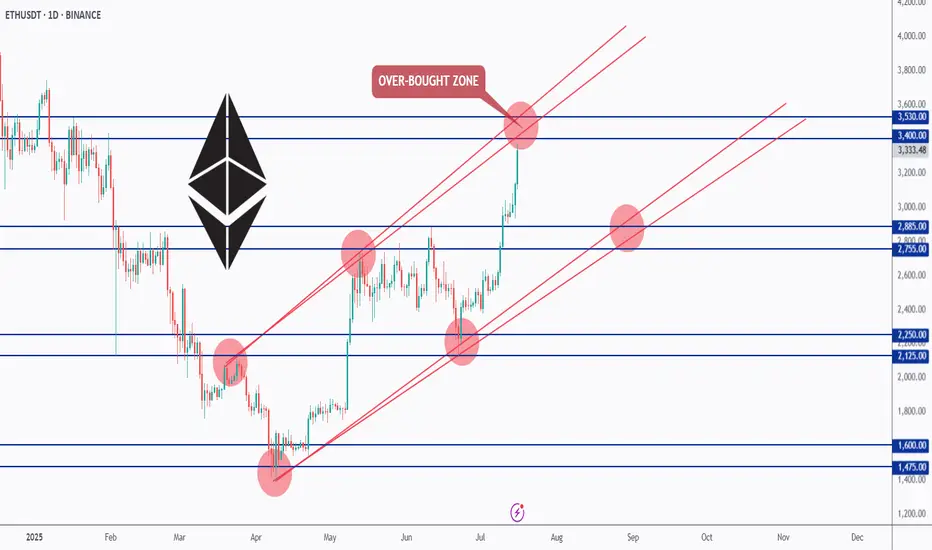
ETH Testing Overbought Zone — What’s Next?📊ETH has been overall bullish, trading inside this rising red channel for months.
After breaking above the $2,885 resistance, bulls took full control, and price is now approaching the upper red trendline — an overbought zone where we’ve seen rejections before.
As long as ETH holds above the $2,885 zone, the bulls remain in control. But since we’re near a strong resistance and the top of the channel, we’ll be waiting for a potential correction or at least a slowdown in momentum before looking for fresh entries.
📌 Key levels to watch:
Resistance: $3,400 – $3,530
Support: $2,885 – $2,755
Let’s stay patient and follow the market’s lead. 🧠
Let me know your thoughts in the comments 👇
📚 Always follow your trading plan regarding entry, risk management, and trade management.
Good luck!
All Strategies Are Good; If Managed Properly!
~Richard Nasr