Ethereum Breakout and Liquidations – A Lesson in Bear Traps and 📚💥 Ethereum Breakout and Liquidations – A Lesson in Bear Traps and Risk Management 🧠📈
Today, July 16th, Ethereum gave us a real-time masterclass in market psychology and risk management.
Let’s start with the facts:
📊 Liquidation Data
🔻 $36.34M in long liquidations
🔺 $86.02M in short liquidations
💣 Total ETH liquidations: $122.36M (data mentioned on video might differ, i made a small mistake)
🌐 Across crypto: $351M liquidated (more shorts than longs)
This imbalance tells us one thing: a bear trap played out, and it played out hard.
🧠 Educational Takeaways
1. Bear Traps Are Real — and Expensive
A bear trap occurs when the market appears bearish, drawing in short sellers — only to violently reverse upward. Today’s Ethereum move was a textbook example. If you’ve been following my analysis, we discussed the regression lines, divergences, and structure that all warned against going short at support.
2. Open Interest and Sentiment Signals
Open interest has been declining — which means fewer speculative positions. That often creates space for a real, organic move, not one fueled by overleveraged noise.
3. Spot vs. Leverage – Risk Control First
Leverage isn’t the enemy — unmanaged leverage is. I personally use a dedicated high-risk account to trade fast setups. This keeps my core capital untouched and my psychology stable.
✅ Risk is defined before the trade.
✅ Entries are structured like bullets — small, multiple attempts.
4. The Mental Game is the Real Game
Trading isn’t just technical. It’s deeply psychological. Whether you’re trading Ethereum, Bitcoin, or altcoins like AVAX and XRP, emotions must be managed before capital is deployed.
5. Like-Minded Community = Sharper Edge
My best trades and insights often come from conversations with trusted, sharp minds in this space. Surrounding yourself with serious traders can be the difference between evolving — and evaporating. To my brother Vlatko (met on Tradingview, been hanging around online ever since, met in person once, now a true friend that we frequently disagree but always agree to respect and empower each other = The power of our community here on TV!)
Final Word:
When markets move fast, lessons appear even faster.
Study the traps. Respect the levels. Structure your risk.
And above all: trade with a plan that allows joy.
One Love,
The FXPROFESSOR 💙
Disclosure: I am happy to be part of the Trade Nation's Influencer program and receive a monthly fee for using their TradingView charts in my analysis. Awesome broker, where the trader really comes first! 🌟🤝📈
Ethereum (Cryptocurrency)

Ethereum LFGFractal from beginning of last cycles bull market. Estimated target $20K by November/December 2025. Significant pull-back around physiological level of $10K in autumn.

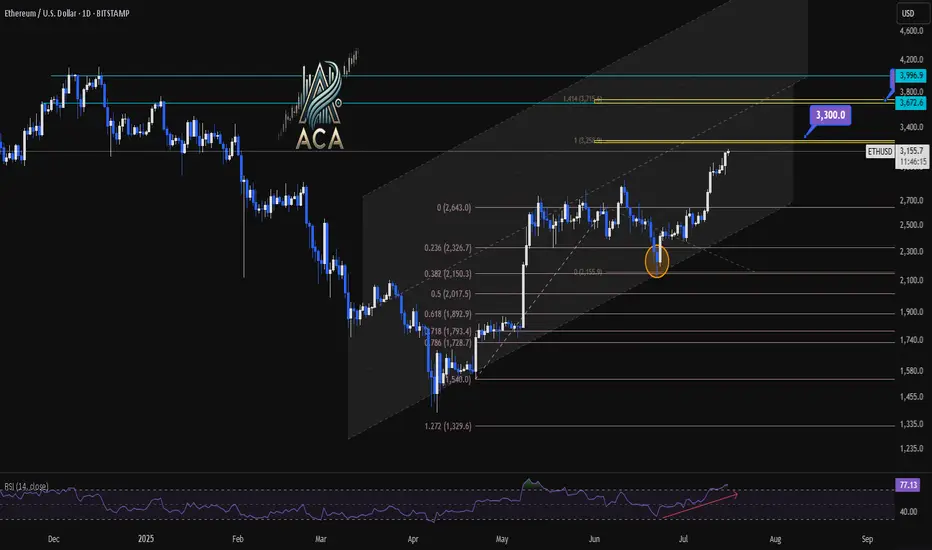
ETHUSDT 1D Chart Analysis | RSI Strength & Fibonacci TargetsETHUSDT 4H Chart Analysis | RSI Strength & Fibonacci Targets in Play
🔍 Let’s break down the latest ETH/USDT setup — bullish momentum is building with confluences pointing toward key upside targets.
⏳ 4-Hour Overview
Ether continues climbing within a well-defined ascending channel, with recent candles holding above mid-level support. Price is pressing higher from a clean bounce at the 0.5 and 0.618 Fibonacci retracement zone ($2,017–$1,899), signaling the correction has likely ended.
📉 Fibonacci Levels & RSI Confirmation
- The strong recovery aligns with rising volume and a bullish structure.
- RSI is pushing into overbought territory (above 73), often a sign of strength during trends—not exhaustion.
- ETH is now positioned for a breakout continuation move if momentum holds.
🎯 Bullish Targets Ahead
- Immediate resistance: $3,300 (1.414 Fib extension + historical supply)
- Next major target: $3,700 (1.618 extension + upper channel confluence)
- Pullback zones: $2,950 (mid-channel) and $2,017 (Fib support base)
📊 Key Highlights:
- Price is respecting the rising channel structure — higher lows, higher highs in play.
- Volume supports the breakout narrative, rising on green candles.
- RSI breakout supports trend continuation, not exhaustion.
- Targets at $3,300 and $3,700 remain actionable on a confirmed breakout.
🚨 Conclusion:
ETH is showing a multi-variable bullish setup with clear continuation potential. A strong move above $3,300 could quickly send price toward $3,700. Pullbacks to $2,950–$2,017 could offer high-risk/reward re-entry zones. Momentum favors bulls — stay alert.
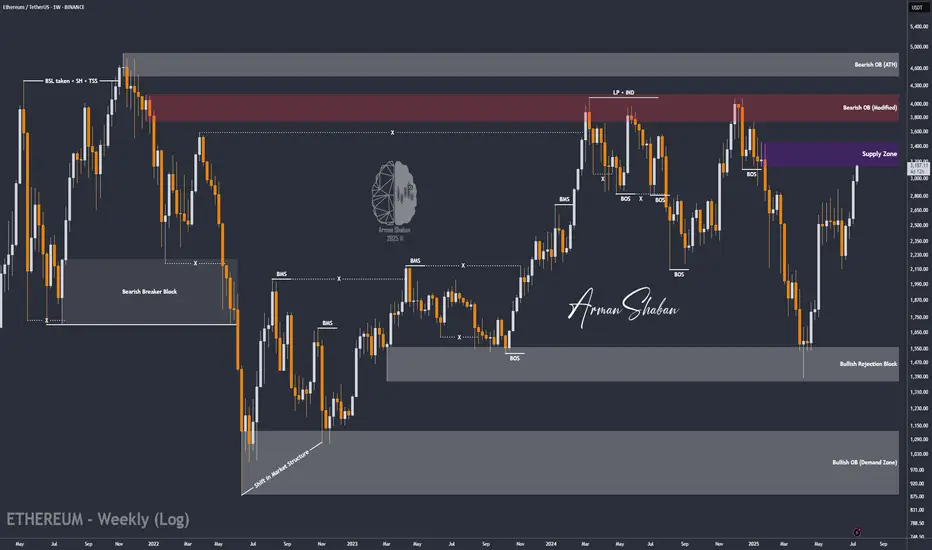
ETH/USDT : $3000 Reached, It's time foe $4000? (READ)By analyzing the Ethereum chart on the weekly timeframe, we can see that the price has finally broken the strong $2700 resistance and pushed toward the next target at $3000! Currently trading around $3150 and now within the $3130–$3440 zone, I expect a short-term rejection from this area. However, given the overall market trend, this level may not hold for long, and we could soon see a breakout toward the next targets at $3500, $3740, $4100, and $4470!
Please support me with your likes and comments to motivate me to share more analysis with you and share your opinion about the possible trend of this chart with me !
Best Regards , Arman Shaban
THE LATEST ANALYSIS :
ETH to $4K ? Whales Accumulate as ETFs Break Records🕞 Timeframe: 4H
.
🟢 Bias: Bullish
1. 🧭 Fundamental Overview:
📈 Massive Institutional Inflows:
Ethereum ETFs have recorded over $1.2 billion in net inflows this July, with $908M just in the week ending July 11. This strong demand from institutional players (notably through ETHA and Bitwise) has pushed ETF AUM above $13.5 billion.
🏢 Corporate Accumulation:
Companies such as SharpLink Gaming have begun adding ETH to their balance sheets. SharpLink's 10,000 ETH (~$49M) purchase highlights growing corporate adoption of Ethereum as a store of value and strategic reserve.
🛠️ Ecosystem Resilience:
Ethereum continues to lead in network upgrades (e.g., Dencun), institutional DeFi, and tokenized assets—strengthening the long-term fundamentals of the chain.
2. 🧠 Sentiment & On‑Chain Metrics
🏦 Institutional Sentiment:
Ethereum ETFs have seen 12 straight weeks of inflows, outperforming Bitcoin in institutional allocation growth (ETH: 1.6%, BTC: 0.8%).
🐋 Whale Activity & Exchange Flows:
Declining ETH balances on exchanges suggest accumulation and reduced sell pressure. Whales and smart money are taking positions.
📊 Public Sentiment:
Bullish expectations remain strong amid price consolidation above key levels and positive ETF momentum.
3. 🔼 Key Levels:
Support: $2,770 and $2,500 (major trendline and psychological level).
4.🎯 Price Targets:
Short‑term (2–4 weeks):
If ETH breaks above $3,150: next targets at $3,400 and $3,750.
Medium‑term (by end of Q3 2025):
ETH could reach $3,500 with potential upside to $4,000.
.
.
.
⚠️ Disclaimer: This analysis is for educational purposes and not financial advice. Please do your own research and risk management.
.
✅ If you like this analysis, don't forget to like 👍, follow 🧠, and share your thoughts below 💬!

[UPD] BTC / ETH / XRP / SOL / HYPE and other alt and mem-coins A new video update with insights on the intermediate trend structure with key support and resistance zones to keep on radar in the coming sessions
Coins discussed in the video: CRYPTOCAP:BTC / CRYPTOCAP:ETH / CRYPTOCAP:XRP / GETTEX:HYPE / CRYPTOCAP:SOL / CRYPTOCAP:LINK / CRYPTOCAP:SUI / $BRETT / SEED_DONKEYDAN_MARKET_CAP:FLOKI and others
Hope this is helpful in guiding you through the crypto market. Thank you for your attention and I wish you successful trading decisions!
If you’d like to hear my take on any other coin you’re tracking - feel free to ask in the comments (just don’t forget to boost the idea first 😉).

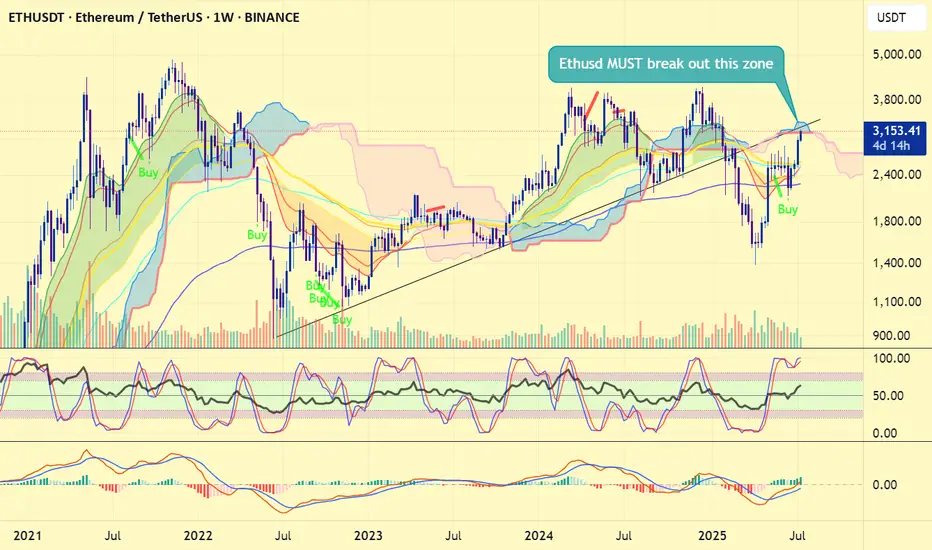
Ethereum price is critical now#ethereum #eth price is now testing very very important resistance zone now and this also the bearish retest if #ethusd fails to leap over 3500 usd. 4 months ago, #ethusdt breakdown the 3 years of trendline, heavily dumped below 1400 usd and bounced. Now, CRYPTOCAP:ETH is testing this 3 years of trendline resistance zone + weekly ichimoku cloud.
Therefore ETH price has no other chance to at least reclaim 3450 - 3500 usd. True bullrun requires a new ATH. Heavy declination at current zone will not be tasty. This week' s close will determine the things i think.
Not financial advice.
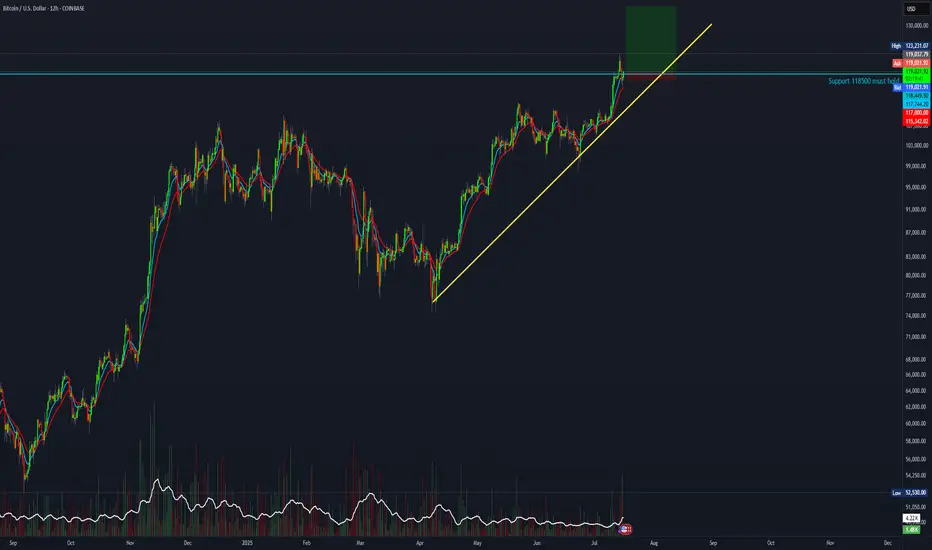
7:1 R:R setup for BTCIt looks like BTC has completed its pullback and is now continuing its uptrend. This trade setup offers a 7:1 R:R with a target of 135K
Entry: 118,900
Stop Loss: 117,000
Target: 135,000
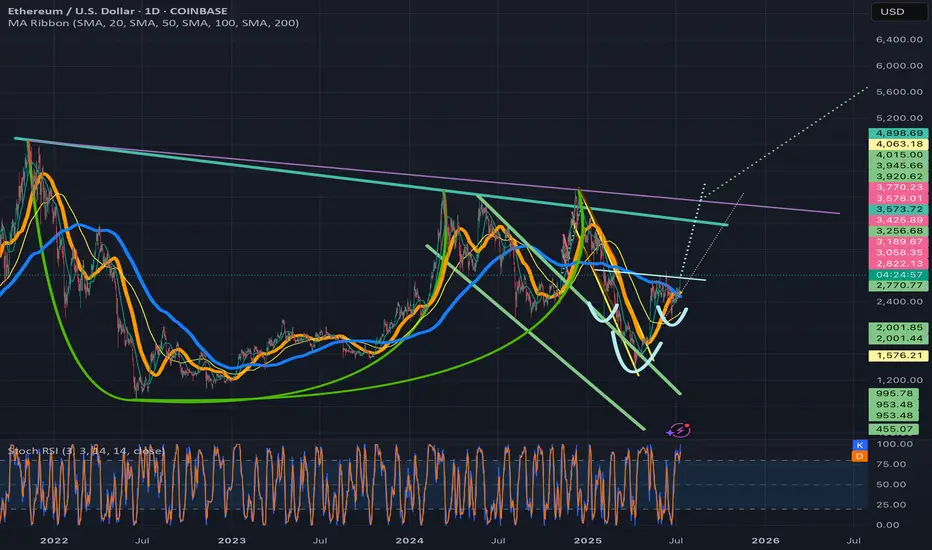
Ethusd breaking above invh&sEthusd chart has a similar set upas the total2 chart, a cup and handle that is breaking up from a smaller inverse head and shoulders that will complete the handle to the cup. Ethereum actually has two potential to trendlines for its cup and handle and I wouldn’t be surprised if both are valid. The breakout target for the inverse head and shoulder pattern will take price action above both of them. Once we solidify the top trendline for the cup and handle patterns as support the breakout target for it is $7161. Ethereum just recently had a golden cross on the daily which adds to the probability the inverse head and shoulder pattern breakout will be validated. *not financial advice*
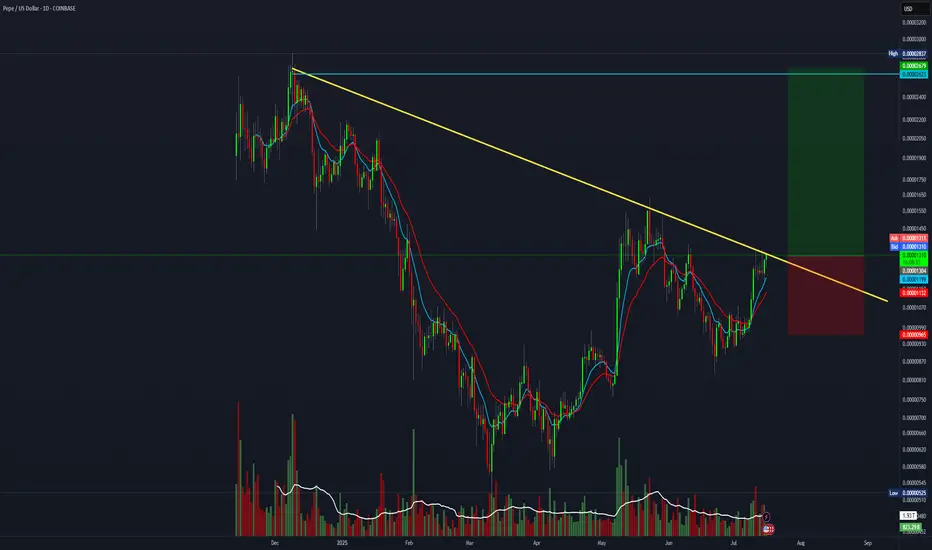
4:1 R:R trade setup for PEPEAre you a fan of memes? This trade setup offers a 4:1 R:R
Entry: 0.00001308
Stop Loss: 0.000009649
Target: 0.00002679
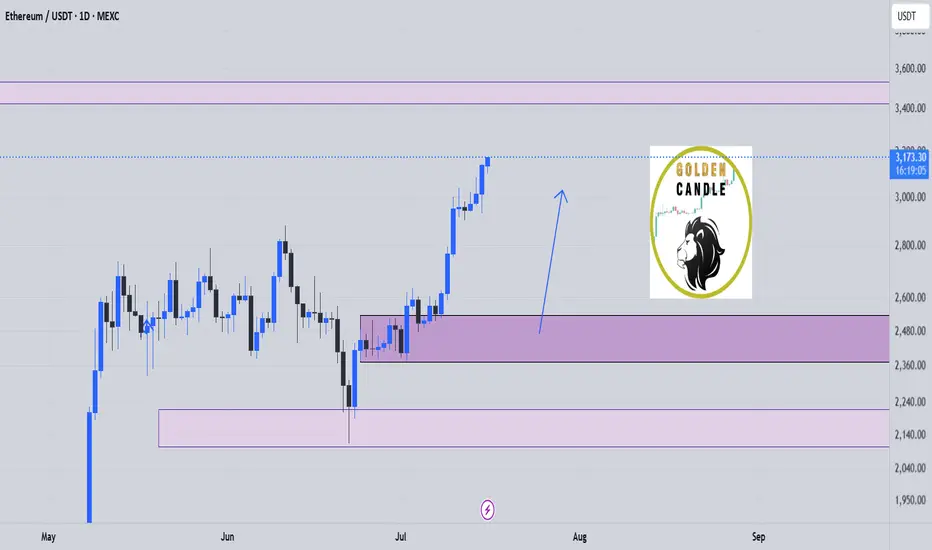
eth buy longterm"🌟 Welcome to Golden Candle! 🌟
We're a team of 📈 passionate traders 📉 who love sharing our 🔍 technical analysis insights 🔎 with the TradingView community. 🌎
Our goal is to provide 💡 valuable perspectives 💡 on market trends and patterns, but 🚫 please note that our analyses are not intended as buy or sell recommendations. 🚫
Instead, they reflect our own 💭 personal attitudes and thoughts. 💭
Follow along and 📚 learn 📚 from our analyses! 📊💡"
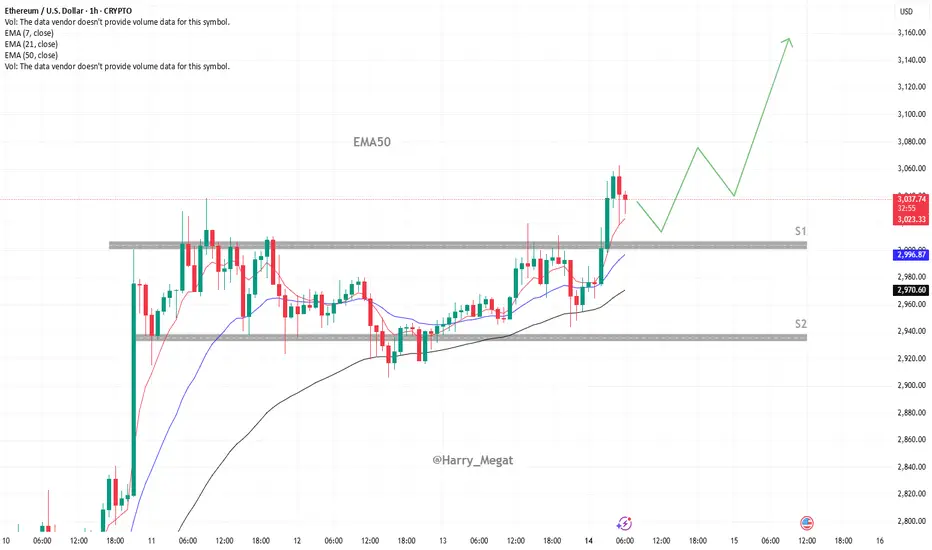
Bullish Outlook for Ethereum (ETH/USD)The chart shows a **bullish outlook for Ethereum (ETH/USD)** on the 1-hour timeframe, suggesting a potential continuation of the uptrend after a recent breakout.
Chart Breakdown:
* **Current Price:** \~\$3,038
* **Key Levels:**
* **S1 (Support 1):** Around \$2,996 — a key breakout and retest level.
* **S2 (Support 2):** Around \$2,945 — secondary support and accumulation zone.
* **EMAs:**
* EMA 7: \$3,023
* EMA 21: \$2,996
* EMA 50: \$2,970
The price is currently above all three EMAs, signaling **short-term bullish momentum**.
Bullish Scenario:
* The price recently **broke out above a strong resistance zone (\~\$2,996)**.
* If ETH successfully **retests and holds S1 as support**, we could see a continuation move toward:
* **\$3,080 → \$3,120 → \$3,160** as short-term targets.
* The green path suggests a **healthy pullback and continuation pattern**, which aligns with bullish market structure.
Invalidation/Bearish Scenario:
* A **break below S1 (\$2,996)** may shift bias toward S2 (\~\$2,945).
* Loss of S2 support could open the door for deeper correction..”
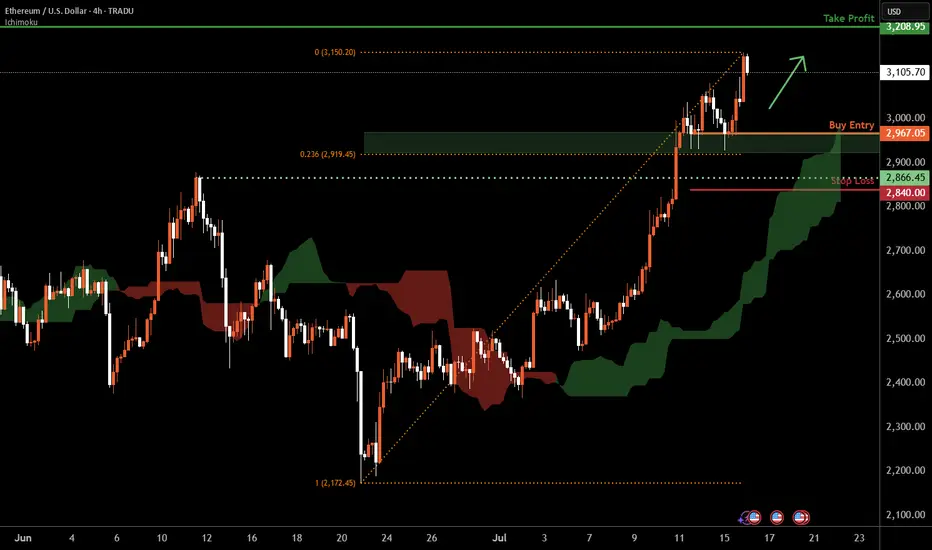
Ethereum H4 | Falling toward a multi-swing-low supportEthereum (ETH/USD) is falling towards a multi-swing-low support and could potentially bounce off this level to climb higher.
Buy entry is at 2,967.05 which is a multi-swing-low support that aligns closely with the 23.6% Fibonacci retracement.
Stop loss is at 2,840.00 which is a level that lies underneath a pullback support.
Take profit is at 3,208.95 which is an overlap resistance.
High Risk Investment Warning
Trading Forex/CFDs on margin carries a high level of risk and may not be suitable for all investors. Leverage can work against you.
Stratos Markets Limited (tradu.com ):
CFDs are complex instruments and come with a high risk of losing money rapidly due to leverage. 63% of retail investor accounts lose money when trading CFDs with this provider. You should consider whether you understand how CFDs work and whether you can afford to take the high risk of losing your money.
Stratos Europe Ltd (tradu.com ):
CFDs are complex instruments and come with a high risk of losing money rapidly due to leverage. 63% of retail investor accounts lose money when trading CFDs with this provider. You should consider whether you understand how CFDs work and whether you can afford to take the high risk of losing your money.
Stratos Global LLC (tradu.com ):
Losses can exceed deposits.
Please be advised that the information presented on TradingView is provided to Tradu (‘Company’, ‘we’) by a third-party provider (‘TFA Global Pte Ltd’). Please be reminded that you are solely responsible for the trading decisions on your account. There is a very high degree of risk involved in trading. Any information and/or content is intended entirely for research, educational and informational purposes only and does not constitute investment or consultation advice or investment strategy. The information is not tailored to the investment needs of any specific person and therefore does not involve a consideration of any of the investment objectives, financial situation or needs of any viewer that may receive it. Kindly also note that past performance is not a reliable indicator of future results. Actual results may differ materially from those anticipated in forward-looking or past performance statements. We assume no liability as to the accuracy or completeness of any of the information and/or content provided herein and the Company cannot be held responsible for any omission, mistake nor for any loss or damage including without limitation to any loss of profit which may arise from reliance on any information supplied by TFA Global Pte Ltd.
The speaker(s) is neither an employee, agent nor representative of Tradu and is therefore acting independently. The opinions given are their own, constitute general market commentary, and do not constitute the opinion or advice of Tradu or any form of personal or investment advice. Tradu neither endorses nor guarantees offerings of third-party speakers, nor is Tradu responsible for the content, veracity or opinions of third-party speakers, presenters or participants.
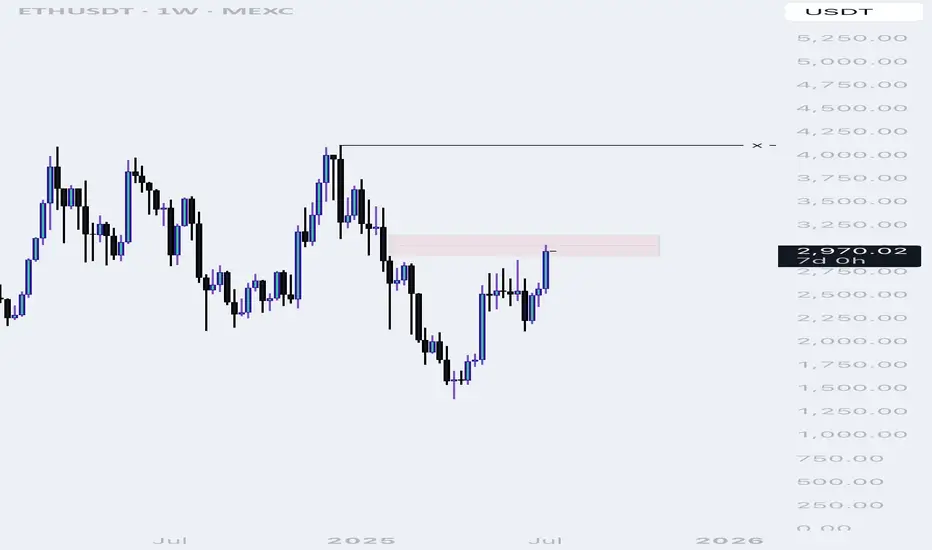
ETH CUP & HANDLE BOWith the cup‑and‑handle pattern that started in February 2025 now pierced above $2,800, the measured move targets the next ceiling around $4,000.

$ETH IS GOING TO MAKE ATHsBitcoin amd Etheureum will continue to rise until Ethereum clears these highs. The market is not done yet.
Although, I expect Bitcoin to retrace and consolidate more, i expect more bullish scenario’s than Bearish.
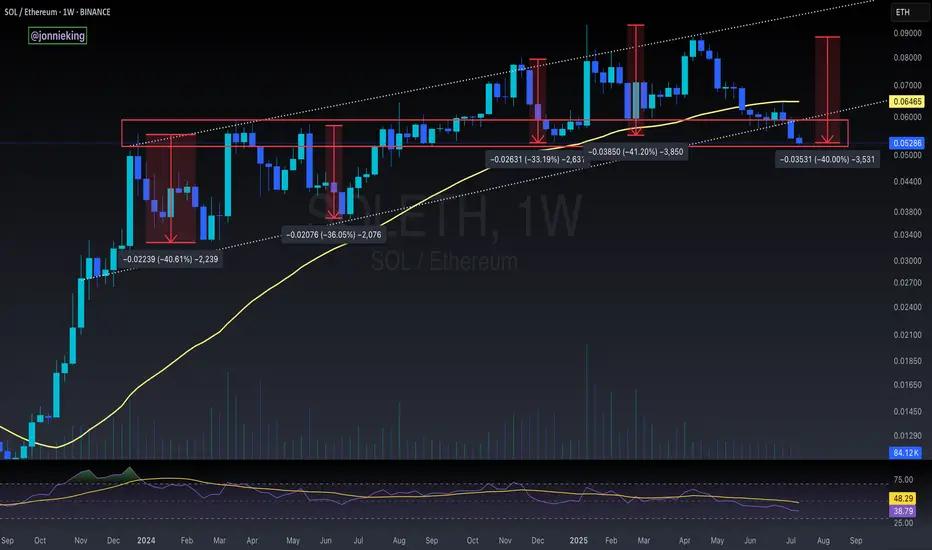
SOL / ETH at Critical Inflection PointSOL / ETH loses the 50WMA.
Has been trading below it for the past 7 weeks, something we haven't seen since 2021.
Has also broken down from the 8 month bull flag / parallel channel. Retesting the key POI I've been eyeing.
HOPIUM: We've seen great rallies after CRYPTOCAP:SOL goes down ~40% vs CRYPTOCAP:ETH , which it is at now. We SHOULD see a turnaround here soon.
And I still believe SOL will greatly outperform ETH this cycle, especially when the ETF launches and Alt Season kickstarts.
Right now we're seeing a typical market cycle BTC > ETH > Large Caps > Mid Caps > Micro Caps
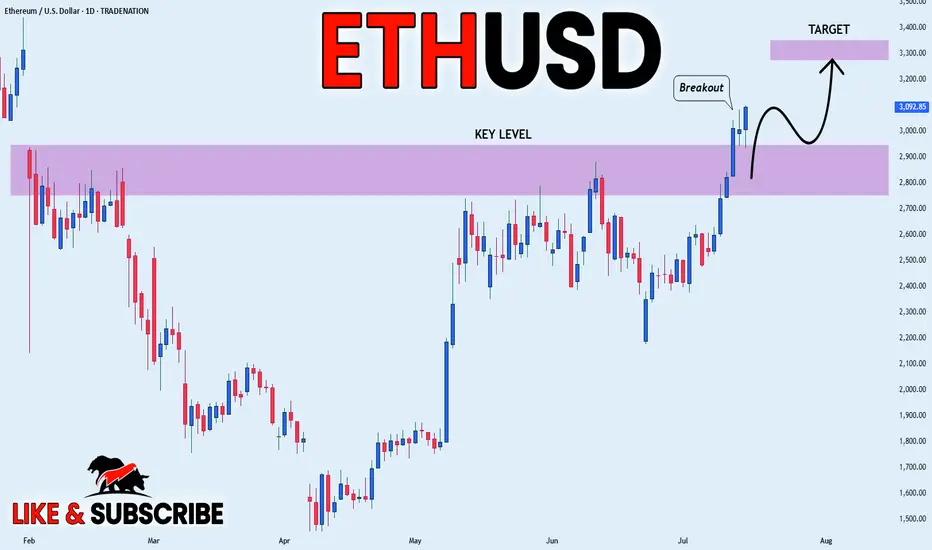
ETHEREUM WILL KEEP GROWING|LONG|
✅ETHEREUM is going up
Now and the coin made a bullish
Breakout of the key horizontal
Level of 3000$ and the breakout
Is confirmed so we are bullish
Biased and we will be expecting
A further bullish move up
LONG🚀
✅Like and subscribe to never miss a new idea!✅
Disclosure: I am part of Trade Nation's Influencer program and receive a monthly fee for using their TradingView charts in my analysis.
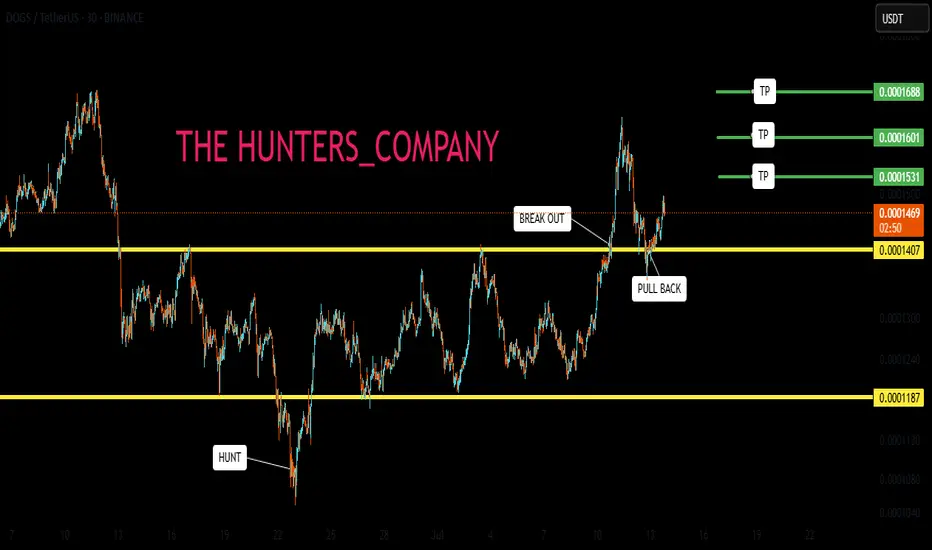
DOGS BUY !!!Hello friends🙌
📉Regarding the price drop, you can see that the price has been suffering for a while and even the resistance has broken, which is not a valid failure (80% of failures are fake in the range)
📈Now, with the successful failure we had and the moneyback that the price has made, we can expect the price to move to the specified targets. Note that for trading, be sure to observe capital management.
🔥Follow us for more signals🔥
*Trade safely with us*
BITCOIN UPDATEHello friends🙌
📈Given the upward trend we had, you can see that the price is in an upward channel and has also formed a bullish pattern, which, given the strength behind the trend, seems to have higher targets.
🔊Be careful, the basic principle of trading is capital management, so be sure to follow capital management.
🔥Join us for more signals🔥
*Trade safely with us*

Ethereum:Daily signalhello guys👋
According to the drop we had, you can see that buyers came in and the price had a good growth, and after that a trading range was made in which the price got stuck.
Now, considering that the price is in the trading range and it seems that the buyers have shown their support, it is possible to step into the specified support areas with risk and capital management and move up to the set goals.
🔥Follow us for more signals🔥
*Trade safely with us*
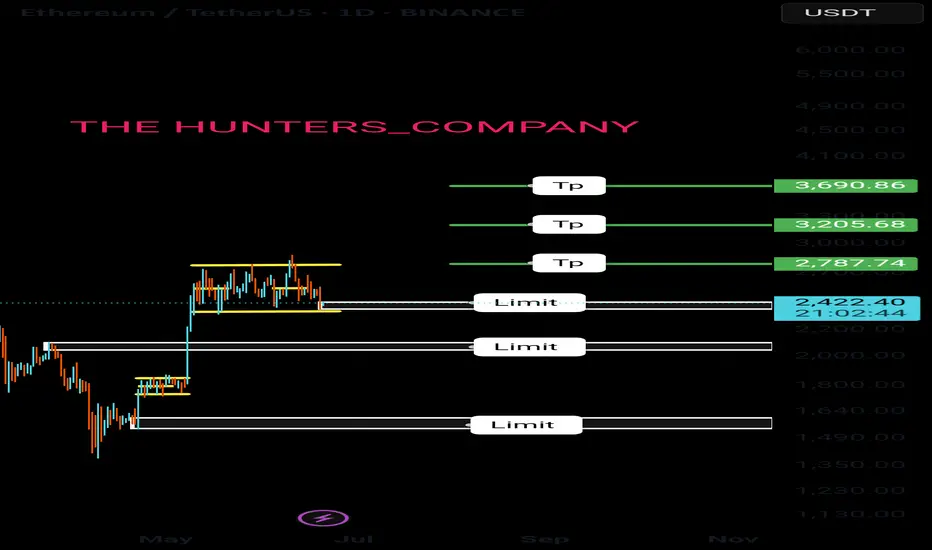
When does Bolran start?Read carefullyhello friends👋
💰Many of you are asking when Bolran will start or if it will start at all, we decided to explain it to you in a full post.
Well, you can see the Ethereum chart moving in a channel, and with a drop, it created a big fear that a fall is coming, and meanwhile, the buyers returned the price to above 2000 dollars with a strong and unexpected return.
✅️Now the price is stuck in the specified box between 2200 and 2500, and if this range is maintained, the price will easily move up to the range of 3200 in the first wave, and if it fails to maintain this range, the price will fall below 1500 dollars.
🧐Now, in our opinion, due to the rapid return of the price from the channel, this failure is a fake channel and the range will be maintained, and we are likely to see Ethereum rise in the coming weeks.
🤔You know that Ethereum is the leader of altcoins, and if it grows, important altcoins will grow, which is the beginning of Bolran, and there are important altcoins that can be used for good profit.
🌟You can join us if you like.🌟
🔥Follow us for more signals🔥
*Trade safely with us*

HolderStat┆ETHUSD prepare for a breakthroughBINANCE:ETHUSDT is trending upward with strong conviction after triangle breakouts and clearing the $2,900 level. Structure points toward a move into the $3,300–$3,400 region. The trend is reinforced by repeated bullish retests and channel momentum.

#ETH Update #3 – July 15, 2025#ETH Update #3 – July 15, 2025
After its recent impulsive move, Ethereum appeared to make a slight correction. However, this correction did not complete and instead formed a second peak. Since a full correction hasn't played out yet, caution is still warranted when trading Ethereum.
The first correction level is around $2,850, the second around $2,780, and the third around $2,700. If Ethereum pulls back to the second correction level, it will balance out the second imbalance zone created during the last impulse, which could allow for a healthier continuation upward.
As long as Ethereum doesn't break down below the $2,900 zone, I do not expect a correction. But if it does break below $2,900, corrections are likely to occur one after another.
At this point, neither a long nor a short position seems suitable for Ethereum.
