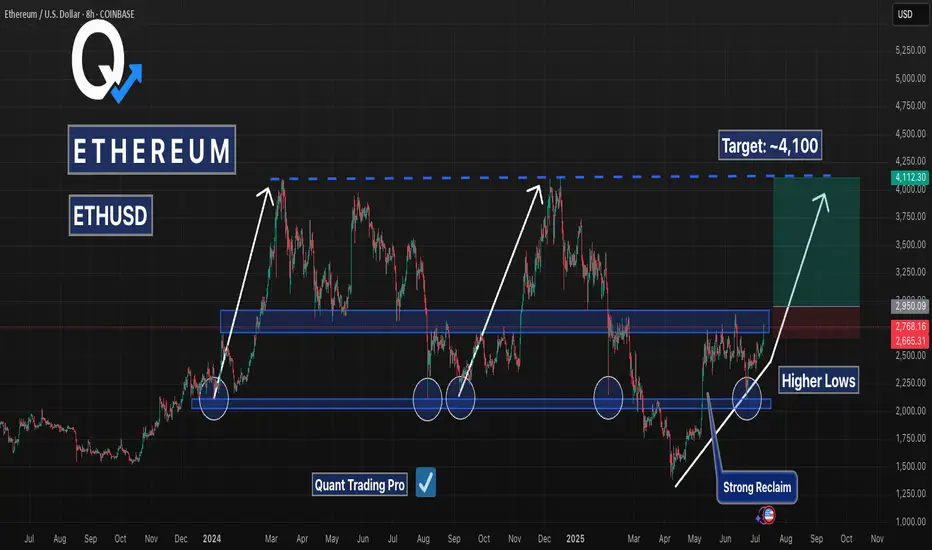
Ethereum Breakout Brewing: Higher Lows Point to $4,100Ethereum is showing signs of a major breakout setup on the 8H chart. The historical price action reveals a well-defined horizontal range, with ETH respecting the $2,200–$2,950 demand zone multiple times.
Key highlights:
🔹 Strong Reclaim: Price reclaimed the key range low around $2,300 with momentum.
🔹 Higher Lows Forming: Each bounce from support has built more bullish structure.
🔹 Targeting Range High Breakout: ETH has launched toward ~$4,100 after each reclaim.
🔹 Current Resistance: $2,950 remains the final barrier before blue sky.
If ETH can break and hold above that zone, historical structure suggests a move toward $4,100+ is well within reach.
Ethereum (Cryptocurrency)
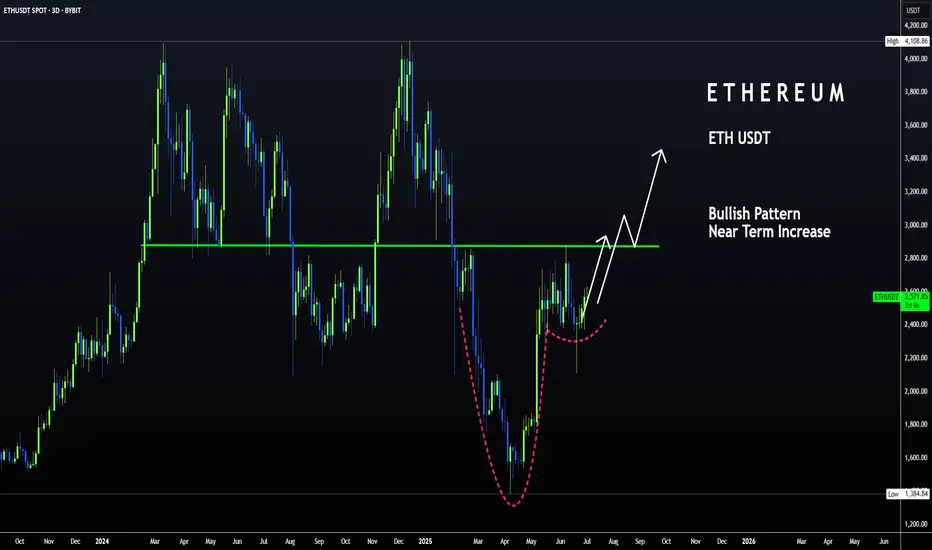
ETH | Bullish Pattern - Cup and Handle +15%A Bullish pattern is appearing on the Ethereum chart.
From a Cup and Handle pattern, we can easily expect atleast a 15% increase. This is true for the near term. A +15% would put us here:
Just under $3K we may see heavy resistance. This is also the neckline resistance, as it was the previous support for the breakout that ultimately led to a new ETH ATH.
_______________________________
BYBIT:ETHUSDT
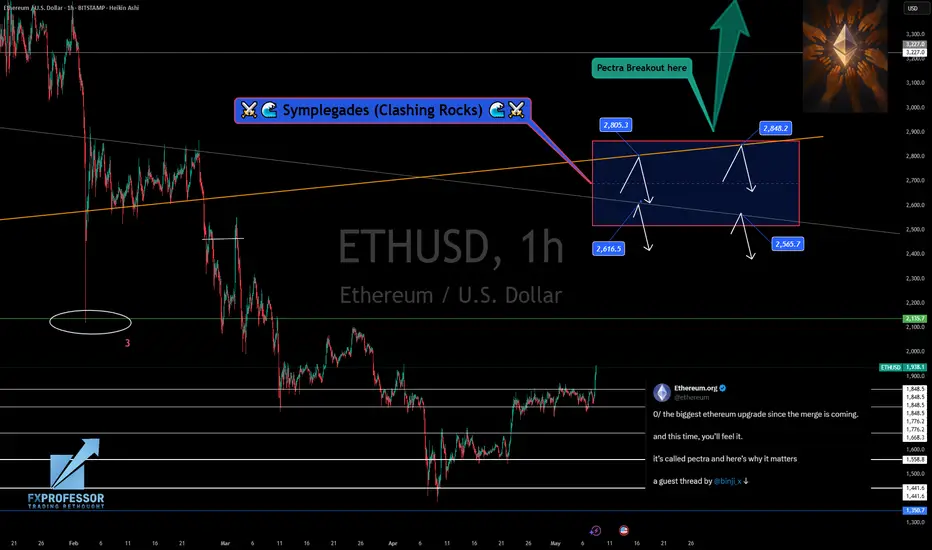
Ethereum Faces the 'Symplegades'– Will Pectra Propel It Through?Ethereum Faces the 'Symplegades' – Will Pectra Propel It Through?
⚔️🪨 Ethereum Faces the 'Symplegades' – Will Pectra Propel It Through? 🪨⚔️
In ancient Greek myth, the Symplegades — Clashing Rocks — tested Jason and the Argonauts with a narrow, deadly passage. Today, Ethereum faces its own mythic trial as price action presses into a critical zone.
📍 The $2,805–$2,848 resistance zone is acting like the Clashing Rocks — volatile, dangerous, and decisive. Beneath it, support rests near $2,616 and $2,565 . A breakout from this trap can open the way to $3,200+ , but rejection may mean another violent plunge. ⚠️
🔧 Enter: PECTRA – Ethereum’s Game-Changing Upgrade
Ethereum’s most ambitious upgrade since The Merge is nearly here. PECTRA isn’t just a backend update — it redefines how the network feels and functions:
🧠 Smarter Wallets
– Batch transactions
– Skip approval popups
– Pay gas in any token
⚡ Frictionless UX
– Fewer clicks
– No more endless “approve + confirm” loops
📉 Cheaper Transactions
– More blobs = better L2 scaling
– Lower fees, even during congestion
🌱 Staking Overhaul
– Validator cap raised to 2048 ETH
– Smart contract withdrawals
– Faster deposit recognition
🔓 Unlocking $490B in trapped value
– Assets become more accessible and usable
“The Merge changed how Ethereum works.
Pectra changes how it feels. ” – @ethereum
⛵ Will ETH Break Through the Clashing Rocks?
This is not just another consolidation box.
It’s a moment of mythic symmetry — where price action, fundamentals, and network transformation converge.
Sail through the Symplegades... or get crushed between them?
Stay sharp. Watch the breakout. The next move will be defining.
One Love,
The FXPROFESSOR 💙
Ethereum / U.S. Dollar 4-Hour Chart (BINANCE)4-hour candlestick chart displays the price movement of Ethereum (ETH) against the U.S. Dollar (USD) on the BINANCE exchange. The current price is $2,740.99, reflecting a +$124.74 increase (+4.77%) in the last period. The chart includes a buy/sell indicator with no current activity (0.00), a resistance zone highlighted in pink, and a support zone in light green. The price has recently surged, breaking through the $2,740.99 level, with additional price points ranging from $2,400.00 to $2,949.06 shown on the right axis. The time frame spans from late June to July 10, 2025.

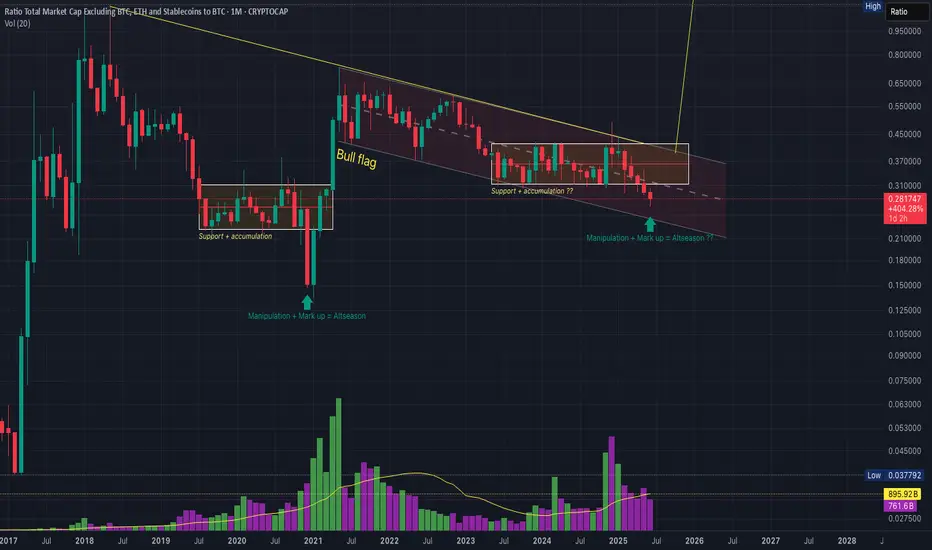
Altseason, just a thought ! Basically, right now we’re chilling in a major confluence zone — a whole bunch of important levels are stacked right here.
We’ve got:
The 0.78 Fib retracement holding it down
Volume profile support giving us a comfy cushion
That good old accumulation support from 2019–2021 saying “welcome back”
…just to name a few.
IMO, we’re in that sneaky “deviation/manipulation” phase before the real markup begins — a.k.a. altseason is warming up in the locker room.
If we actually hit the bull flag target… well, let’s just say the numbers start looking spicy. But hey, let’s not get ahead of ourselves — things can (and probably will) move faster than you think.
Alright, that’s the vibe. Let’s see how it plays out. Good night! 😴🚀
Ethereum (ETH) to U.S. Dollar (USD) 4-Hour Chart - Binance4-hour candlestick chart from Binance displays the price movement of Ethereum (ETH) against the U.S. Dollar (USD) from late June to early July 2025. The current price is $2,608.76, reflecting a +$65.53 (+2.58%) change. The chart includes buy and sell indicators at $2,608.76, with a highlighted resistance zone around $2,700-$2,760 and a support zone around $2,540-$2,600. The chart also shows a recent upward trend with fluctuating volatility.

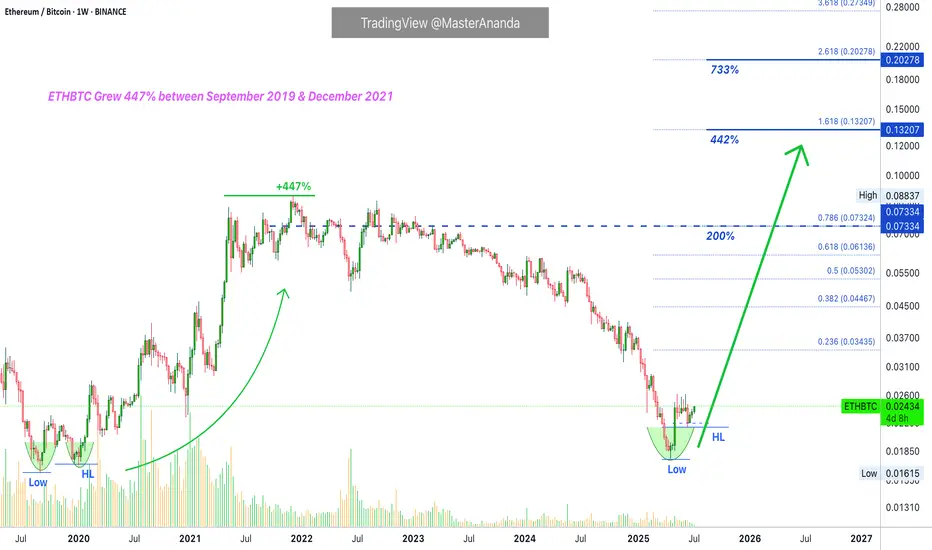
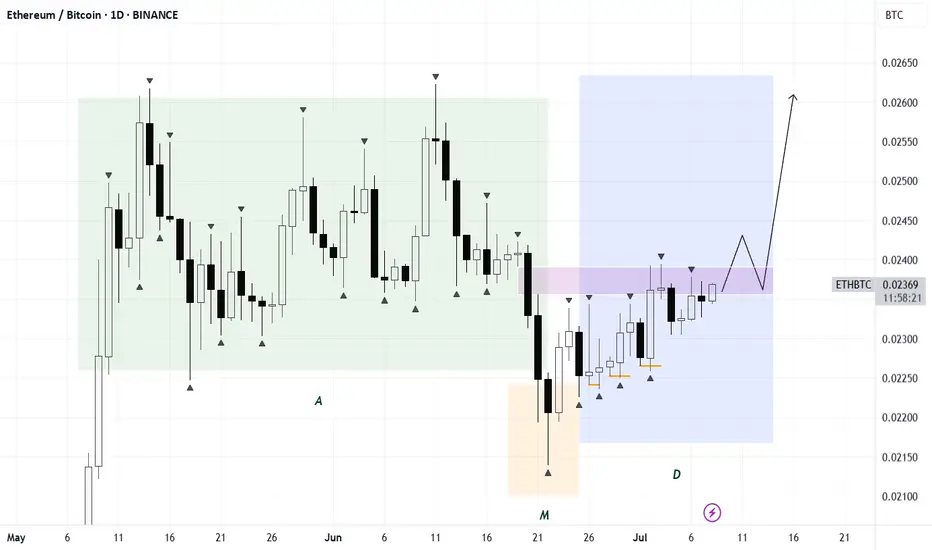
ETHBTC Opportunity Buy: Major 2025 AltcoinSeason & Bull MarketThis is the big one and the good one. ETHBTC was bearish since December 2021 but this cycle finally came to an end in April this year. After the initial bullish breakout and higher low we can clearly see some bullish action developing; three consecutive weeks green. The bullish bias is now confirmed. It is still early.
We are looking at 200% potential. The "back to baseline" target. This is a price range where ETHBTC traded sideways as part of a distribution phase for more than two years. This is a must-to-be-tested resistance zone and thus opens up a sure 200% profits potential for this newly developing bullish wave.
Ethereum's ETFs are coming, Bitcoin already has its ETFs. This can mean Ethereum outperforming Bitcoin, and many altcoins, in so many ways. This also opens up the potential for a new all-time high on this pair.
The same sequence of 'low-higher low' happened in the last bull market. ETHBTC hit bottom in September 2019 then produced a higher low and this signaled the start of a major, long-term 447% rise. The conditions are similar now but the rise will be faster.
We have two main targets for the all-time high in late 2025 or early 2026.
1) 0.13207. With 442% profits potential from current price.
2) 0.20278. With 733% profits potential.
The entire bullish cycle for this pair can unravel within 4-6 months. If it becomes extended, it can last one year or longer. Both scenarios are possible.
It is 100% certain that ETHBTC will go on a major bullish cycle together with the rest of the altcoins market. Bitcoin will also grow.
Thanks a lot for your continued support.
If you are bullish on Crypto, comment below.
Namaste.
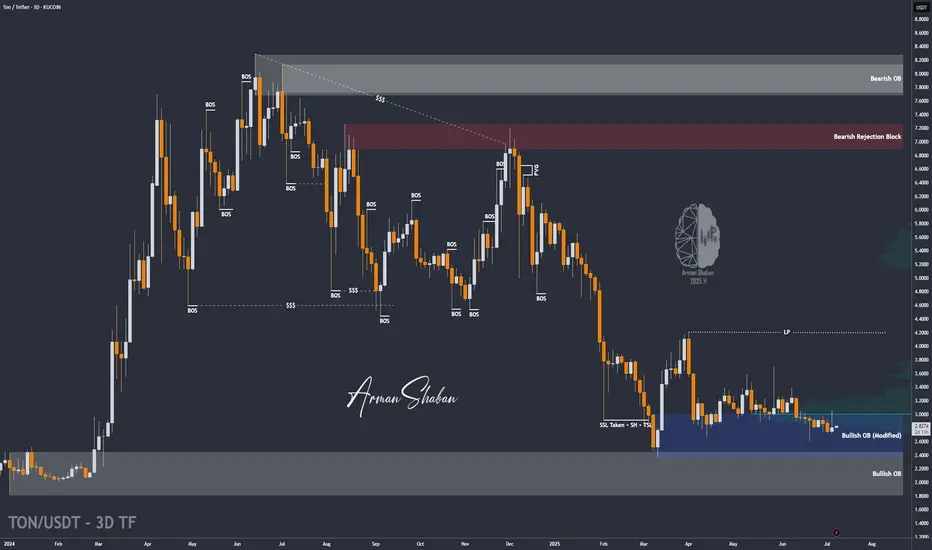
TON/USDT : TON at a Key Breakout Level – Will $3 Hold or Break?By analyzing the TON Coin chart on the 3-day timeframe, we can see that after climbing back to the $3 level, this zone has now turned into a key resistance area. The most important condition for further bullish movement is a strong breakout and confirmation above $3. If that scenario plays out, the next potential upside targets are $3.15, $3.63, $4.20, and $4.68.
⚠️ (A deeper and more detailed analysis is recommended for long-term investment considerations.)
Please support me with your likes and comments to motivate me to share more analysis with you and share your opinion about the possible trend of this chart with me !
Best Regards , Arman Shaban
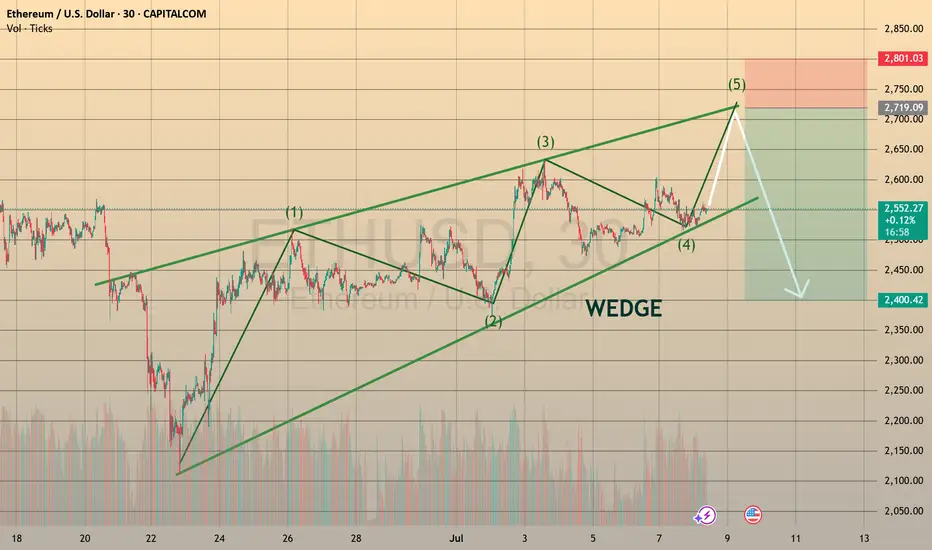
ETHUSD SHAPING THE BEARISH WEDGE, READY TO DECLINE
Ethereum has been forming the bearish wedge since the June 23th. The asset goes precisely according to Elliot 5-waves formation and is currently starting the wave E, rebounding from the lower border of the chart pattern.
What a trader may do?
We may go aggressive and trade long right immedia CAPITALCOM:ETHUSD tely with a take profit slightly below the 2,700.00 resistance level
🔼 a market buy order at 2544.19 with
❌a stop loss at 2489.90 and
🤑a take profit at 2691.35,
risk-reward ratio is 1:2.71 (nice one!)
However, I prefer to stay conservative and wait till the price tests the 2,700.00 level and enter the position there with
🔽 a pending sell stop order at 2691.35 with
❌a stop loss at 2759.92 and
🤑a take profit at 2409.89
risk-reward ratio here will be 1:4.1 (even better!)
In mid-term, I still expect ETHUSD to trade within a 2,400.00-2,700.00 range. So after assets reaches the 2,400.00, could be reasonable to look for new long opportunities! But will see.
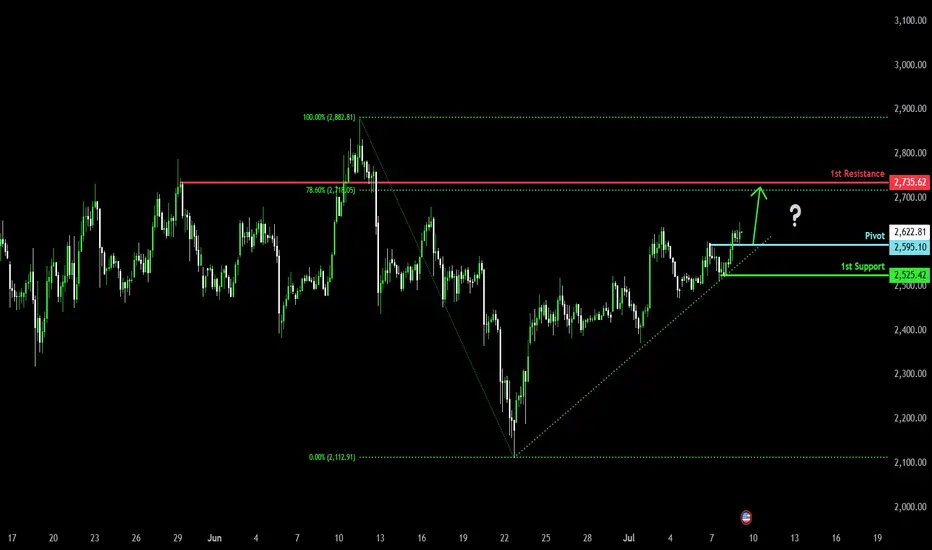
Bullish momentum to extend?Ethereum (ETH/USD) is reacting off the pivot which is a pullback support and could rise to the 78.6% Fibonacci resistance.
Pivot: 2,595.10
1st Support: 2,525.42
1st Resistance: 2,735.62
Risk Warning:
Trading Forex and CFDs carries a high level of risk to your capital and you should only trade with money you can afford to lose. Trading Forex and CFDs may not be suitable for all investors, so please ensure that you fully understand the risks involved and seek independent advice if necessary.
Disclaimer:
The above opinions given constitute general market commentary, and do not constitute the opinion or advice of IC Markets or any form of personal or investment advice.
Any opinions, news, research, analyses, prices, other information, or links to third-party sites contained on this website are provided on an "as-is" basis, are intended only to be informative, is not an advice nor a recommendation, nor research, or a record of our trading prices, or an offer of, or solicitation for a transaction in any financial instrument and thus should not be treated as such. The information provided does not involve any specific investment objectives, financial situation and needs of any specific person who may receive it. Please be aware, that past performance is not a reliable indicator of future performance and/or results. Past Performance or Forward-looking scenarios based upon the reasonable beliefs of the third-party provider are not a guarantee of future performance. Actual results may differ materially from those anticipated in forward-looking or past performance statements. IC Markets makes no representation or warranty and assumes no liability as to the accuracy or completeness of the information provided, nor any loss arising from any investment based on a recommendation, forecast or any information supplied by any third-party.
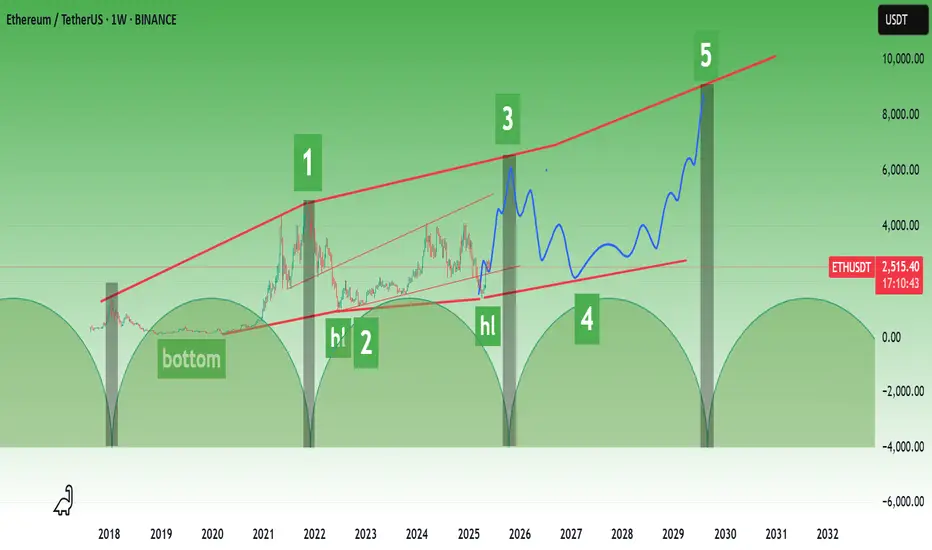
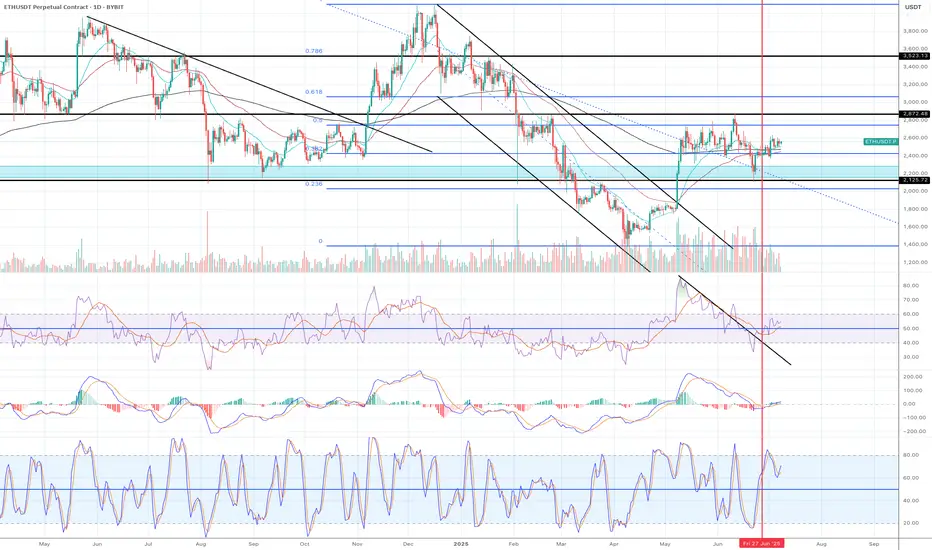
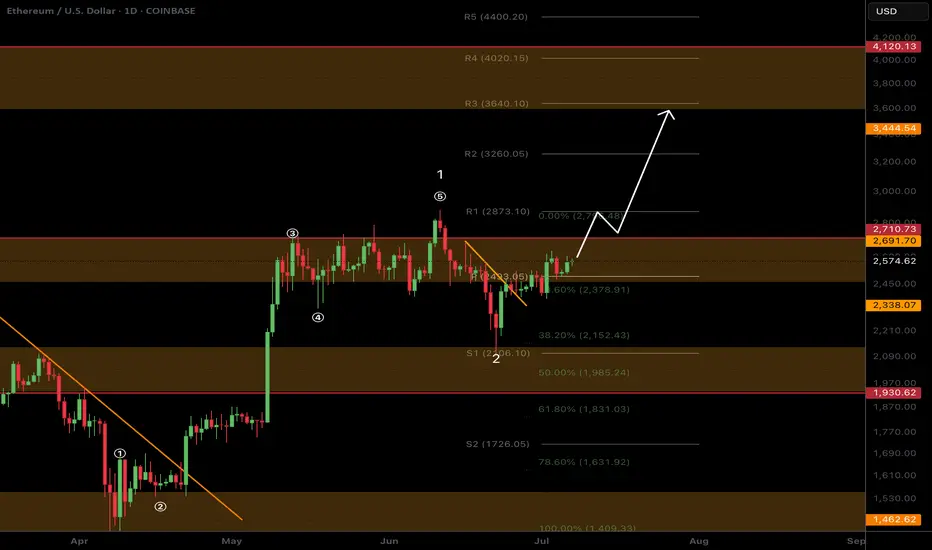
ETHEREUM ROADMAPI tried to predict based on previous time periods and elliot waves.
Please note that my analysis is not short-term. Of course, there may be short-term correction waves in Ethereum.
* The purpose of my graphic drawings is purely educational.
* What i write here is not an investment advice. Please do your own research before investing in any asset.
* Never take my personal opinions as investment advice, you may lose your money.
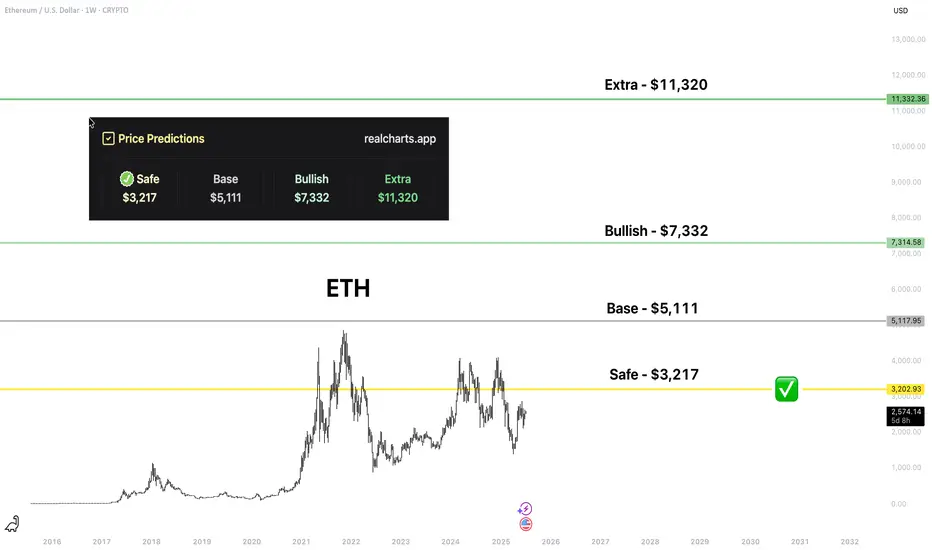
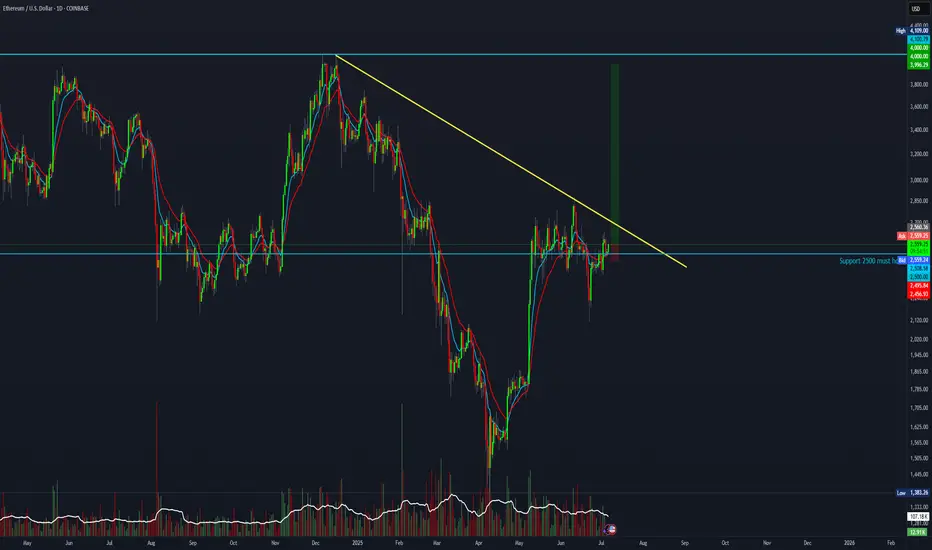
ETH | Price PredictionI believe that COINBASE:ETHUSD is the most important ecosystem for crypto and am bullish on it. The price of many great assets is absolutely dependent on ETH, because those assets have ETH as the key liquidity. I love assets from the ecosystem: OKX:MORPHOUSDT , BINANCE:WLDUSDT , BINANCE:OPUSDT , BINANCE:ARBUSDT , BINANCE:LDOUSDT , $BINANCE:STRKUSDT.
Those levels are from my platform. I believe that up to "Bullish" is really easy to hit this "cycle".
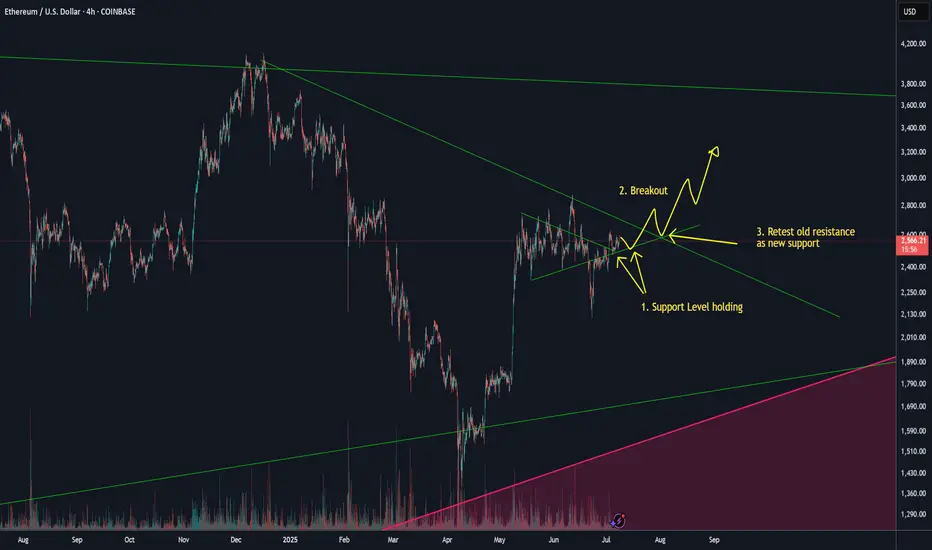
ETH to 3KETH is looking set to challenge the 3k level.
You can see by the small breakout and old resistance acting as new support levels at fig 1 that ETH is building towards a leg up.
Look for ETH to move higher with a small breakout (fig 2), retest (fig 3) before moving higher towards the 3K range.
ETHUSDT Long / Buy SetupMust take from the entry and USE tight SL. Can be a fakeout, if real breakout then tps are mentioned. In case sl hit, use the previous setup, it's still valid. While for short I'm still waiting for 3k or above.

ETH/BTCPrice is following an AMD structure with a liquidity sweep to the downside. For full confirmation of the setup, a daily FVG inversion is required.
Watching closely — confirmation will unlock further directional bias.
Time to go long!!
1) A candle broke out and closed above the descending parallel channel.
2) The price has been consolidating above Fib0.0382 level for weeks.
3) The recent candles are sitting above EMA21.
4) EMA 21 is above EMA55.
5) EMA200 is running horizontally still but it is getting close to cross EMA55.
6) All momentum indicators are in the bull zone and still plenty to go before it hits overbought territory.
There might be a strong breakout to the upside.
It is time to go long.
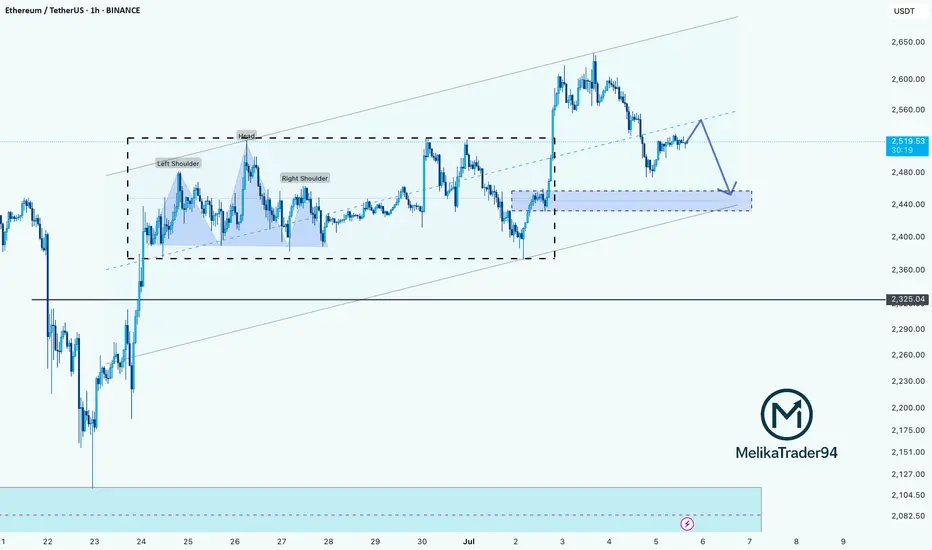
Ethereum Faces Key Resistance: Potential Pullback AheadHello Guys!
What I see:
Head and Shoulders Pattern:
Left Shoulder: Formed
Head: Peak, followed by a drop.
Right Shoulder: Formed.
The neckline break around $2,450 initiated a downside move, confirming the bearish setup.
Current Price Action:
ETH is currently trading near $2,519, attempting to reclaim the broken neckline zone, which now acts as resistance.
The price action is showing lower highs, hinting at weakening bullish momentum.
Bearish Retest in Progress:
The chart shows an anticipated bearish retest of the support-resistance flip zone ($2,530–$2,550), with a probable rejection leading ETH back down toward the $2,440–$2,450 support zone.
Demand Zone:
A strong demand area is visible between $2,420–$2,450. Price may revisit this zone before making the next major move.
Trend Channel:
ETH is moving within an ascending channel, and the lower bound coincides with the highlighted demand zone.
________________________
Let's check this deja vu:
You can see that previously the price formed an H&S and after that did a hunting of the head! And after that price experienced a drop there! Same scenario here!
Ethereum H4 | Potential bearish reversalEthereum (ETH/USD) is rising towards a swing-high resistance and could potentially reverse off this level to drop lower.
Sell entry is at 2,601.80 which is a swing-high resistance.
Stop loss is at 2,700.00 which is a level that sits above a swing-high resistance.
Take profit is at 2,397.10 which is a multi-swing-low support that aligns with a 50% Fibonacci retracement.
High Risk Investment Warning
Trading Forex/CFDs on margin carries a high level of risk and may not be suitable for all investors. Leverage can work against you.
Stratos Markets Limited (tradu.com ):
CFDs are complex instruments and come with a high risk of losing money rapidly due to leverage. 63% of retail investor accounts lose money when trading CFDs with this provider. You should consider whether you understand how CFDs work and whether you can afford to take the high risk of losing your money.
Stratos Europe Ltd (tradu.com ):
CFDs are complex instruments and come with a high risk of losing money rapidly due to leverage. 63% of retail investor accounts lose money when trading CFDs with this provider. You should consider whether you understand how CFDs work and whether you can afford to take the high risk of losing your money.
Stratos Global LLC (tradu.com ):
Losses can exceed deposits.
Please be advised that the information presented on TradingView is provided to Tradu (‘Company’, ‘we’) by a third-party provider (‘TFA Global Pte Ltd’). Please be reminded that you are solely responsible for the trading decisions on your account. There is a very high degree of risk involved in trading. Any information and/or content is intended entirely for research, educational and informational purposes only and does not constitute investment or consultation advice or investment strategy. The information is not tailored to the investment needs of any specific person and therefore does not involve a consideration of any of the investment objectives, financial situation or needs of any viewer that may receive it. Kindly also note that past performance is not a reliable indicator of future results. Actual results may differ materially from those anticipated in forward-looking or past performance statements. We assume no liability as to the accuracy or completeness of any of the information and/or content provided herein and the Company cannot be held responsible for any omission, mistake nor for any loss or damage including without limitation to any loss of profit which may arise from reliance on any information supplied by TFA Global Pte Ltd.
The speaker(s) is neither an employee, agent nor representative of Tradu and is therefore acting independently. The opinions given are their own, constitute general market commentary, and do not constitute the opinion or advice of Tradu or any form of personal or investment advice. Tradu neither endorses nor guarantees offerings of third-party speakers, nor is Tradu responsible for the content, veracity or opinions of third-party speakers, presenters or participants.

Ethereum setup with a 14 R:R.Let’s see if this time marks the beginning of bullish momentum.
This setup offers a 14:1 risk-to-reward ratio
Entry at 2560
Stop loss 2457
Target at 4000.
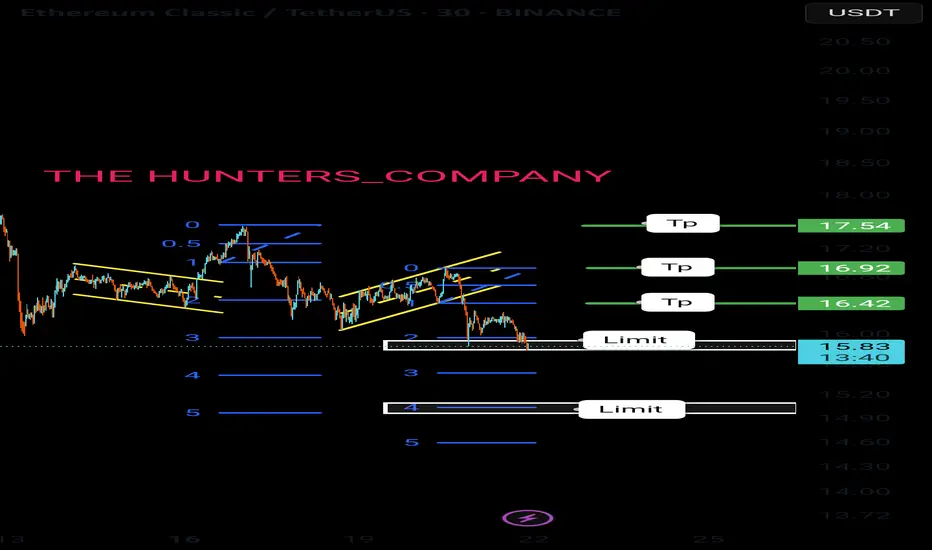
Ethereum Classic:Buying opportunity?hello friends 👋
Considering the price drop we had, you can see that buyers are coming in less and less in the support areas that we specified for you, and this can be a good signal to buy in these areas step by step with capital and risk management and move to the specified goals.
🔥Follow us for more signals🔥
*Trade safely with us*
$ETH Breakout this week?CRYPTOCAP:ETH local chart looks ready
I think were looking at a decent ETH breakout this week to the next resistance High Volume Node at $3600 minimum target.
👉 BTC is consolidating under all time high resistance after multiple tests which is usual a sign of bullish continuation. Usualy giving alts room to room.
👉 Ethereum is above the daily 200EMA, daily pivot and also consolidating under resistance once more after testing the 0.382 Fibonacci retracement and S1 daily pivot adding confluence to that being the local bottom. This appears to be Elliot wave 2, a shallow wave 2 retracement (less than 0.5) is a show of strength and investor impatience.
Analysis invalidated below the daily pivot and daily 200EMA as this will lock in 3 waves up and look corrective.
Safe trading
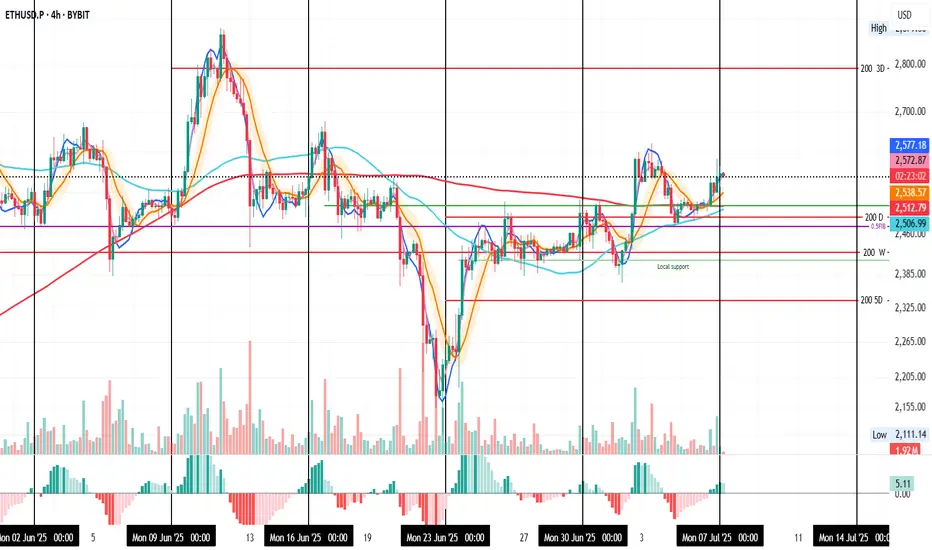
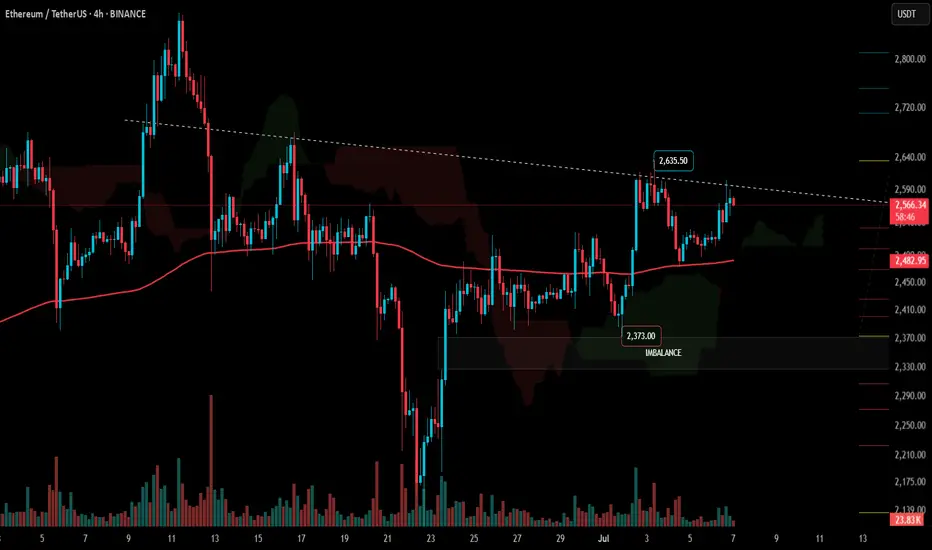
#ETH Update #1 – July 7, 2025🟢 #ETH Update #1 – July 7, 2025
Ethereum is currently testing a resistance level that dates back about 30 days . I’m seeing long upper wicks forming here, suggesting a potential rejection from this zone. Price still hasn’t cleared its previous impulsive high, and this resistance could push ETH back toward the $2,480 level.
As long as ETH holds above $2,480, I don’t see any major concern. But if it loses that support, I’ll be watching the $2,375 level next. Below that, there's a visible imbalance around $2,320, which could act as a magnet for price.
For me, a long position becomes valid above $2,635 with momentum and confirmation. On the flip side, if ETH breaks $2,480 to the downside with strength, I may consider a short setup toward $2,327 .
But for now, I’m staying out. No position until the chart speaks more clearly.
ETH – Next Stop 3D 200MA?ETH on the 4H closed the week strong after holding support at the 0.5 Fib and 200-day MA.
If price holds here, it could attempt another push toward the 3D 200MA.
Let’s see how the week unfolds on the macro and political fronts.
Always take profits and manage risk.
Interaction is welcome.