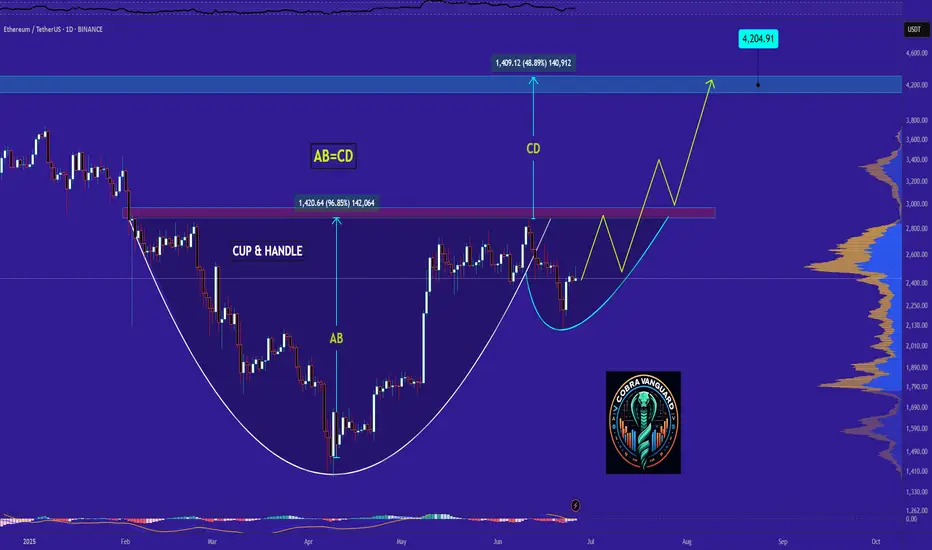
ETH It will grow soon...It can be said that the price has formed a cup and handle pattern, which it is completing soon. If the price follows this pattern, it can be expected that Ethereum will reach its peak again.
Best regards CobraVanguard.💚
Ethereum (Cryptocurrency)
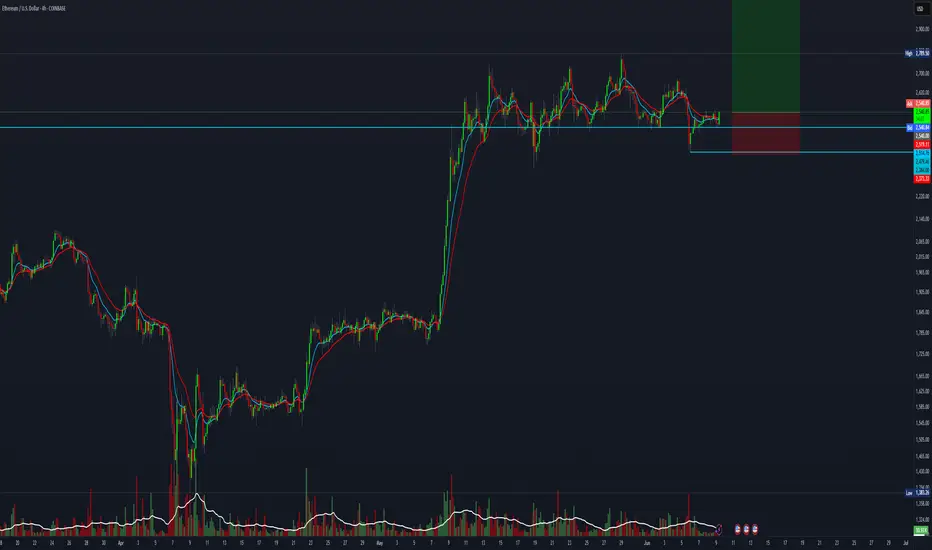
15 R:R setup for EthereumWe assume that this marks the beginning of a new uptrend for BTC. This setup offers an easy 15:1 risk-to-reward ratio.
Entry: 2534
Stop Loss: 2373.33
Target: 5000
This is for educational purposes only.
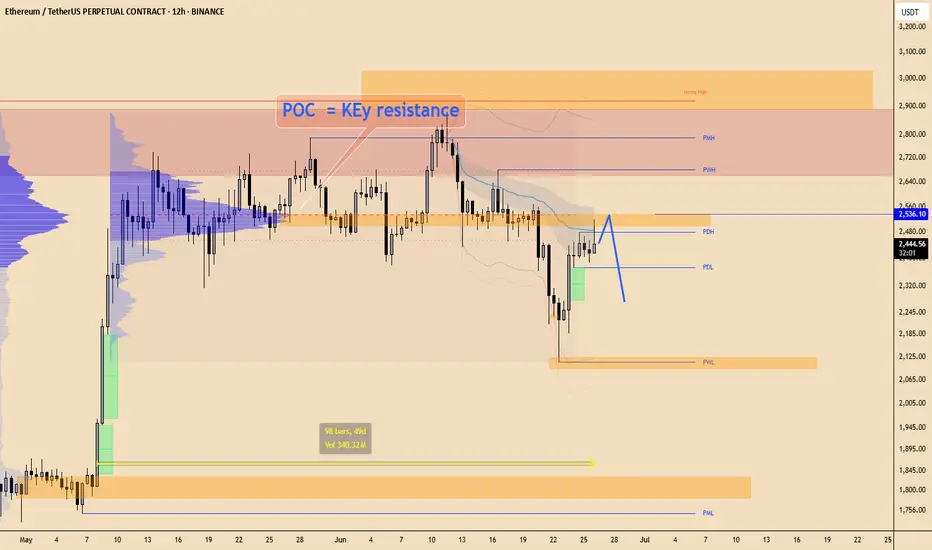
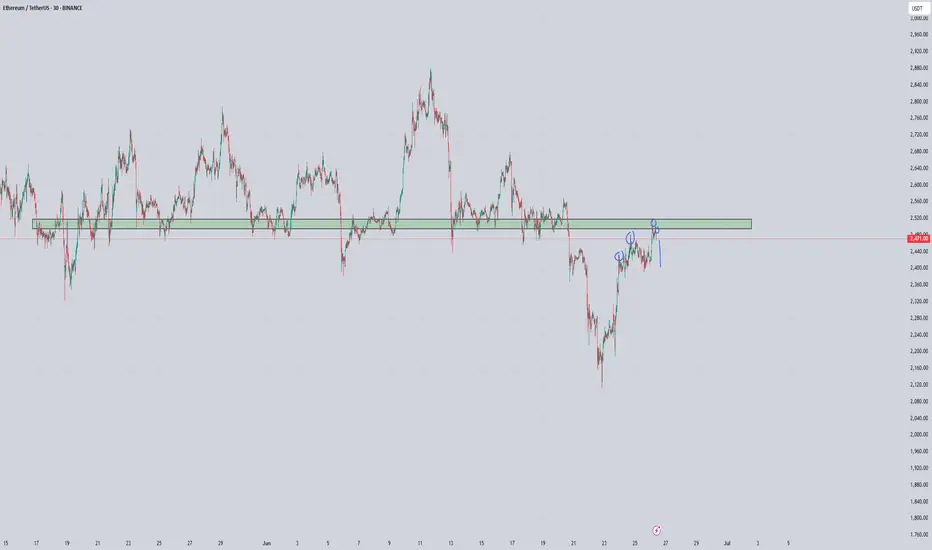
Ethereum big chance for BIG drop#ETH Price is at key resitance. POC of the entire range.
In a case of big sell volume price can continue dropping toward $2000 area
I wait for confirmation to take a trade
ETH on resistance.Ethereum 2 possible probabilities. 1 shows back demand level around 2100$ the other is a break of 2500$ and retest.
Ethereum is still bullish!#ETH
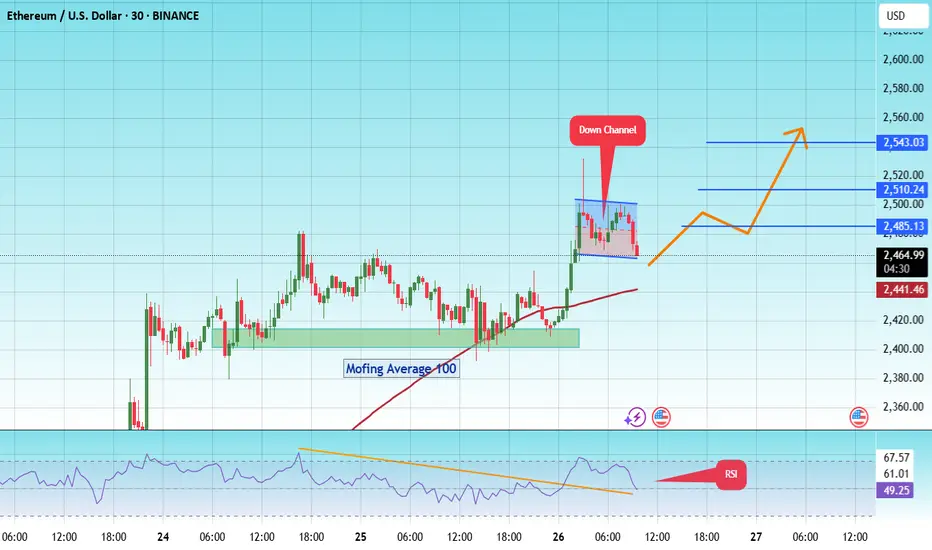
The price is moving within a descending channel on the 30-minute frame and is expected to break and continue upward.
We have a trend to stabilize above the 100 moving average once again.
We have a downtrend on the RSI indicator that supports the upward move with a breakout.
We have a support area at the lower boundary of the channel at 2450, acting as strong support from which the price can rebound.
We have a major support area in green that pushed the price upward at 2400.
Entry price: 2460.
First target: 2485.
Second target: 2510.
Third target: 2543.
To manage risk, don't forget stop loss and capital management.
When you reach the first target, save some profits and then change your stop order to an entry order.
For inquiries, please comment.
Thank you.
#ETH/USDT#ETH
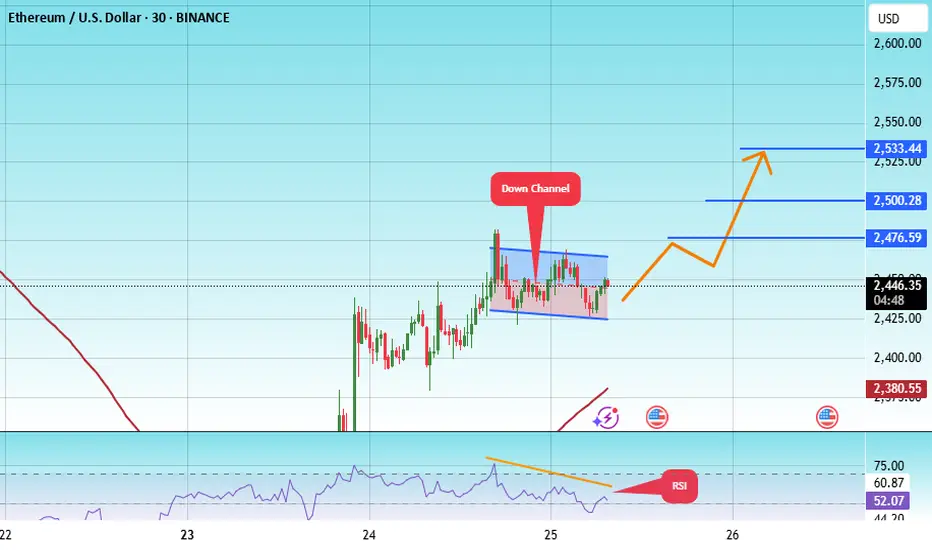
The price is moving within a descending channel on the 1-hour frame, adhering well to it, and is on its way to breaking it strongly upwards and retesting it.
We are seeing a rebound from the lower boundary of the descending channel, which is support at 2427.
We have a downtrend on the RSI indicator that is about to break and retest, which supports the upward trend.
We are looking for stability above the 100 moving average.
Entry price: 2447
First target: 2476
Second target: 2500
Third target: 2533
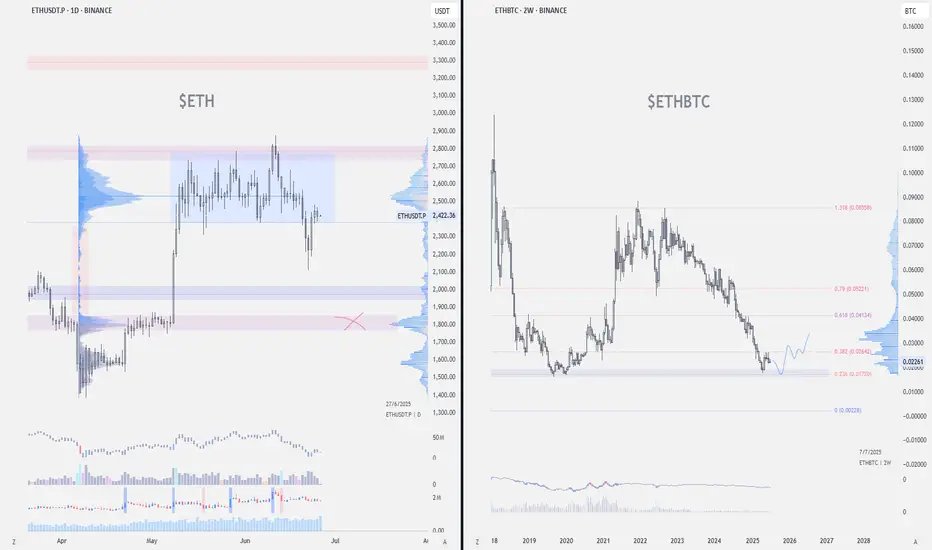
$ETH & $ETHBTCBINANCE:ETHBTC and CRYPTOCAP:ETH
BINANCE:ETHBTC is rejecting at the 0.382 fibs level.
Technically, any coin hitting 0.236 is showing weakness.
Another retest is fine, but we don't want to see 0.236 fib level break
For CRYPTOCAP:ETH , price needs to accept above POC and hold 2.5k. If not, a move back to 2k - 1.8k is likely
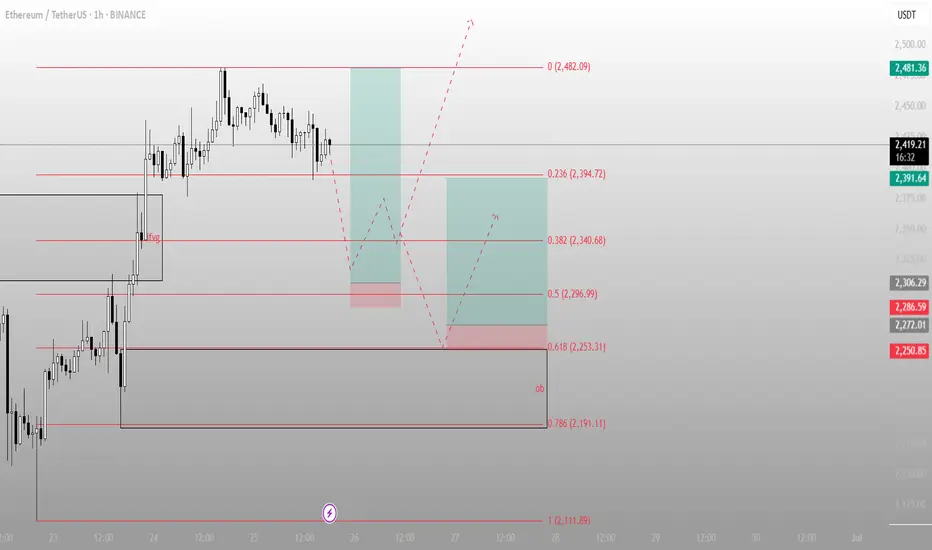
Everyone sees consolidation. I see positioningETH is holding just above a key fib cluster, showing signs of controlled distribution, not weakness. Smart Money doesn’t chase — they build positions while the crowd second-guesses.
The Structure:
Current Price: ~2,419
Local High (Premium): 2,482.09
Fib Retracements:
0.236 → 2,394.72 (mild correction)
0.382 → 2,340.68 (initial re-entry zone)
0.5 → 2,296.99 (ideal discount)
0.618 → 2,253.31 (deep entry, high confluence)
0.786 → 2,191.11 (structure last line)
Key Zones:
FVG already filled during the move up — imbalance mitigated
Order block (OB) at 2,191.11: high-probability reaction zone
Strategy Outlook:
Scenario A (Shallow pullback):
ETH tests 2,394 → 2,340, then continues the push to 2,482
→ Aggressive buyers step in early
Scenario B (Deeper sweep):
A drop to 2,296 → 2,253 opens the door for reaccumulation
→ Classic Smart Money trap before the next rally
Invalidation:
A break below 2,191 (and OB failure) kills this bullish narrative
Execution Logic:
Accumulation Zones:
Light: 2,340–2,296
Strong: 2,253–2,191 (discount reload)
Target:
2,482
Extension optional if momentum builds above recent highs
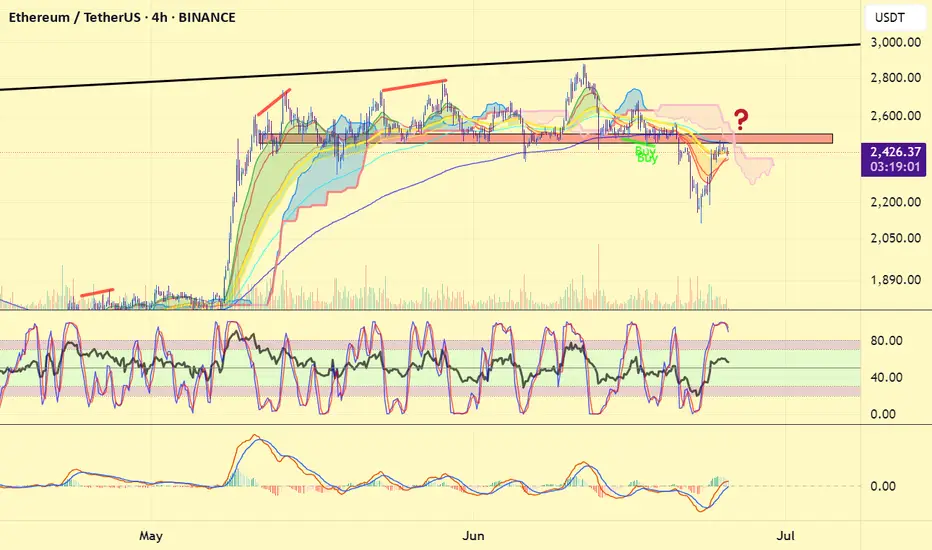
ETHEREUM is having a bearish retest?#ethereum price has been moving in a distribution zone and needs to breakout at least 3000$ to be optimistic and 3300$ to be bullish. #eth price is now having a bearish retest where broke the former support zone and now testing the current resistance zone. 4H ichimoku cloud must be broken out. A heavy declination from this zone may cause heavier dumps.
Decision Phase in ETHBTCI would like to offer an idea about ETHBTC. Although it showed a nice bottom formation with its last breakout move, I think it is at a very critical point with the horizontal movement and downward break that followed. If you look at the ETH chart ( ) , you can see that it corrected almost 60% of its sharp rise and gave a nice test to the red box and went up. It is currently trying to stay within its old range. ETHBTC, on the other hand, is making a downward move. It would not be wrong to say that it has evolved into an structure as if it made a downward retest, despite having made a similar move.
I have 3 plans for this process:
Plan 1: The price retesting the 0.026 levels after entering the old range and throwing it above this area with a slow and small pullback. I will consider the last downward move as manipulation and take a position accordingly.
Plan 2: Defining its last move as a retest to the range it broke down, continuing its decline and first coming back to the 0.019 levels. Maybe a decline to the green box zone below after the reaction there.
Plan 3: After making the rise in plan 1, testing the 0.021 levels for the last time by pulling back more and starting a rapid rise from there. Frankly, although it is a bit difficult, such a move seems good to me since seeing sharp movements and volume in the bottom formation will increase the opinion that the rate is the bottom.
This is the roadmap I will follow in general. I think these movements can be until the first week of July. I hope that the next 10 days will give a good idea of how we will spend the summer months. It should not move horizontally in these areas anymore and I don't think it will. I don't care about drawing both up and down and then saying "aha" and being right. If my goal is not to make money, being right is useless. If there is a movement that is suitable for one of the movements I draw, I want to take a position and turn it into reality.
Good day everyone.
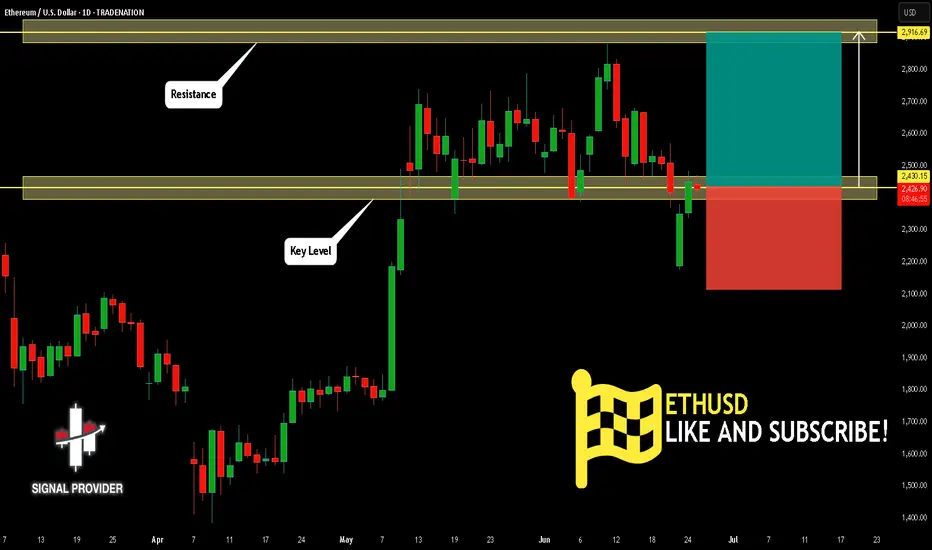
ETHUSD Is Going Up! Long!
Please, check our technical outlook for ETHUSD.
Time Frame: 1D
Current Trend: Bullish
Sentiment: Oversold (based on 7-period RSI)
Forecast: Bullish
The market is approaching a key horizontal level 2,430.15.
Considering the today's price action, probabilities will be high to see a movement to 2,916.69.
P.S
We determine oversold/overbought condition with RSI indicator.
When it drops below 30 - the market is considered to be oversold.
When it bounces above 70 - the market is considered to be overbought.
Disclosure: I am part of Trade Nation's Influencer program and receive a monthly fee for using their TradingView charts in my analysis.
Like and subscribe and comment my ideas if you enjoy them!
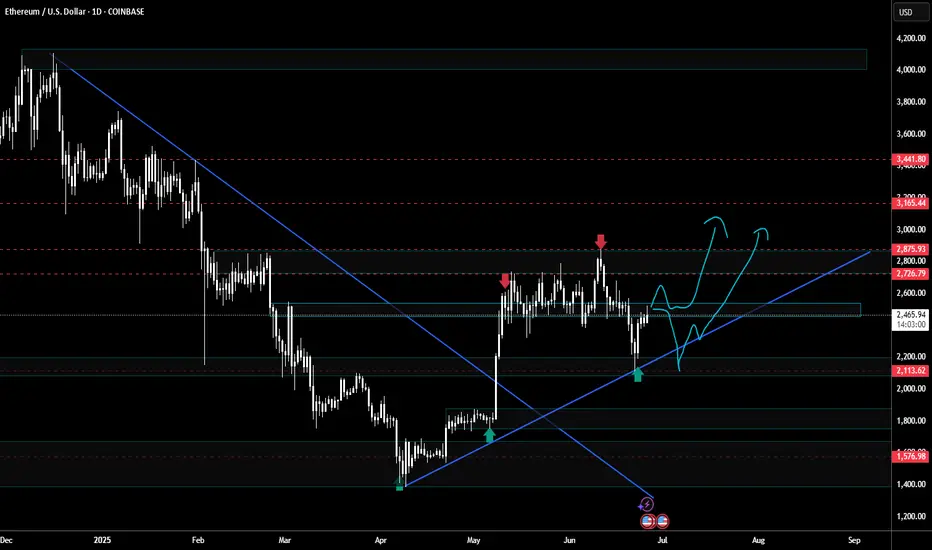
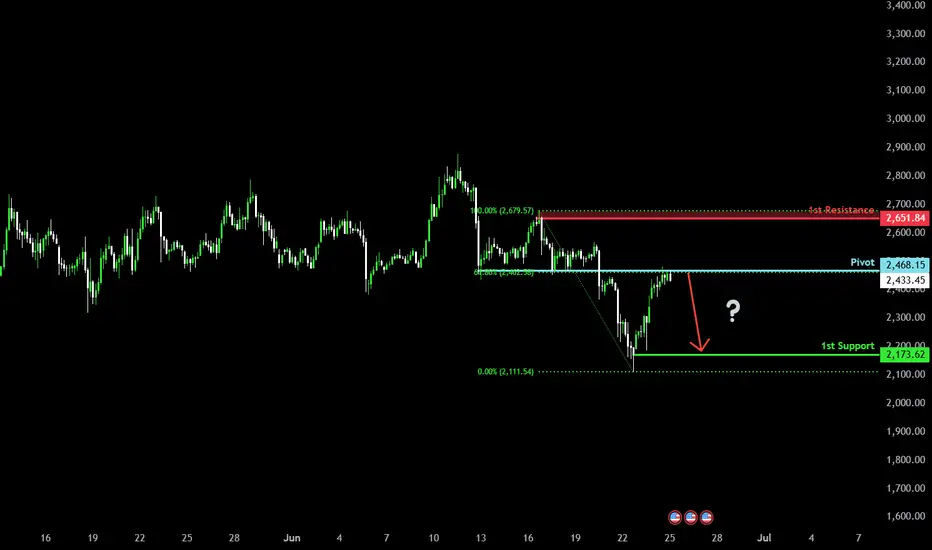
Bearish reversal?Ethereum (ETH/USD) is reacting off the pivot and could drop to the 1st support.
Pivot: 2,468.15
1st Support: 2,173.62
1st Resistance: 2,651.84
Risk Warning:
Trading Forex and CFDs carries a high level of risk to your capital and you should only trade with money you can afford to lose. Trading Forex and CFDs may not be suitable for all investors, so please ensure that you fully understand the risks involved and seek independent advice if necessary.
Disclaimer:
The above opinions given constitute general market commentary, and do not constitute the opinion or advice of IC Markets or any form of personal or investment advice.
Any opinions, news, research, analyses, prices, other information, or links to third-party sites contained on this website are provided on an "as-is" basis, are intended only to be informative, is not an advice nor a recommendation, nor research, or a record of our trading prices, or an offer of, or solicitation for a transaction in any financial instrument and thus should not be treated as such. The information provided does not involve any specific investment objectives, financial situation and needs of any specific person who may receive it. Please be aware, that past performance is not a reliable indicator of future performance and/or results. Past Performance or Forward-looking scenarios based upon the reasonable beliefs of the third-party provider are not a guarantee of future performance. Actual results may differ materially from those anticipated in forward-looking or past performance statements. IC Markets makes no representation or warranty and assumes no liability as to the accuracy or completeness of the information provided, nor any loss arising from any investment based on a recommendation, forecast or any information supplied by any third-party.
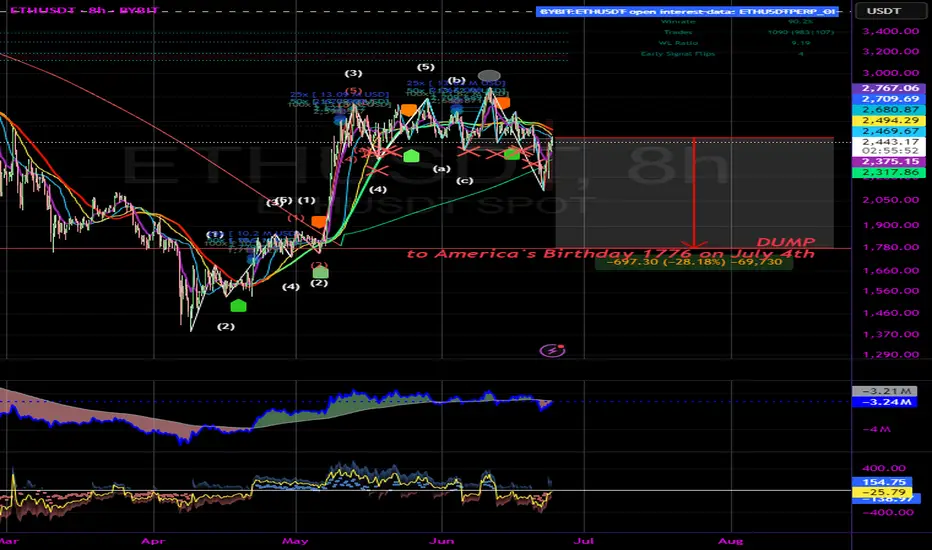
ETH Dumping to 1776 in honor of America's birthdayBART express incoming. Nice liquidity grab down there as well.
Not financial advice.
Happy July 4th!
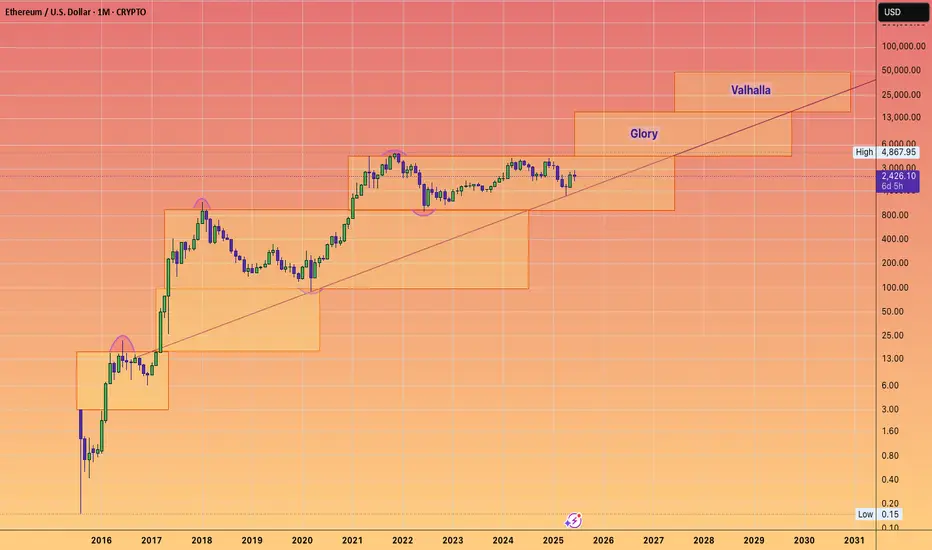
Do you want to have glory? Do want to see Valhalla?#HODL
These next few years will could change your life.
#ETHEREUM is cheap right now.
#ETH still can do tens of X's
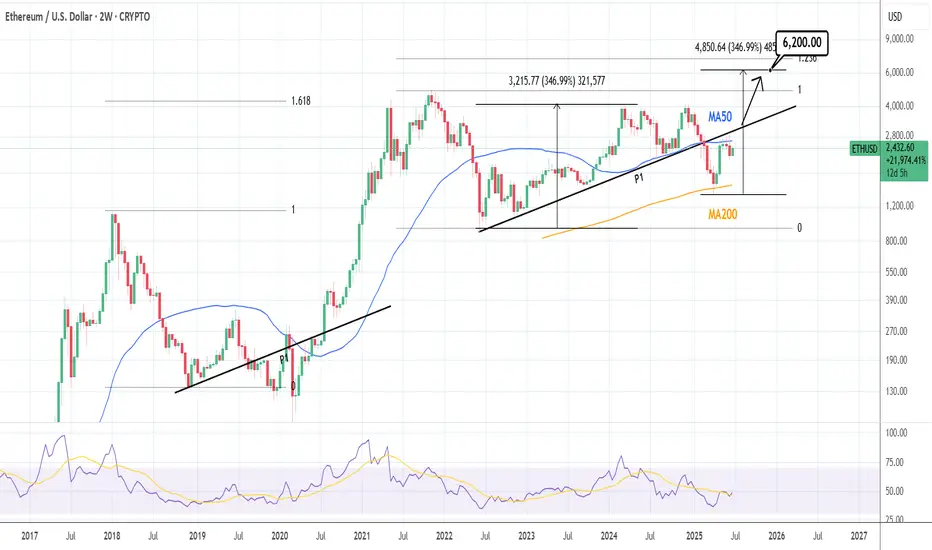
ETHUSD: Waiting for one last breakout.Ethereum remains neutral on its 1D technical outlook (RSI = 48.083, MACD = -39.26, ADX = 21.833), failing so far to close over its 2W MA50, where it's been rejected in the past 3 candles. The last Resistance before the price starts the parabolic rally is the P1 trendline. The price has been trading over it for the majority of this Cycle and only broke under it during the recent Tariff War. A breakout there, extends the Cycle to possibly at least a +346.99% rally from the bottom (TP = 6,200).
## If you like our free content follow our profile to get more daily ideas. ##
## Comments and likes are greatly appreciated. ##
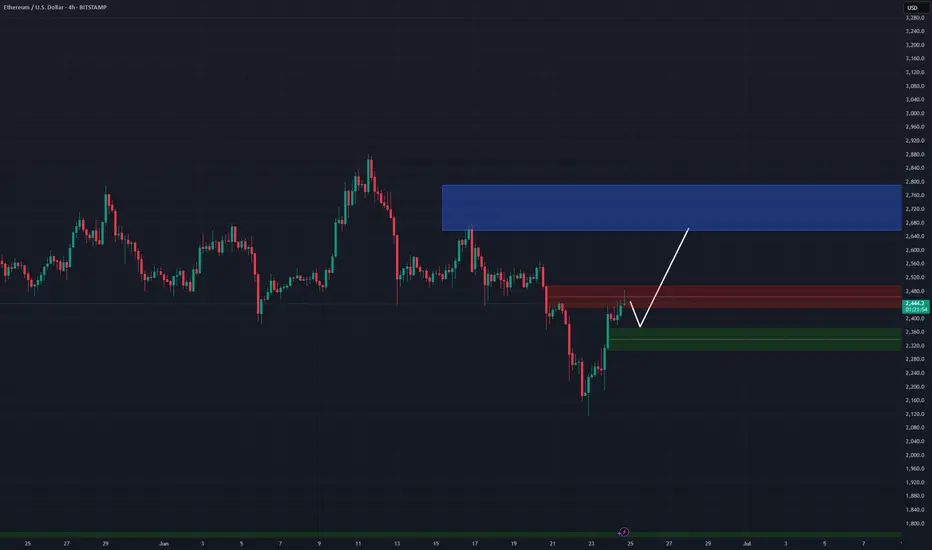
ETHEREUM ETHUSD H&S ON 4H TIMEFRAMEHello Traders,
as we can see with good chances COINBASE:ETHUSD is doing a head and shoulders pattern on 4 h targeting 2600-2800 zone.
Need to close this 4 H candle first, the support is around 2375.
remember, dips happens!
ETHUSD - Could ETH hit $800 before the next bull run?ETHUSD looks very bearish in my opinion. Strong bearish divergence on the MACD. Any substantial time ETH has stayed under the MACD zeroline has lead to very bearish price action. This price recovery is currently hitting very strong resistance area. With the Israel/Iran war looming, and the deflationary crash risks with oil dumping, I'm getting very defensive sentiment at this moment. I'll be in cash until we get further confirmation on the price action.
Ethereum Whale Buys $422M in ETH: Bullish Signal or False Hope?
The cryptocurrency market has always been a playground for big players, often referred to as "whales," whose massive transactions can influence market sentiment and price action. Recently, one such Ethereum whale has made headlines by accumulating a staggering $422 million worth of ETH in less than a month. This aggressive buying spree has sparked curiosity and speculation among investors and analysts alike. Is this whale positioning for a massive rally, or are they simply hedging against market uncertainty? Let’s dive into the details of this significant accumulation and explore its potential implications for Ethereum’s price trajectory.
The Whale’s Buying Spree: A Breakdown
Blockchain analytics platforms like Lookonchain and Whale Alert have been tracking the movements of this Ethereum whale over the past few weeks. According to their data, the whale has been systematically purchasing large quantities of ETH across multiple transactions, totaling over 150,000 ETH at an average price of approximately $2,800 per token. This accumulation, valued at $422 million, represents one of the largest buying sprees by a single entity in recent months.
What’s particularly intriguing is the timing of these purchases. The whale began accumulating during a period of relative market uncertainty, with Ethereum hovering near key support levels after a significant correction from its earlier highs. This suggests that the whale may have viewed these price levels as a buying opportunity, potentially anticipating a rebound or long-term growth in Ethereum’s value.
Why Are Whales Accumulating Now?
There are several reasons why a whale might choose to accumulate such a massive amount of ETH at this juncture. First, Ethereum remains the backbone of decentralized finance (DeFi) and non-fungible tokens (NFTs), two sectors that continue to drive innovation and adoption in the crypto space. Despite short-term price volatility, Ethereum’s fundamentals—such as its developer activity, network usage, and upcoming upgrades—remain strong.
Second, the whale may be betting on the long-term impact of Ethereum’s transition to Proof-of-Stake (PoS) via the Merge and subsequent upgrades like sharding. These upgrades are expected to make Ethereum more scalable, energy-efficient, and cost-effective, potentially driving greater adoption and value over time.
Finally, macroeconomic factors could be at play. With inflation concerns and uncertainty in traditional markets, some institutional investors and high-net-worth individuals are turning to cryptocurrencies like Ethereum as a store of value or hedge against economic instability. This whale’s buying spree could be a signal of growing institutional interest in Ethereum as a long-term investment.
Market Implications of the Whale’s Actions
The actions of whales often have a ripple effect on the broader market. When a single entity accumulates such a large amount of a cryptocurrency, it can create a supply crunch, reducing the amount of ETH available for sale on exchanges. This, in turn, can drive up prices if demand remains constant or increases.
Moreover, whale activity often attracts the attention of retail investors, who may interpret such moves as a bullish signal. Social media platforms like Twitter and Reddit are already buzzing with discussions about this whale’s accumulation, with many speculating that a major price rally could be on the horizon. However, it’s worth noting that whale movements can also be a double-edged sword—while accumulation can signal confidence, sudden sell-offs by the same whale could trigger panic and price crashes.
For now, the Ethereum market appears to be reacting positively to this news. In the days following the whale’s most recent purchases, ETH’s price has shown signs of recovery, bouncing off key support levels. But is this just a temporary blip, or the beginning of a sustained rally? Let’s explore this further in the next section.
________________________________________
Ethereum Bounces Hard After Support Bluff: A False Alarm or Fresh Rally?
Ethereum’s price action in recent weeks has kept traders on edge. After a prolonged period of consolidation and a dip toward critical support levels, ETH staged a powerful bounce, reclaiming key technical levels and reigniting hopes of a broader rally. However, the question remains: is this bounce a genuine signal of bullish momentum, or merely a false alarm before another downturn?
The Support Bluff and Subsequent Bounce
Ethereum had been trading in a tight range for much of the past month, with $2,500 acting as a crucial support level. This level was tested multiple times, and on several occasions, it appeared that bears would succeed in pushing the price lower. However, each time ETH approached this support, buyers stepped in, preventing a breakdown.
This repeated defense of $2,500 created what some analysts call a “support bluff”—a situation where the market tests a key level multiple times, creating uncertainty about whether it will hold. Just when it seemed like the support might finally give way, Ethereum staged a hard bounce, surging over 10% in a matter of days to reclaim the $2,800 level. This move caught many traders off guard, particularly those who had positioned for a breakdown.
Technical indicators also supported the bullish case for this bounce. The Relative Strength Index (RSI) moved out of oversold territory, signaling renewed buying pressure, while the Moving Average Convergence Divergence (MACD) showed a bullish crossover on the daily chart. Additionally, on-chain data revealed a spike in transaction volume and active addresses during the bounce, suggesting that the move was backed by genuine market participation.
False Alarm or Fresh Rally?
While the bounce has undoubtedly injected optimism into the Ethereum market, it’s too early to declare a full-fledged rally. Several factors could determine whether this move has legs or if it’s just a temporary relief rally before further downside.
On the bullish side, the whale accumulation discussed earlier could provide a psychological boost to the market. If other large players follow suit and start buying ETH at these levels, it could create a self-reinforcing cycle of demand. Additionally, Ethereum’s fundamentals remain strong, with ongoing developments like the upcoming Cancun-Deneb (Dencun) upgrade, which aims to reduce Layer 2 transaction costs, potentially driving greater adoption.
However, there are also bearish risks to consider. The broader cryptocurrency market remains correlated with macroeconomic conditions, and any negative developments—such as interest rate hikes or geopolitical tensions—could weigh on risk assets like Ethereum. Moreover, if the whale who accumulated $422 million in ETH decides to take profits at higher levels, it could trigger a sharp sell-off, undermining the current momentum.
For now, traders are closely watching key resistance levels around $3,000 and $3,200. A break above these levels could confirm a fresh rally, potentially targeting Ethereum’s previous highs near $4,000. On the other hand, a failure to sustain the current bounce could see ETH retest the $2,500 support, with a breakdown below this level opening the door to further declines.
________________________________________
Ethereum Developer Proposes 6-Second Block Times to Boost Speed, Slash Fees
Ethereum’s scalability and transaction costs have long been points of contention among users and developers. While the transition to Proof-of-Stake has improved energy efficiency, issues like high gas fees and network congestion persist, particularly during periods of high demand. In a bid to address these challenges, Ethereum developer Barnabé Monnot has proposed a radical change: reducing Ethereum’s slot times (the time between blocks) from 12 seconds to just 6 seconds. This proposal aims to make the network more responsive, improve efficiency for DeFi applications, and significantly lower transaction fees. But what are the implications of this change, and is it feasible?
Understanding Slot Times and Their Impact
In Ethereum’s current Proof-of-Stake consensus mechanism, validators propose and confirm blocks in slots that occur every 12 seconds. This slot time was chosen to balance network security, decentralization, and performance. A shorter slot time means blocks are produced more frequently, which could theoretically increase transaction throughput and reduce latency for users.
Barnabé Monnot’s proposal to halve slot times to 6 seconds is based on the idea that faster block production would make Ethereum more responsive, particularly for time-sensitive applications like decentralized exchanges (DEXs) and other DeFi protocols. Additionally, by processing transactions more quickly, the network could reduce congestion during peak periods, potentially leading to lower gas fees for users.
Potential Benefits of 6-Second Slot Times
If implemented successfully, Monnot’s proposal could have several positive impacts on Ethereum:
1. Improved User Experience: Faster block times would reduce the time users have to wait for transactions to be confirmed, making Ethereum more competitive with centralized payment systems and other blockchains like Solana, which boast sub-second transaction finality.
2. Enhanced DeFi Efficiency: DeFi protocols often rely on rapid transaction processing for arbitrage opportunities, liquidations, and other automated functions. A 6-second slot time could make these processes more efficient, potentially attracting more users and capital to Ethereum’s DeFi ecosystem.
3. Lower Gas Fees: By increasing the frequency of block production, the network could process more transactions per minute, reducing competition for block space during high-demand periods. This could lead to lower gas fees, addressing one of the most persistent criticisms of Ethereum.
4. Competitive Edge: Faster block times could help Ethereum maintain its dominance in the smart contract space, especially as rival blockchains continue to innovate with speed and cost efficiency.
Challenges and Risks
While the proposal sounds promising, it’s not without challenges. Reducing slot times could place additional strain on validators, particularly those with less powerful hardware. This could lead to missed slots or delays in block production, potentially undermining network stability. Additionally, shorter slot times could increase the risk of network forks or reorgs (reorganizations of the blockchain), where competing blocks are proposed simultaneously, creating temporary uncertainty about the canonical chain.
Another concern is the impact on decentralization. If faster block times disproportionately favor validators with high-performance hardware or low-latency connections, it could lead to greater centralization of the network, as smaller validators struggle to keep up. This would go against Ethereum’s core ethos of maintaining a decentralized and accessible infrastructure.
Finally, implementing such a change would require extensive testing and coordination among Ethereum’s developer community. Any misstep could result in bugs or vulnerabilities that compromise the network’s security.
Community Response and Next Steps
Monnot’s proposal has sparked lively debate within the Ethereum community. Some developers and users are enthusiastic about the potential for faster transactions and lower fees, while others caution against the risks of rushing such a significant change. Ethereum co-founder Vitalik Buterin has expressed cautious optimism, noting that shorter slot times could be a viable long-term goal but emphasizing the need for thorough research and simulation to understand the full implications.
For now, the proposal remains in the discussion phase, with no concrete timeline for implementation. If it gains traction, it could be tested on Ethereum testnets before being rolled out to the mainnet as part of a future upgrade. Regardless of the outcome, Monnot’s idea highlights Ethereum’s ongoing commitment to innovation and addressing user pain points.
________________________________________
Is Ethereum Staging a Repeat of 2021? Here’s Why a 200% Surge Could Follow
Ethereum’s price history is full of dramatic rallies and corrections, with 2021 standing out as a particularly bullish year. During that period, ETH surged from around $700 at the start of the year to an all-time high of nearly $4,900 in November—a gain of over 600%. As Ethereum shows signs of recovery in 2023, some analysts are drawing parallels to 2021, suggesting that a 200% surge could be on the horizon. But are these comparisons justified, and what factors could drive such a rally?
Parallels Between 2021 and 2023
Several factors from 2021 appear to be resurfacing in 2023, fueling speculation of a repeat performance:
1. Market Sentiment: In early 2021, the crypto market was riding a wave of optimism driven by institutional adoption, mainstream media coverage, and retail FOMO (fear of missing out). Today, while sentiment isn’t quite at 2021 levels, there are signs of growing interest, with major financial institutions exploring blockchain technology and retail investors returning to the market.
2. Network Upgrades: The lead-up to Ethereum’s London Hard Fork in 2021, which introduced the EIP-1559 fee-burning mechanism, was a major catalyst for price appreciation. In 2023, upcoming upgrades like Dencun and potential improvements to block times (as discussed earlier) could similarly boost confidence in Ethereum’s long-term value.
3. DeFi and NFT Growth: The explosive growth of DeFi and NFTs in 2021 drove massive demand for Ethereum, as most of these projects were built on its blockchain. While the hype around NFTs has cooled, DeFi continues to evolve, and new use cases like decentralized social media and gaming could reignite interest in Ethereum.
4. Macro Conditions: In 2021, loose monetary policies and stimulus packages created a favorable environment for risk assets like cryptocurrencies. While the macro environment in 2023 is more challenging, any shift toward accommodative policies—such as interest rate cuts—could provide a tailwind for Ethereum.
Why a 200% Surge Could Happen
If Ethereum is indeed staging a repeat of 2021, a 200% surge from current levels (around $2,800) would take ETH to approximately $8,400—a new all-time high. Several catalysts could make this possible:
• Institutional Adoption: Increased participation from institutional investors, as evidenced by whale accumulation like the $422 million ETH purchase, could drive sustained demand.
• Bitcoin Halving Effect: The upcoming Bitcoin halving in 2024 historically triggers bull runs across the crypto market, with Ethereum often outperforming BTC during these cycles.
• Technical Breakout: If Ethereum breaks above key resistance levels like $3,200 and $4,000, it could trigger a wave of buying momentum from technical traders and algorithms.
• Network Improvements: Successful implementation of upgrades like Dencun or shorter block times could enhance Ethereum’s utility, attracting more users and capital to the ecosystem.
Risks to the Bullish Thesis
Despite the optimism, there are significant risks that could derail a 200% surge. Regulatory uncertainty remains a major concern, with governments worldwide scrutinizing cryptocurrencies and DeFi. Additionally, competition from other Layer 1 blockchains like Solana, Avalanche, and Polkadot could divert developer and user attention away from Ethereum if it fails to address scalability and cost issues.
Moreover, the macro environment remains unpredictable. Persistent inflation, geopolitical tensions, or a prolonged recession could dampen risk appetite, weighing on Ethereum’s price regardless of its fundamentals.
Conclusion
Ethereum is at a fascinating crossroads. The massive $422 million accumulation by a whale signals strong confidence from big players, while the recent price bounce suggests that bullish momentum may be building. At the same time, innovative proposals like Barnabé Monnot’s 6-second block times highlight Ethereum’s commitment to addressing long-standing issues like fees and speed. Whether these factors coalesce into a 2021-style rally remains to be seen, but the potential for a 200% surge is not out of the question if key catalysts align. For now, investors and traders should remain vigilant, keeping an eye on technical levels, on-chain activity, and broader market trends to navigate the exciting but volatile world of Ethereum.
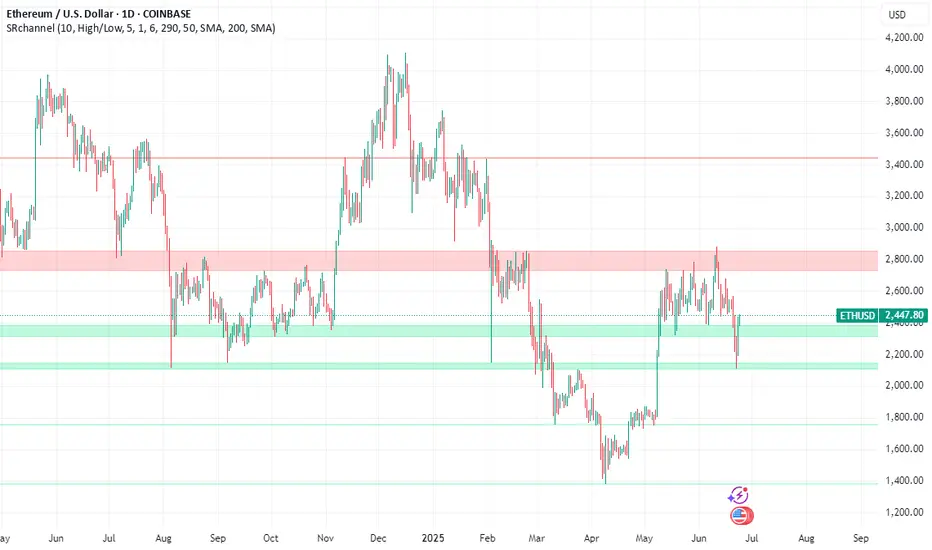
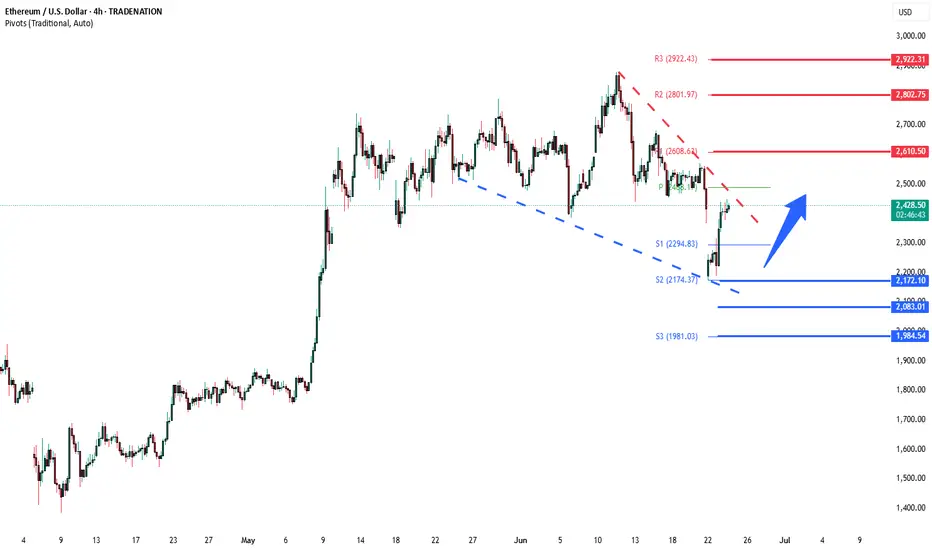
ETHUSD Energy buildup supported at 2,170Trend Overview:
ETHUSD remains in a bullish trend, characterised by higher highs and higher lows. The recent intraday price action is forming a continuation consolidation pattern, suggesting a potential pause before a renewed move higher.
Key Technical Levels:
Support: 2,170 (primary pivot), followed by 2,080 and 1,980
Resistance: 2,610 (initial), then 2,800 and 2.920
Technical Outlook:
A pullback to the 2,170 level, which aligns with the previous consolidation zone, could act as a platform for renewed buying interest. A confirmed bounce from this support may trigger a continuation toward the next resistance levels at 2,610, 2,800, and ultimately 2,920.
Conversely, a daily close below 2,170 would suggest weakening bullish momentum. This scenario would shift the bias to bearish in the short term, potentially targeting 2.080 and 1,980 as downside levels.
Conclusion:
ETHUSD maintains a bullish structure while trading above the 2,170 support. A bounce from this level would validate the consolidation as a continuation pattern, with upside potential toward the 2,610 area. A breakdown below 2,170, however, would invalidate this view and suggest deeper corrective risk.
This communication is for informational purposes only and should not be viewed as any form of recommendation as to a particular course of action or as investment advice. It is not intended as an offer or solicitation for the purchase or sale of any financial instrument or as an official confirmation of any transaction. Opinions, estimates and assumptions expressed herein are made as of the date of this communication and are subject to change without notice. This communication has been prepared based upon information, including market prices, data and other information, believed to be reliable; however, Trade Nation does not warrant its completeness or accuracy. All market prices and market data contained in or attached to this communication are indicative and subject to change without notice.
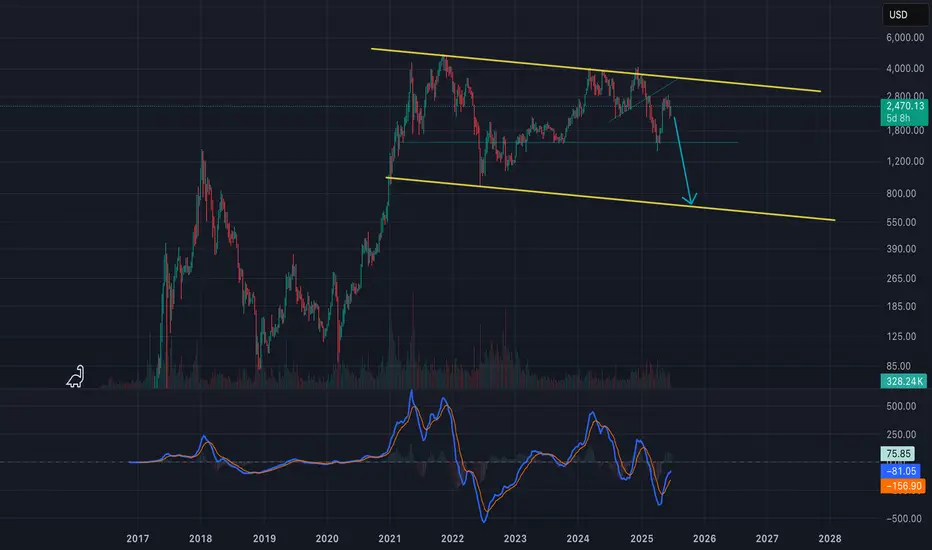
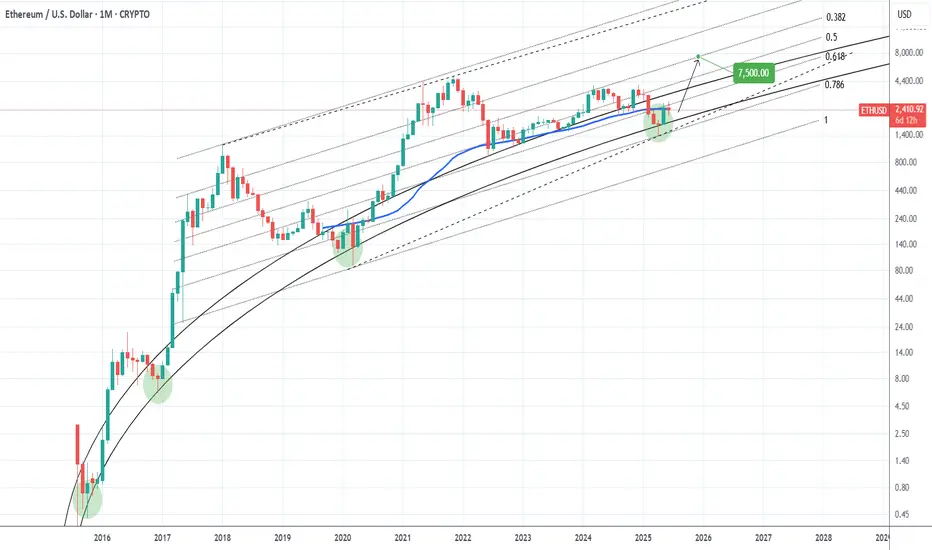
ETHEREUM Massive rally up ahead.Ethereum (ETHUSD) is trading on its 1M MA50, having recovered half of the Trade War losses. Still underperforming against most of its peers but as we've entered the 2nd half of the year, the traditional Bull Cycle rally is up ahead. We expect at least a 0.5 Fibonacci level test of the Channel Up, targeting 7500.
-------------------------------------------------------------------------------
** Please LIKE 👍, FOLLOW ✅, SHARE 🙌 and COMMENT ✍ if you enjoy this idea! Also share your ideas and charts in the comments section below! This is best way to keep it relevant, support us, keep the content here free and allow the idea to reach as many people as possible. **
-------------------------------------------------------------------------------
💸💸💸💸💸💸
👇 👇 👇 👇 👇 👇
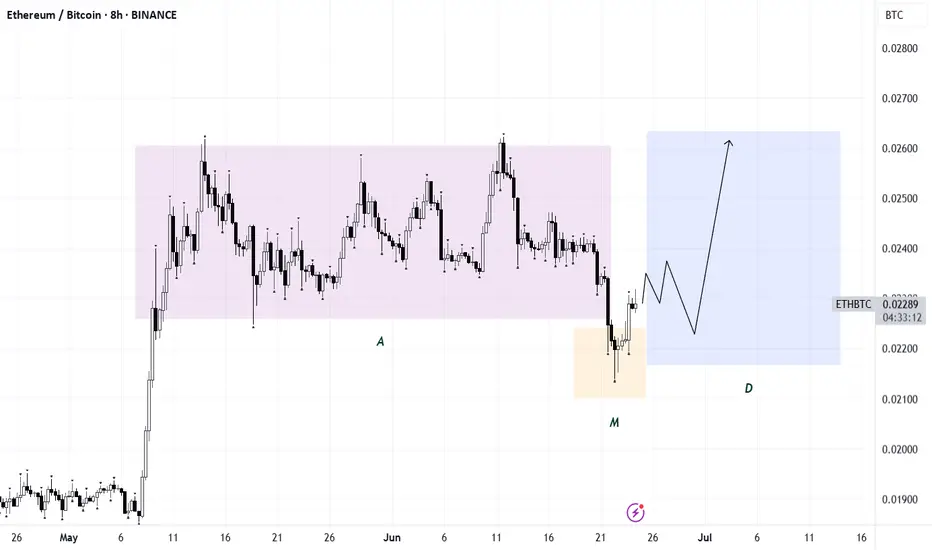
ETH/BTCPotential AMD setup forming. Ideally, a distribution phase unfolds before July 9th — which could trigger a rotation into altcoins.
As always, confirmation is key for any entry. No confirmation — no trade.
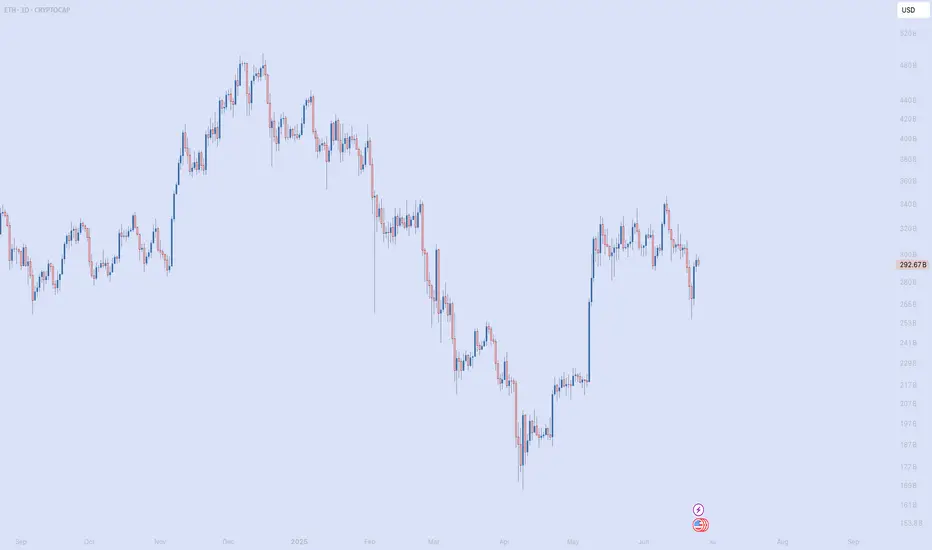
ETH update 9.06.2025Hello everyone, many of you asked me to publish my vision for ETH.
Here you go!
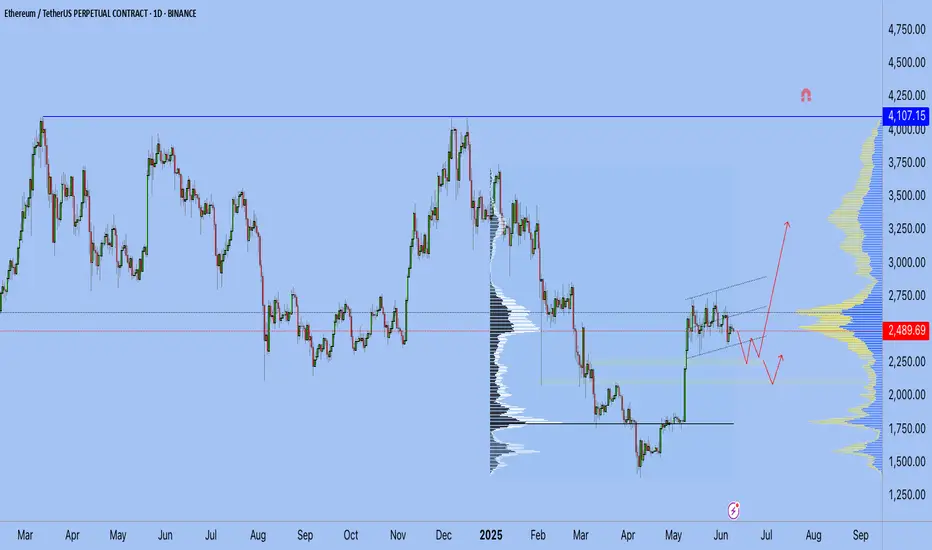
I believe that the previous impulse movement was only the first upward movement, and now we are in a sideways correction movement — call it what you will, but the fact is that the exit from this flat will be upward.
1. End of the year
2. ETH is accumulating on the Onchain
3. Liquidity overflow from BTC can be seen on the ETHBTC chart, and the overflow began at the very bottom
4. What else can large conservative players accumulate?
5. We are going after liquidity from above and should break 4100 by September
Best Regards EXCAVO