make up your mind !!!Look in my eyes and tell me you love me :)
Tell me you want me, or darling I'll be gone ;)
Look in my eyes and tell me that you're the one for me
And that our love will always be or darling I'll be gone
You still got time !!!
So make up your mind !!!
Ethereum (Cryptocurrency)
ETHUSD short-term🔍1. Technical situation
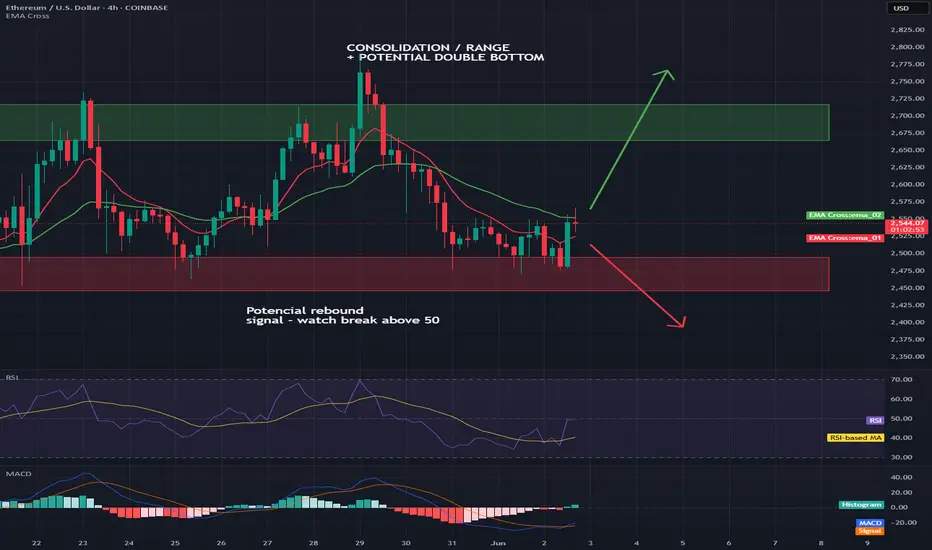
ETH/USD is in a consolidation phase — the price is moving in a rather narrow range, without a clear upward or downward trend.
📊
The upper limit of this consolidation is the resistance zone of USD 2,664–2,717 (green rectangle on the chart).
The lower limit is the support zone of USD 2,495–2,446 (red rectangle).
2. Potential formation
A potential double bottom formation can be seen on the chart, which is a classic trend reversal formation to an upward one.
The lows occurred around May 25–31 and at the end of May.
Confirmation of the formation would be a breakout of the resistance zone of USD 2,664–2,717.
3. Technical indicators
RSI:
Currently, the RSI has rebounded from zone 40 and is heading up. Exceeding the 50 level may be a signal of buyers' strength and support for the bullish scenario.
On the chart: "Potential rebound signal - watch break above 50"
MACD:
MACD is close to generating a momentum change signal (potential intersection of the MACD and signal lines).
On the chart: "MACD near signal - watch for momentum shift"
4. Scenarios for the coming hours/days
Bullish scenario (up):
✅
If the price breaks above USD 2,717 (exit from consolidation upwards), a dynamic move towards USD 2,800 can be expected.
Support for this scenario will be signals from RSI and MACD.
Bearish scenario (down):
🔻
If the price rejects the resistance zone and returns below USD 2,446, the risk of going down to the next support in the area of USD 2,300 increases.
🧠
Summary
Key Levels:
📌
Support: $2,495-$2,446
Resistance: $2,664-$2,717
Currently, the market is in consolidation with an attempt to break out to the top.
Watch for: Resistance breakout (potential bullish signal) and support reactions (potential bearish).
Pattern: Potential double bottom - needs confirmation.
$BTC not finished yetHey!
I'm still me, just a quick rebranding honoring my father.
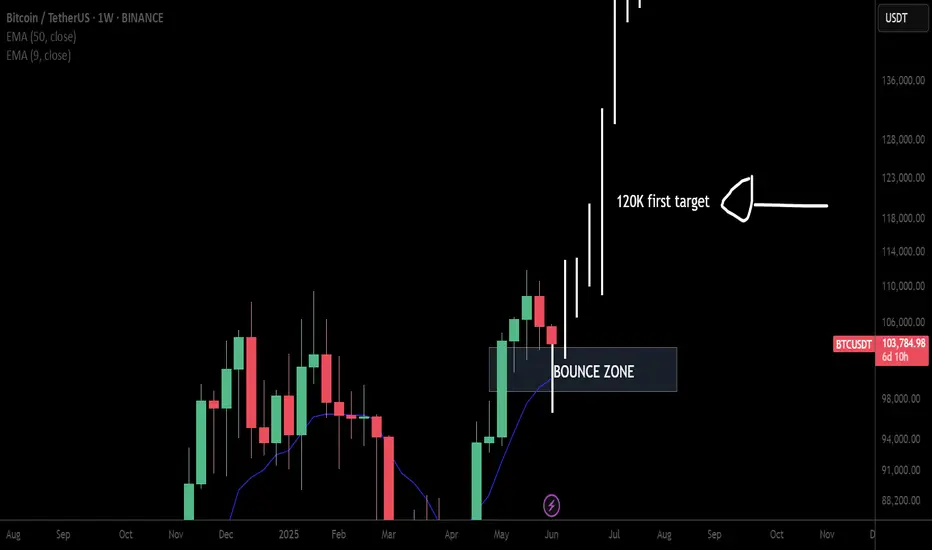
CRYPTOCAP:BTC cycle is far from over. Not saying we bottomed yet. I think prices bewteen 96 - 102k could be reached on the upcoming days.
Althought this bearish momentum, we should encounter a goooood support level which would lead us to a great short absortion. If price holds those levels this week (maybe next too) there is a high chance we will see a new leg above the ATH level.
Im long here. Stay tuned
Bitcoin needs to hold the major support at 104,5 k on 2 WeekBitcoin needs to close above the previous 2 week candles to confirm the next major upside move. A close below would most likely lead to a drop in next week. 9th of June we will know for sure what the future has for us.
BITSTAMP:BTCUSD
COINBASE:BTCUSD
NASDAQ:MSTR
CME:BTC1!
CRYPTOCAP:OTHERS
COINBASE:ETHUSD
BINANCE:SOLUSD

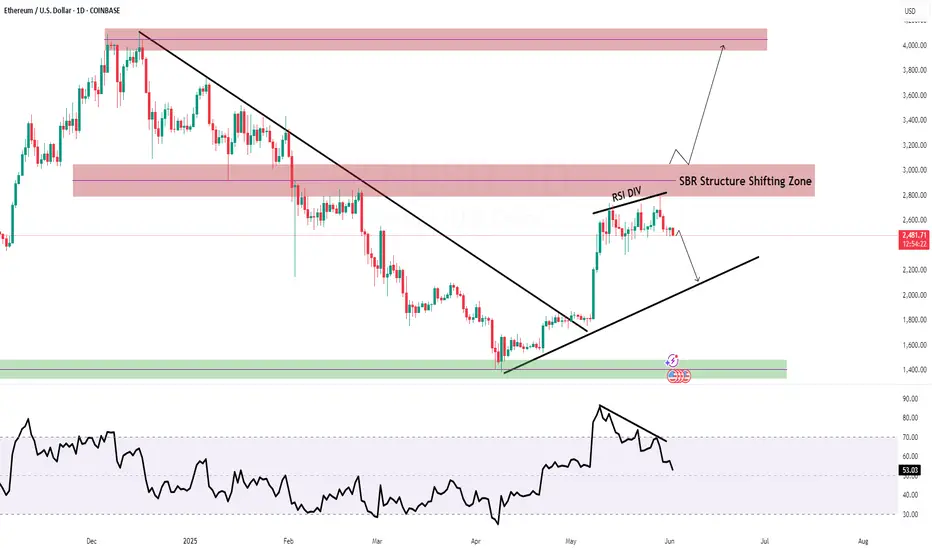
Ethereum D1 Chart Update Hello Traders,
As you can see that there SBR Zone maintained with RSI DIV as long SBR zone maintained market remains Bearish for shorter Term
once market will break SBR and turned SBR to RBS the it will move towards 3500 or even 3900
Disclaimer: Forex is Risky
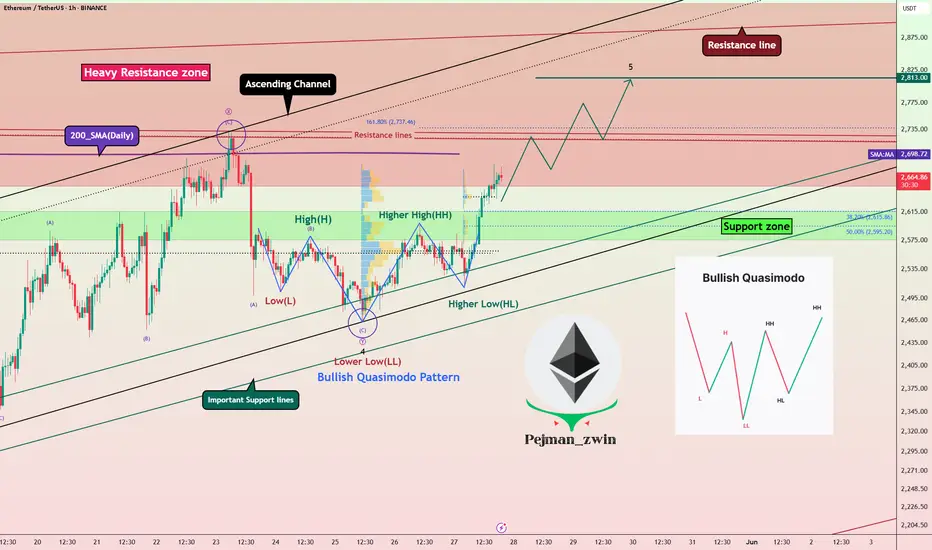
Quasimodo Pattern + Validator Support = Bullish Signal for ETHToday I want to analyze Ethereum ( BINANCE:ETHUSDT ) for you, many tokens are on the Ethereum network , and the increase or decrease of Ethereum directly affects most tokens.
So please stay with me.
Ethereum is trading in a Heavy Resistance zone($2,929_$2,652) near the Resistance lines and 200_SMA(Daily) . It is worth noting that Ethereum is preparing itself for a third attack on 200_SMA(Daily).
In terms of Price Action Analysis , Ethereum could start to rise with the help of the Bullish Quasimodo Pattern and break out of 200_SMA(Daily) and Resistance lines .
In terms of Elliott Wave theory , Ethereum appears to have completed a main wave 4 near Important Support lines . The structure of the main wave 4 is a Double Three Correction(WXY) . By breaking the 200_SMA(Daily) and Resistance lines , we can confirm the end of the main wave 4 .
The ETHBTC ( BINANCE:ETHBTC ) chart conditions are bullish , so it seems like investing in Ethereum could be better than Bitcoin . At least if the market falls , Ethereum is likely to be less likely to suffer a decline .
Note : Over 150,000 Ethereum validators, representing approximately 15% of the network, signaled support for increasing the gas limit from 36 million to 60 million units. This proposed change aims to enhance network capacity, reduce transaction fees, and improve scalability. While this development could positively impact ETH's price by making the network more efficient, it's essential to monitor potential technical risks and ensure that decentralization is maintained.
Note: If Ethereum touches $2,547 , we can expect further declines.
Please respect each other's ideas and express them politely if you agree or disagree.
Ethereum Analyze (ETHUSDT), 1-hour time frame.
Be sure to follow the updated ideas.
Do not forget to put a Stop loss for your positions (For every position you want to open).
Please follow your strategy and updates; this is just my Idea, and I will gladly see your ideas in this post.
Please do not forget the ✅' like '✅ button 🙏😊 & Share it with your friends; thanks, and Trade safe.
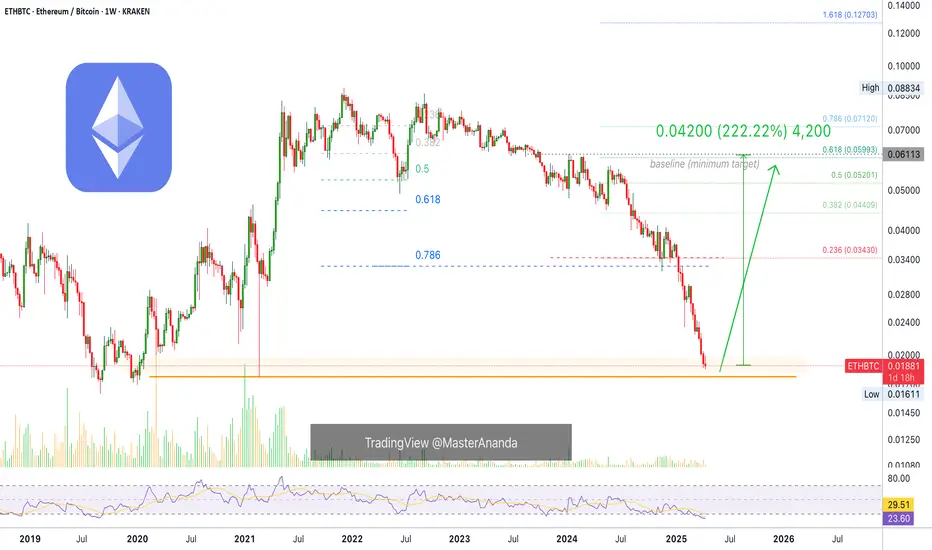
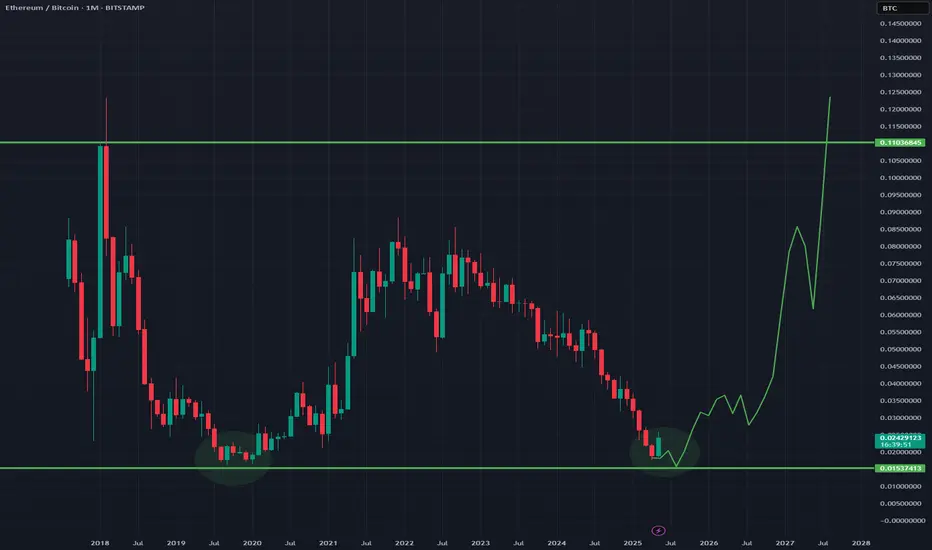
Ethereum Vs Bitcoin —Bare Minimum, 222.22% Profits Bullish WaveEthereum's current move vs Bitcoin —ETHBTC— is over-extended:
1) The drop has gone way beyond the 0.786 Fib. retracement level, almost reaching 1 (which means a 100% correction).
2) Trading volume is non-existent. Which means that this move is not supported by real people.
3) The RSI is oversold. Which means that the current action is very likely reaching its end.
4) Ethereum (ETHBTC) is trading at, and activated, the lowest prices since late 2019. The main support zone for this pair.
The current bearish move is over-extended and is showing many weaknesses, a trend reversal can happen any day. ETHBTC has been dropping since December 2021. A market can only take so much.
The minimum target for the reversal is the baseline level. Just as ETHBTC went down to test its 2019 support but with a higher low, as soon as this support zone is reached the reverse becomes true. Now ETHBTC needs to test its late 2023 early 2024 resistance zone. This level is likely to break and price reach higher but this is the bare minimum.
» The bare minimum is a nice 222.22% profits potential bullish wave.
Namaste.
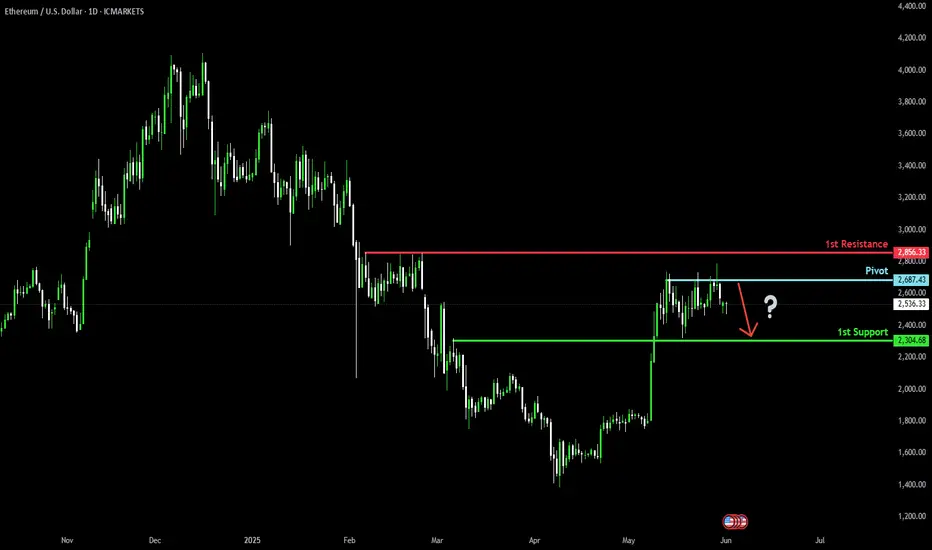
Bearish drop?Ethereum (ETH/USD) has rejected off the pivot and could drop to the 1st support.
Pivot: 2,687.43
1st Support: 2,304.68
1st Resistance: 2,856.33
Risk Warning:
Trading Forex and CFDs carries a high level of risk to your capital and you should only trade with money you can afford to lose. Trading Forex and CFDs may not be suitable for all investors, so please ensure that you fully understand the risks involved and seek independent advice if necessary.
Disclaimer:
The above opinions given constitute general market commentary, and do not constitute the opinion or advice of IC Markets or any form of personal or investment advice.
Any opinions, news, research, analyses, prices, other information, or links to third-party sites contained on this website are provided on an "as-is" basis, are intended only to be informative, is not an advice nor a recommendation, nor research, or a record of our trading prices, or an offer of, or solicitation for a transaction in any financial instrument and thus should not be treated as such. The information provided does not involve any specific investment objectives, financial situation and needs of any specific person who may receive it. Please be aware, that past performance is not a reliable indicator of future performance and/or results. Past Performance or Forward-looking scenarios based upon the reasonable beliefs of the third-party provider are not a guarantee of future performance. Actual results may differ materially from those anticipated in forward-looking or past performance statements. IC Markets makes no representation or warranty and assumes no liability as to the accuracy or completeness of the information provided, nor any loss arising from any investment based on a recommendation, forecast or any information supplied by any third-party.
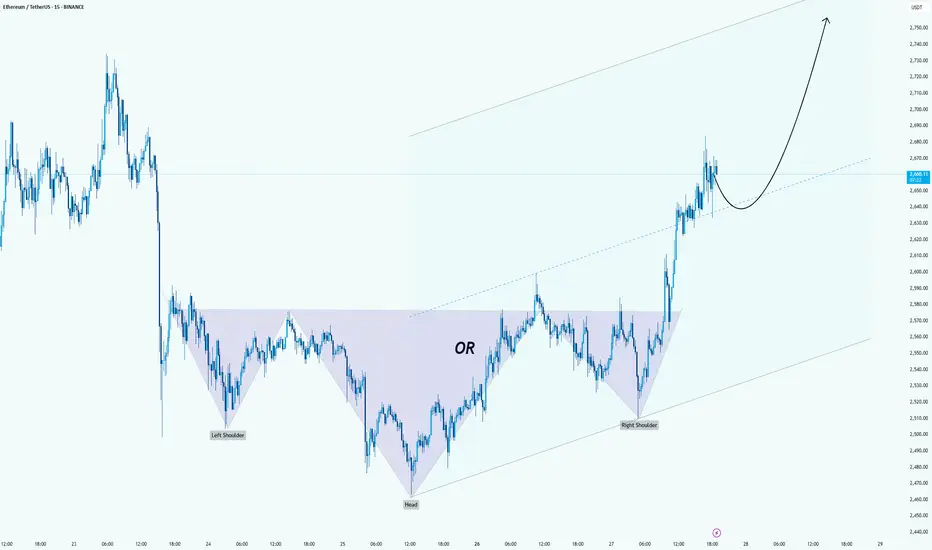
ETH >>> Inverse Head & Shoulders Breakout Sets Stage for RallyHello guys!
Ethereum has formed a textbook inverse head and shoulders pattern on the 15-minute timeframe and just confirmed a breakout above the neckline. This bullish reversal formation comes after a sharp downtrend, signaling a potential shift in short-term momentum.
📌 Breakout Level: ~$2,645
🎯 Potential Target: ~$2,730–$2,750 based on the pattern height
🟦 Retest Zone: ~$2,620–$2,640
We’re currently seeing a healthy breakout followed by a possible retest of the neckline, which could offer a solid entry for continuation toward the upper boundary of the channel.
If bulls hold this structure, ETH could accelerate higher in the coming sessions.
ETHUSD: Next Move Is Down! Short!
My dear friends,
Today we will analyse ETHUSD together☺️
The in-trend continuation seems likely as the current long-term trend appears to be strong, and price is holding below a key level of 2,507.3 So a bearish continuation seems plausible, targeting the next low. We should enter on confirmation, and place a stop-loss beyond the recent swing level.
❤️Sending you lots of Love and Hugs❤️

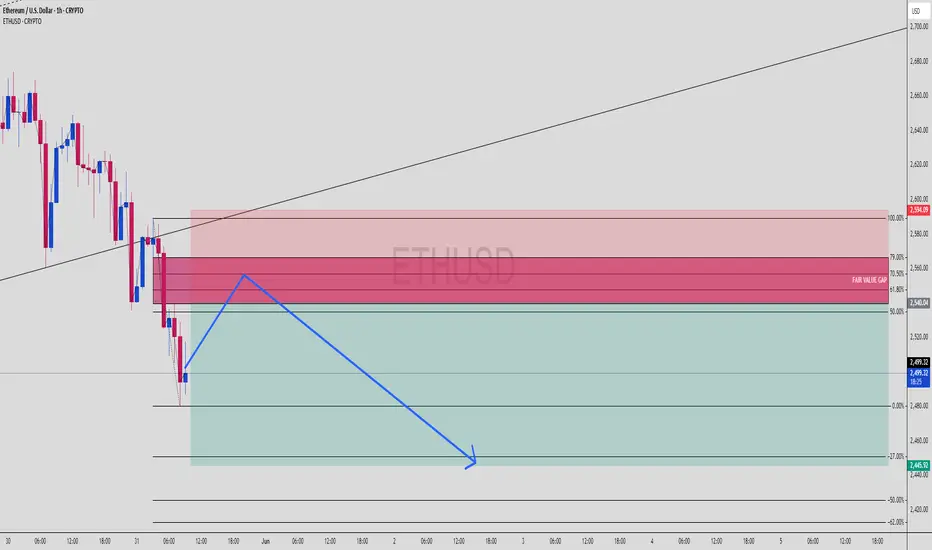
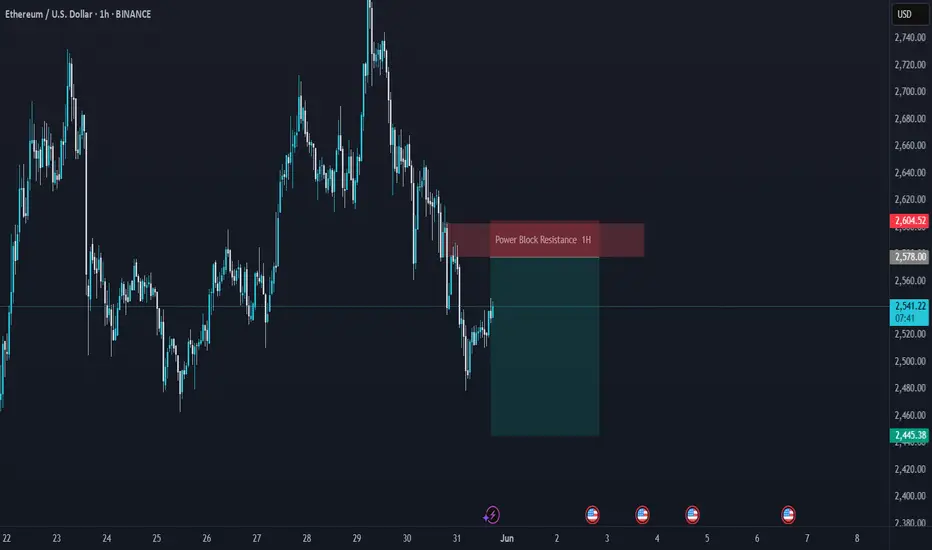
ETHUSD Bearish FVG Play | Premium Rejection Loading?Ethereum (ETHUSD) 1H Smart Money Bearish Setup | FVG + Fib Confluence
Textbook short scenario lining up on ETHUSD as it retraces into a premium zone filled with imbalance. Let’s unpack the key ingredients of this setup for the squad.
🔍 1. Trade Idea Summary
Price dumped sharply, leaving a clean Fair Value Gap
Retracement into premium (Fib 61.8%–79%) zone
Confluence of:
✅ FVG Supply
✅ Fib retracement zone
✅ Internal structure breaker
Targeting sell-side liquidity near 2,445 for a smooth RR 1:3+ setup.
📊 2. Key Zones on Chart
Entry Zone: 2,540 – 2,590 (FVG + 61.8%–79% Fib)
Strong High for Sweep (if needed): 2,594
TP Zone (Sell Side Liquidity): 2,445
SL: Above 2,600
🧩 3. Smart Money Concept Breakdown
Market made a lower low ➝ bias shifts bearish
Now retracing into the last up candle before the dump (FVG zone)
Expecting:
Premium rejection
Lower time frame CHoCH
Push to sell-side liquidity
⚙️ 4. Execution Plan
Let price enter FVG zone
Wait for M5 or M15 bearish break of structure
Confirm with:
OB rejection
Entry confirmation candle
Ride it down to TP or trail SL at midpoint
💡 5. Trader Tips:
Watch volume drop as price enters FVG — sign of weak buyers
Don’t force entry — let structure confirm
⚔️ Comment "ETH Breakdown 🔪" if you're eyeing this short
📈 Save this setup & follow @ChartNinjas88 for real-time sniper breakdowns
🎯 DM “TRADE” for access to my sniper SMC playbook
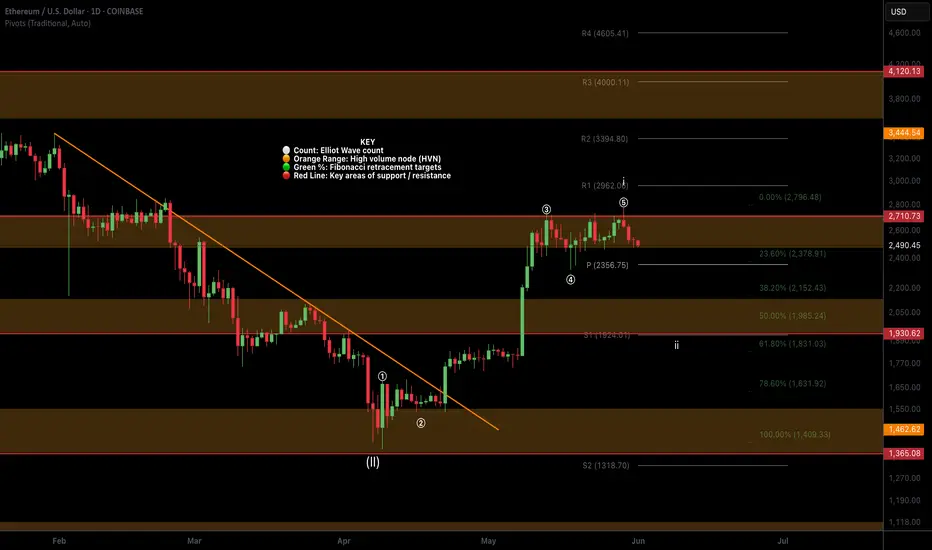
ETH (Daily) Holding up significantly wellETH is holding up its motif wave 1 rally significantly appearing to have completed an ending diagonal for wave 5 after finding a bottom at the major support high volume node (HVN).
Wave 2 is expected to retrace to the S1 pivot, 61.8 Fibonacci retracement and HVN at $1930 but may be front run at the daily pivot and wave 4 bottom $2300.
Safe trading
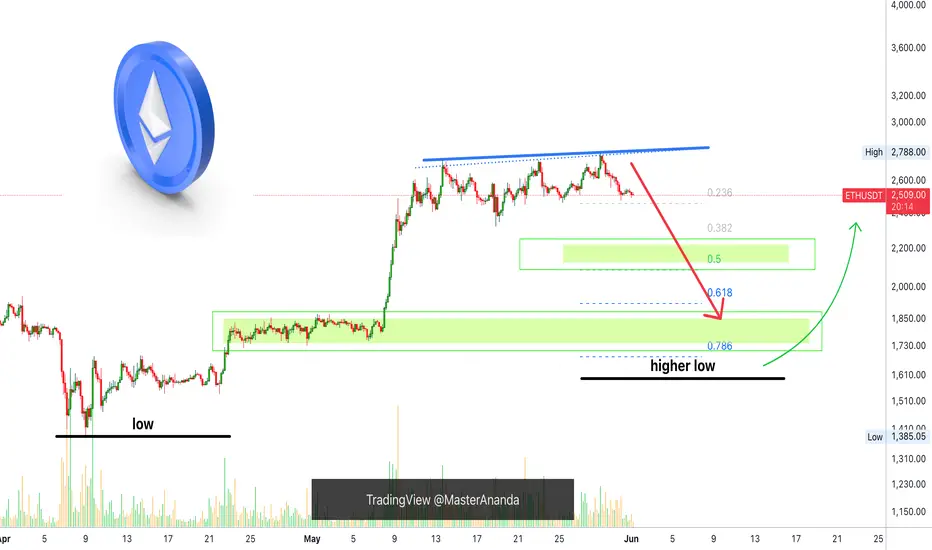
Ethereum: $2,000 Entry LONG Opportunity: Advanced Trading TipsBe careful when SHORTing here. The downside is limited but the upside is unlimited. Ideally, we trade with the trend. With the bottom being set 7-April, it would be wiser to wait for the higher low and go LONG. Now, bears are bears and bears are going to SHORT and that's ok. Just don't do it if you lack experience because it is harder than a LONG trade.
So here is the chart. The exact support level I cannot say but a bearish continuation looks high probability.
A $500 drop equals 20%. If you are doing 5X, this caps your profits potential to 100%. This isn't bad considering that it can happen within days. Experts only.
On the other hand, 3-10 days should be the maximum but of course, it can extend—these are just rough estimates.
This is how it is done from the bullish side, my side.
We wait patiently for the market to complete its retrace. We know it is a retrace because it is short-lived and because it ends in a higher low compared to the last major low.
We wait patiently for the drop and for clear reversal signals to show up on the chart. Once we have clear reversal signals, we go LONG. Very simple.
If you bought the LONG from the $1,570 level, then of course, nothing needs to be done. Sell a bit at each resistance, buy more at support. You can reduce your position even now. Remember, no need to get the exact top nor exact bottom. So you can sell some now, take profits; great. Then buy some more when prices are low. Your buy price can be $1800, $2000, $2100, it doesn't make much difference. What matters is selling high and buying low.
The first step is to get the great entry. Done. We did this back in April. The second step is to play the market as the bull market unravels. See how much time there always is to take action. Plenty of time to buy we had, plenty of time to sell.
For this to be profitable and successful we have to plan beforehand.
Here I am giving you live step by step instructions and this can also be done. But the truth is, people went LONG at resistance with high leverage and ended up losing everything, because we tend to trade based on an impulse. No, no, no.
Instead, detach, wait for the perfect moment and go LONG/SHORT.
Which one you prefer, bull?
Then wait for support and go LONG. Do not trade against your preferred bias.
Are you a bear?
Wait for resistance SHORT the retrace or wait for the correction. But this is many times harder of course because the downside is limited.
I hope you find this information useful and if you do...
Good luck.
Namaste.
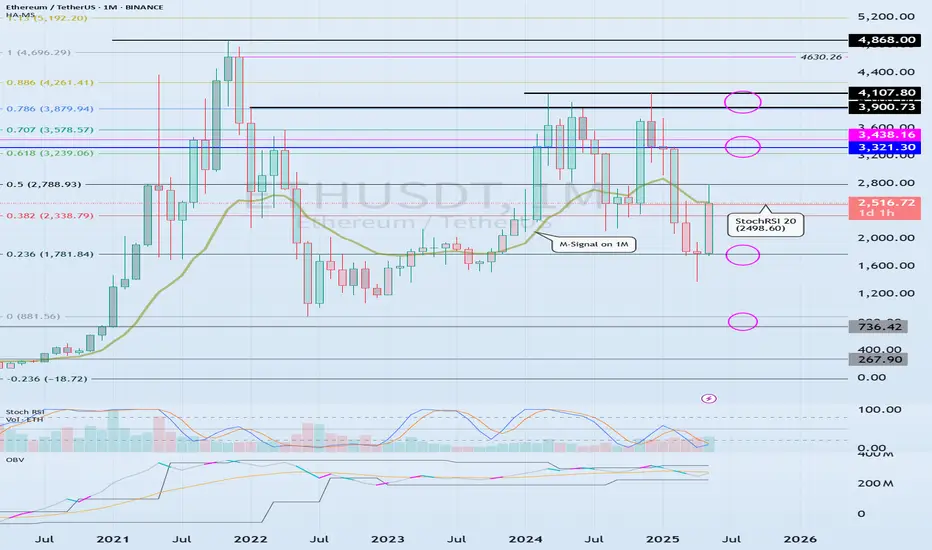
Important Turning Point: M-Signal Indicator on 1M Chart
Hello, traders.
If you "Follow", you can always get the latest information quickly.
Have a nice day today.
-------------------------------------
(ETHUSDT 1M Chart)
The key is whether the price can rise above the M-Signal Indicator on 1M Chart and hold it.
Accordingly, we need to see if it can rise with support near 2498.60, which is the 20 point of StochRSI.
If not, and it falls, we need to see if the HA-Low indicator is generated.
If the HA-Low indicator is generated, we can create a trading strategy based on whether there is support near that area.
-
(1D chart)
The key is whether it can rise with support near the M-Signal indicator on the 1D chart.
In other words, we need to see if it can rise with support near 2498.60-2609.74.
If not, it is expected to fall to the M-Signal indicator on the 1W chart and determine the trend again.
-
The current important support area is the 1647.06-1861.57 area.
The resistance zone is 3265.0-3321.30.
However, if the HA-Low indicator is newly created as the price falls, it is important to see if there is support around that area.
In any case, the price must be maintained above the M-Signal indicator on the 1M chart to continue the upward trend in the medium to long term.
Therefore, when it falls below the M-Signal indicator on the 1M chart, you should not forget that a short and quick response is required when trading.
-
Thank you for reading to the end.
I hope you have a successful trade.
--------------------------------------------------
- This is an explanation of the big picture.
(3-year bull market, 1-year bear market pattern)
I will explain more details when the bear market starts.
------------------------------------------------------
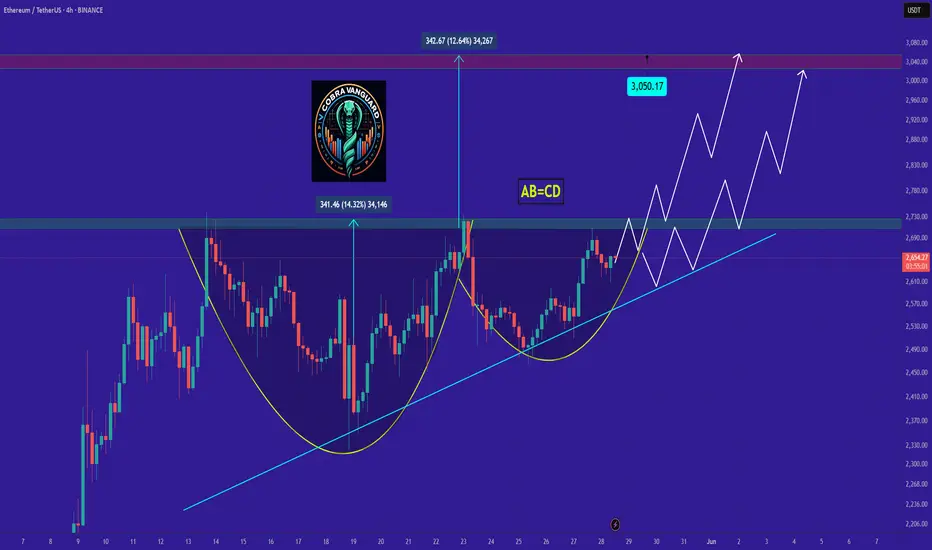
ETH's situation+ Target PredictionCurrently, ETH is forming an ascending triangle and cup and handle, indicating a potential price increase. It is anticipated that the price could rise, aligning with the projected price movement (AB=CD).
Continued strength could lead to upward movement toward targets at $2700, $2900, and $3.100
However, it is crucial to wait for the triangle to break before taking any action.
Give me some energy !!
✨We spend hours finding potential opportunities and writing useful ideas, we would be happy if you support us.
Best regards CobraVanguard.💚
_ _ _ _ __ _ _ _ _ _ _ _ _ _ _ _ _ _ _ _ _ _ _ _ _ _ _ _ _ _ _ _
✅Thank you, and for more ideas, hit ❤️Like❤️ and 🌟Follow🌟!
⚠️Things can change...
The markets are always changing and even with all these signals, the market changes tend to be strong and fast!!
ETHEREUM Bearish Signal | Technical + Custom AlgoSmart Trend Signal | Technical Analysis + Custom Algorithm
This signal is the result of a combination of classic technical trend analysis and a proprietary software I personally developed.
ETHBTC Has Bottomed A bottom like this is great
I suspect ETH will outperform BTC for awhile while altseason begins/continues
A strange chart but a good one for a reversal
Bars pattern shows my thoughts of a complete W reversal
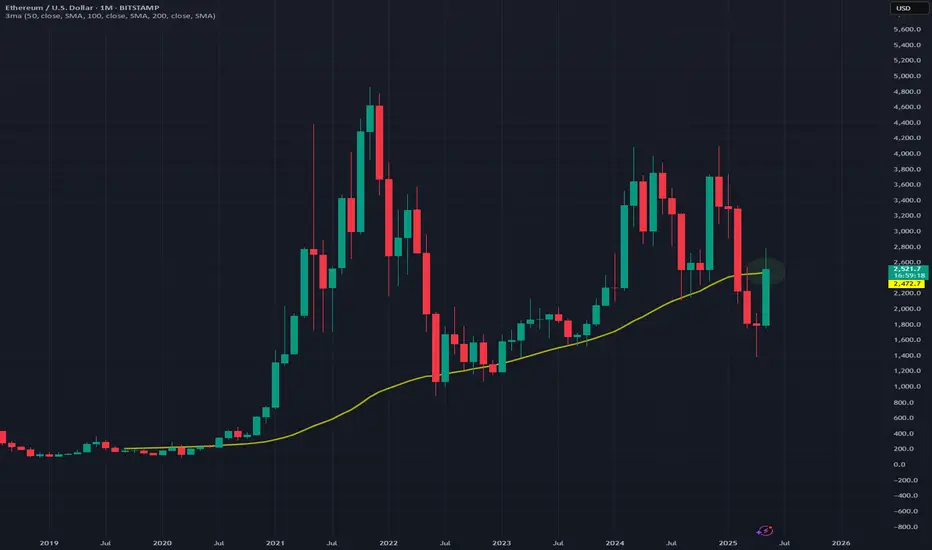
Monthly timeframe
June Will Be Good ETHUSD ETH has reclaimed the 50MA this month and with a day until June i suspect the bull action will continue
Monthly chart with the 50MA in yellow
Keen to see where this goes
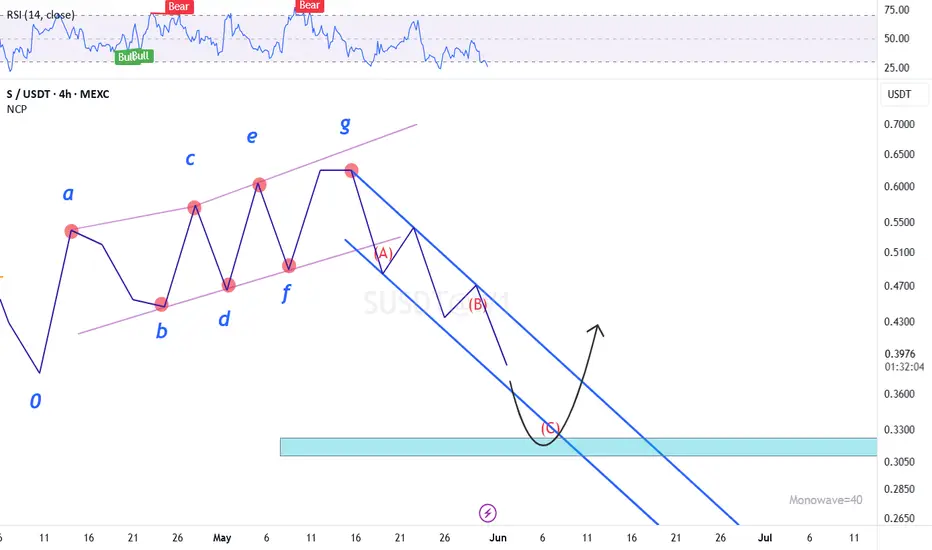
SUSDT - 1WThe previous bullish analysis failed and I currently expect a correction to the range of 0.3 to 0.33 cents...
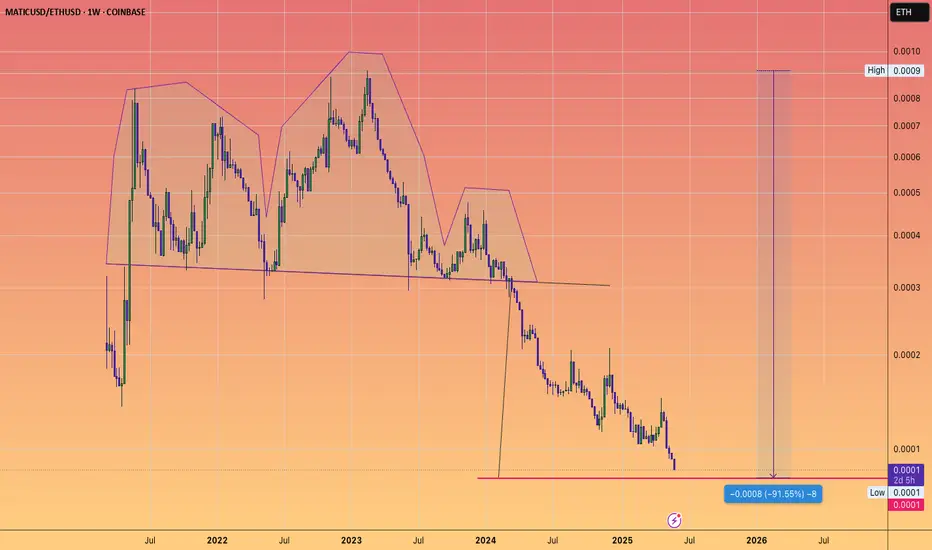
MATIC approaching Head and shoulders target...versus ETH
which would be a -91% loss of value versus the second most important crypto
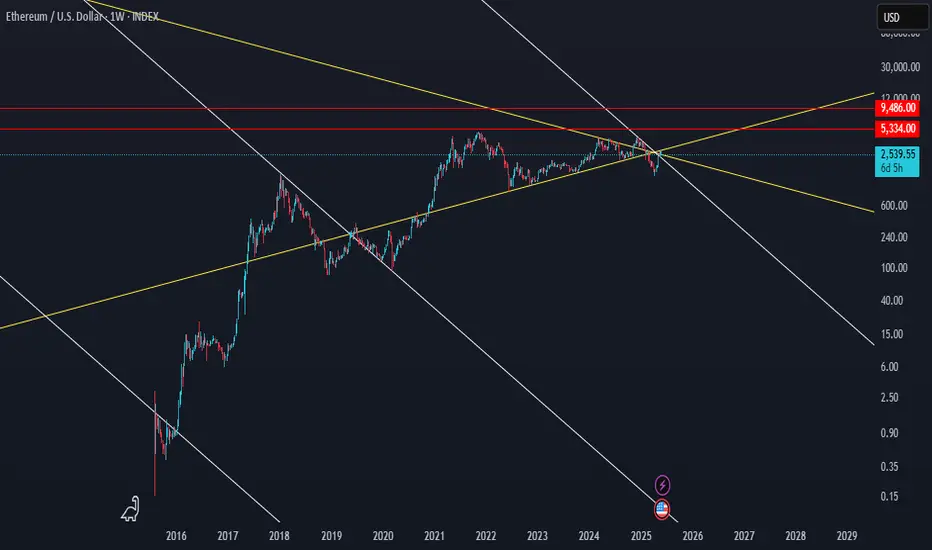
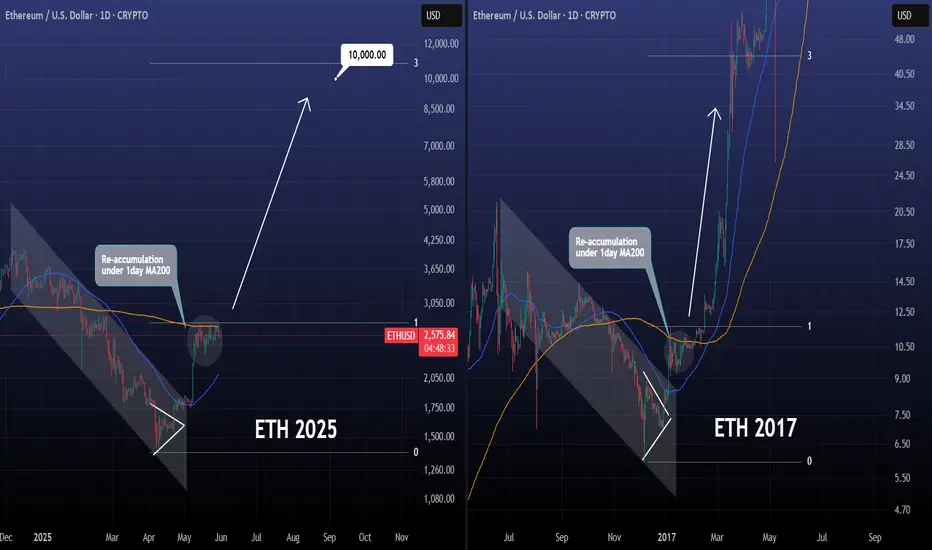
ETHEREUM can reach $10000 if 2017 is repeated.Ethereum / ETHUSD is consolidating under the 1day MA200 (resistance) and over the 1day MA50 (support).
The 2025 correction has been quite similar so far to 2016, both bearish Channels bottoming on a Triangle pattern and then rebounding.
In 2017 that rebound resulted in an insane rally above the 3.0 Fibonacci extension.
Even if the market doesn't rise this time this aggressively and that quickly, it can still approach the 3.0 Fib at 10000 and form the top for this Cycle.
Follow us, like the idea and leave a comment below!!
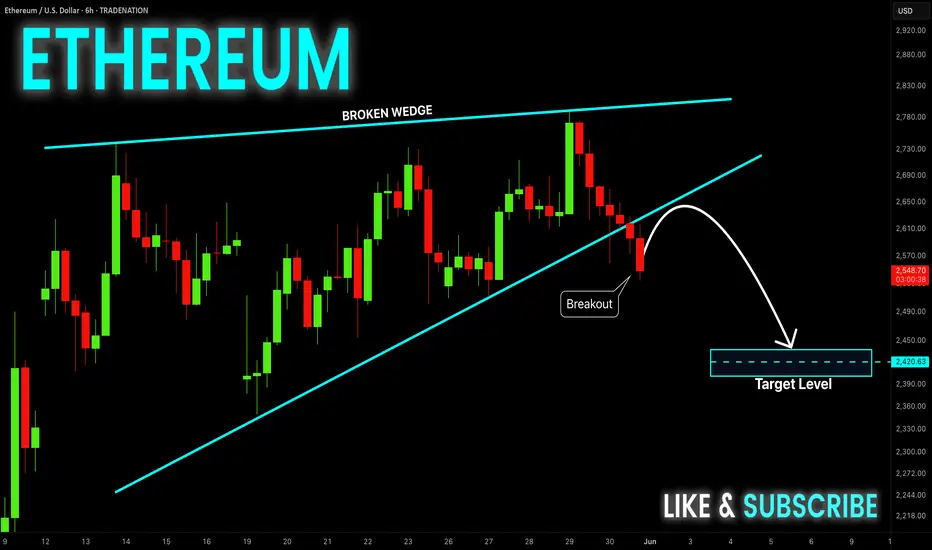
ETHEREUM Wedge Breakout! Sell!
Hello,Traders!
ETHEREUM was trading in an
Uptrend but then the coin
Formed a bearish wedge pattern
And we are now seeing a bearish
Breakout so we are locally
Bearish biased and we will be
Expecting a long awaited
Bearish correction
Sell!
Comment and subscribe to help us grow!
Check out other forecasts below too!
Disclosure: I am part of Trade Nation's Influencer program and receive a monthly fee for using their TradingView charts in my analysis.
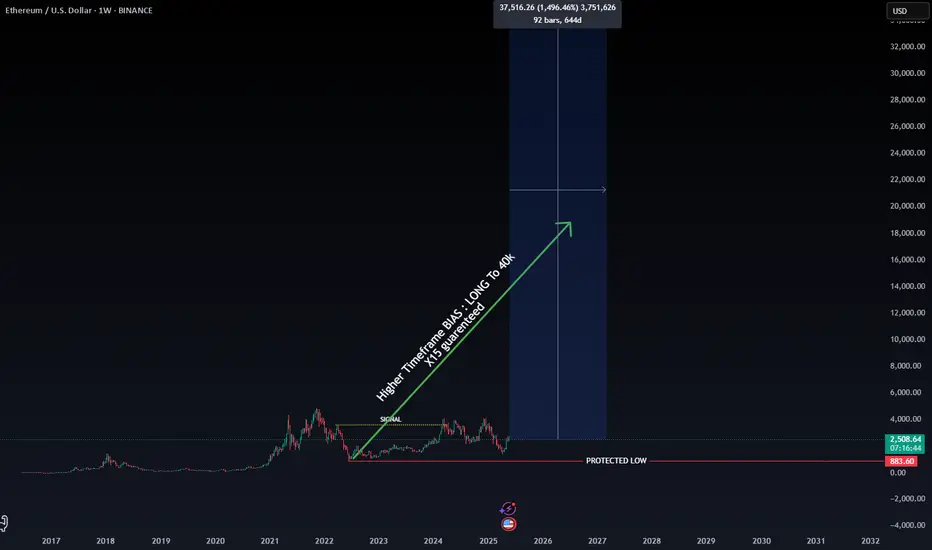
ETH Investors Are Confused, But the Algorithm Says $40K's Coming🚨 Ethereum: Confusion or Opportunity?
Many investors are currently confused — wondering whether Ethereum (ETH) is due for a deeper retracement… or if it’s about to skyrocket. So, what’s really going on?
According to our algorithmic model, ETH confirmed a long-term price target of $40,000 the moment it broke above $3,594 on March 11, 2024.
The pullback that followed?
It’s not a sign of weakness — it’s a golden entry opportunity for the next leg up with a garenteed x15 ROI from actual prices.
📉 The $883 low is considered a protected low, and according to our structure, it will likely remain untouched until ETH reaches $40,000.
💰 Why We’re Heavily Exposed to ETH
Given the current market conditions, we’ve allocated the majority of our capital to Ethereum, as it currently represents one of the most secure and promising assets in the crypto space for mid- to long-term positioning.
This isn’t just a trade — it’s a strategic investment.
🚀 Happy Trading,