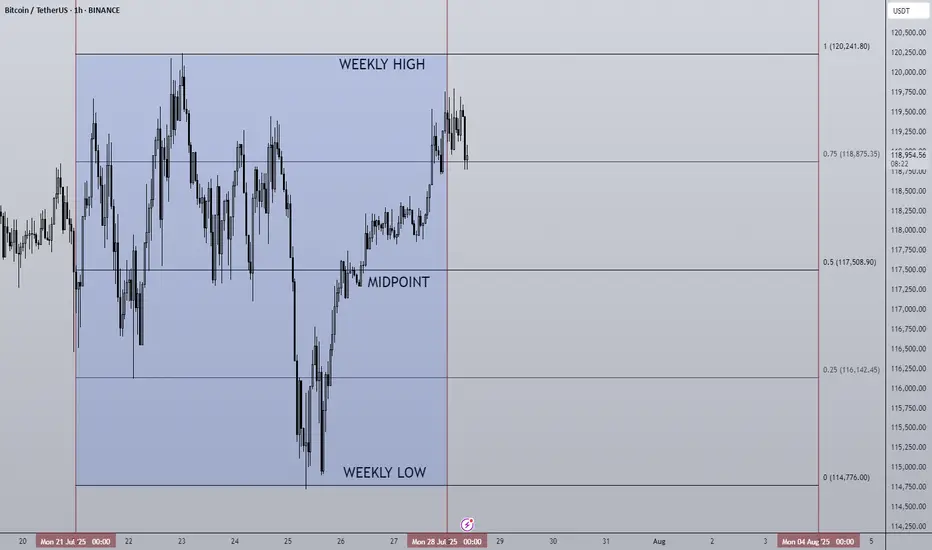
28/07/25 Weekly OutlookLast weeks high: $120,241.80
Last weeks low: $114,776.00
Midpoint: $117,508.90
As we approach the end of the month BTC continues to trade sideways during a cooling off period as altcoins finally take the stage. Last week Bitcoin saw a relatively flat net inflow via ETFs of $72m, ETH on the other hand posted the second largest net inflow week ever at $1.85B! The concentration has certainly shifted...
This IMO is still a very bullish structure for BTC, very shallow pullbacks being bought up/absorbed by still happy to purchase at these levels. As long as this continues altcoins have a strong base to continue growing on, if BTC breaks structure and price accepts below ~$110,000 then the altcoin rally will be over for now I believe.
This week some major altcoins are set to reach HTF resistance areas, ETH has already tagged $4,000 which looks to be a battleground level of major importance.
TOTAL2 which is the combined market cap of all altcoins is currently ~8% from the highs, keeping this in mind for where altcoins may run out of steam...
Good luck this week everybody!
Ethereum (Cryptocurrency)
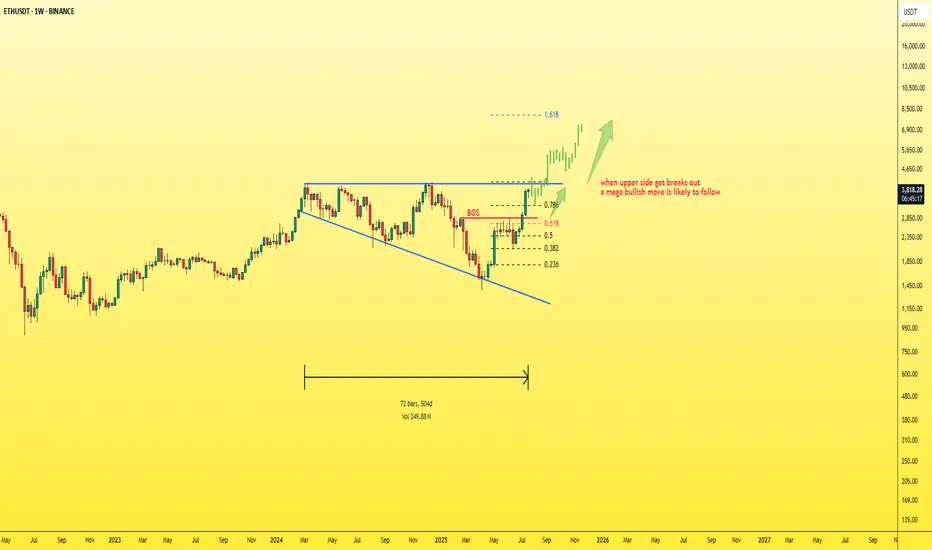
EthbtcTrend reversal signs are nearing completion
This indicates we could start trending back towards the top of the range as eth pushes to its ath usd valuation..
Institutional understanding and interest has spiked as predicted..
EthusdNot discounting the potential for a dip into the August montly open...
Retesting the trend line break for a second time..
Then we enter etf bid war phase.. multiple companies attempting to emerge as the strategy b of ethereum.
Bitmine and sharplink are leading but there's about 10-30 companies starting to accumulate heavily..

ETHUSD HEADS TOWARDS WEEKLY RESISTANCEETHUSD HEADS TOWARDS WEEKLY RESISTANCE
ETHUSD has broken local resistance of 3,850.00 and is currently heading towards weekly resistance of 4,100.00, the level, established in 2021. Last time the asset came close to this level at the end of last year and reversed from it afterwards. Same situation is expected here.
Price may retest the level of 3,850.00 and then head towards 4,100.00 level. No reversal signs on RSI or MACD. Vice a versa, RSI shows local strength of the asset, MACD is in the green zone. Buying volume highlights current bullish impulse.

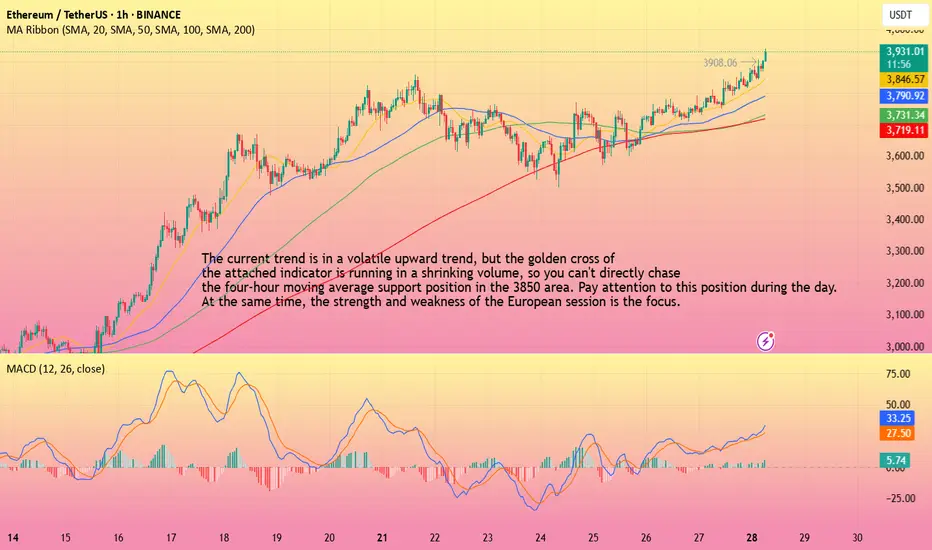
ETH-----Buy around 3850, target 3930 areaTechnical analysis of ETH contract on July 28:
Today, the large-cycle daily level closed with a small positive line yesterday, the K-line pattern continued to rise, the price was above the moving average, and the attached indicator was running in a golden cross. The general trend of rising is still very obvious. The current price has deviated from the moving average and returned to the moving average support position near the 3775 area, so you still need to pay attention to the risk trend of retracement in trading. The overall trend of the short-cycle hourly chart is in a volatile upward trend, but the price is relying on the support of the MA5 and MA10 daily moving averages to rise, and the general trend of rising is relatively obvious, so you still need to find obvious signals to enter the market during the day. The current four-hour moving average support position is near the 3850 area, and the hourly chart continues to fall.
Today's ETH short-term contract trading strategy:
Purchase at the 3850 area when retreating, stop loss at the 3820 area, and target the 3930 area;
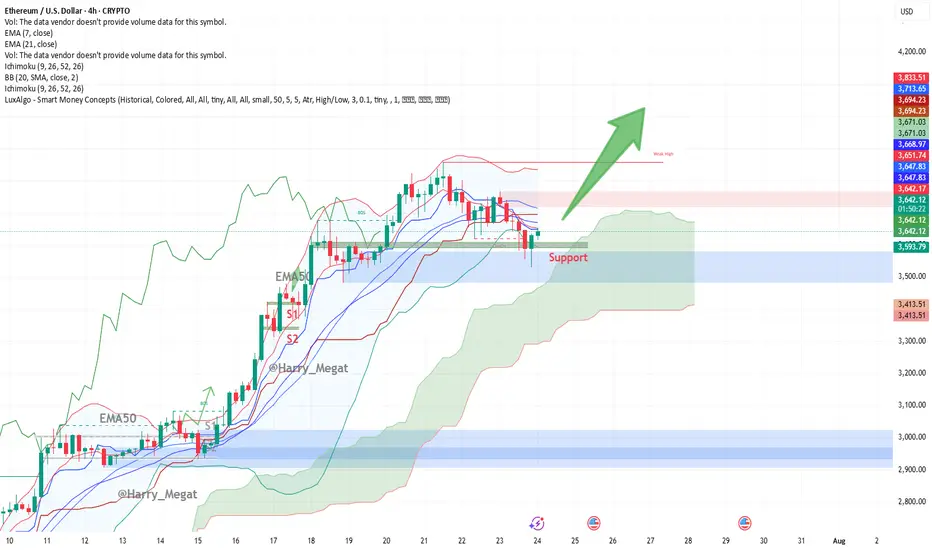
Ethereum (ETH/USD) 4-hour chart Technical AnalysisThis Ethereum (ETH/USD) 4-hour chart presents a **bullish setup**. Let’s break it down:
**Chart Overview:**
* **Price at the time of chart:** \~\$3,650
* **Support Zone:** \~\$3,615–3,630 (highlighted in green box)
* **Indicators:**
* **EMA 7 (Red):** \~\$3,653.87
* **EMA 21 (Blue):** \~\$3,669.75
* **Bullish Signal:** Large upward green arrow suggests expectation of a breakout rally from current support.
**Technical Analysis:**
**1. Bullish Bounce at Support**
* ETH tested the **horizontal support zone** multiple times, showing strong demand.
* The recent candle shows a **wick rejection** from the support zone — indicating buyer strength.
**2. Moving Averages**
* Price is trying to reclaim above the **EMA7**, with EMA21 nearby (\~\$3,670).
* A **bullish crossover** or strong candle close above both EMAs could confirm upside continuation.
**3. Structure**
* Previous resistance (\~\$3,615) has turned into **new support** — a classic bullish flip.
* The large green arrow projects a **potential breakout move**, targeting higher highs possibly above **\$3,750+**, then **\$3,900+**.
**Trade Setup Idea:**
| Type | Entry | Stop Loss | Take Profit 1 | Take Profit 2 |
| Long | \$3,655–3,660 | Below \$3,600 | \$3,750 | \$3,900+ |
**Watch Out For:**
* Rejection near EMA21 (\$3,670)
* False breakout if volume is weak
* Macro risk or sudden BTC movement dragging ETH
**Conclusion:**
The chart signals a **bullish bias** if ETH maintains above the support zone and reclaims both EMAs. A clean break above \~\$3,670–3,700 could spark further upside toward \$3,900+.
ETH/USDT (Monthly) – Symmetrical Triangle BreakoutPattern & Technical Setup
Ethereum (ETH/USDT) is showing a textbook symmetrical triangle pattern on the monthly chart. The pattern has been developing since the 2021 high, with lower highs converging with higher lows.
The current candle has broken out above the triangle’s upper trendline, suggesting a potential bullish continuation. This breakout is significant given the long consolidation period and strong volume profile near the breakout zone.
Trade Plan
• Entry: Around $4000 on confirmed monthly close above triangle.
• Stop Loss: Below $3,500 (safe side under breakout + previous support).
• Profit Targets:
$4,800 (measured move target based on triangle height)
⸻
Risk & Reward
• Risk: ~17% downside (stop at $2,950)
• Reward: ~253% upside to $4,800
• R/R Ratio: ~14:1 (favorable for swing trade)

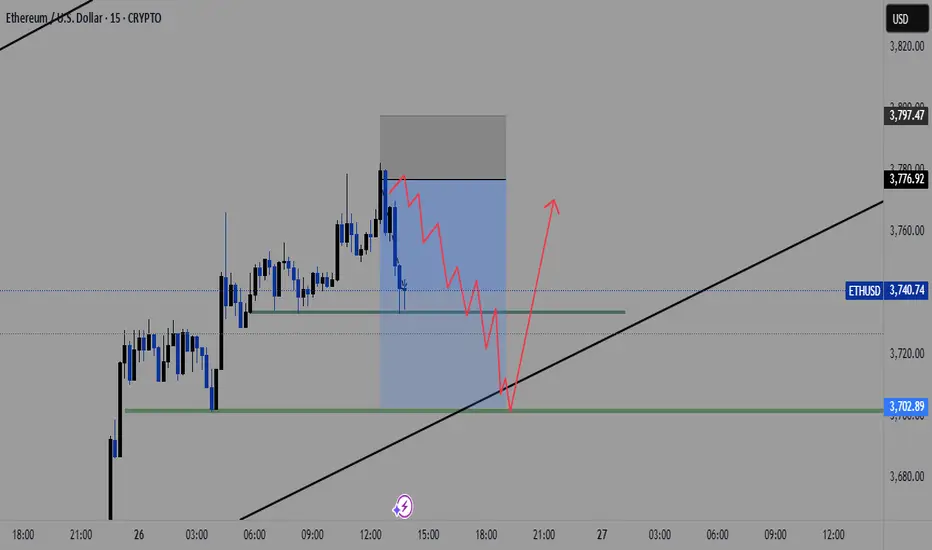
Ethereum Weekly Recap & Gameplan | 27.07.2025📈 Market Context:
ETH followed the broader crypto market momentum led by Bitcoin, supported by institutional demand and positive macro policies in the U.S.
Last week’s plan played out cleanly — we saw strong gains from the 1H demand zone.
🧾 Weekly Recap:
• Price swept 4H swing liquidity and formed a 1H bullish BOS
• Created a solid 1H demand zone, from which price bounced strongly
• Momentum remained bullish as forecasted in last week’s post
📌 Technical Outlook:
→ Expecting a short retracement into 4H liquidity levels around 3761$ or 3702$
→ Then a continuation move towards ATH zone
🎯 Setup Trigger:
What I’m watching:
✅ Sweep of 4H liquidity
✅ Bullish BOS on 15M–30M
→ This will serve as the confirmation for long entries
📋 Trade Management:
• Stoploss: Below the confirmation swing low
• Target: 4100$
💬 If you found this helpful, don’t forget to like, comment, and follow — I share setups like this every week!

ETHUSDT Classic Cup PatternEthereum is forming a textbook Cup pattern on the 1H chart, signaling a strong bullish setup. After a rounded bottom forming the “cup,” ETH is now pushing toward the neckline resistance around $3,870. A confirmed breakout above this level could lead to a powerful upward move.
Cheers
Hexa

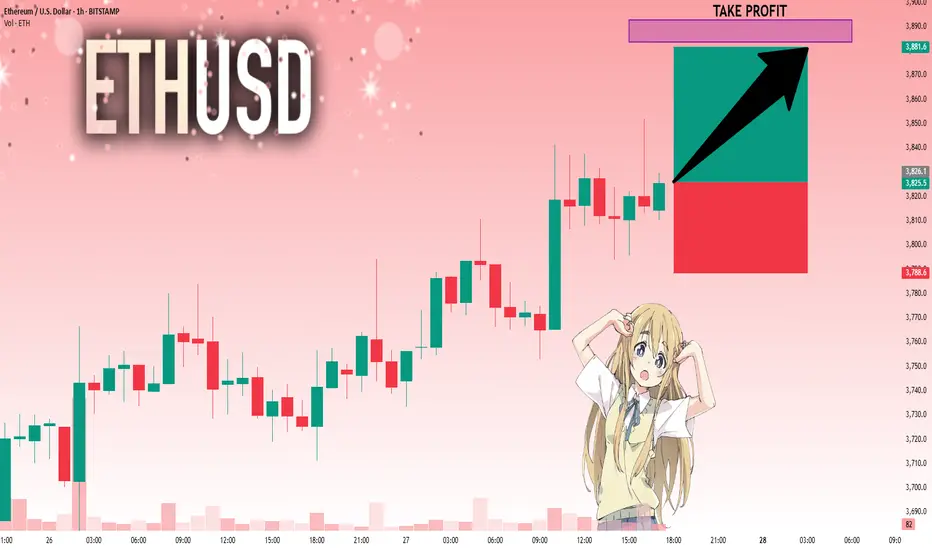
ETHUSD: Strong Bullish Sentiment! Long!
My dear friends,
Today we will analyse ETHUSD together☺️
The recent price action suggests a shift in mid-term momentum. A break above the current local range around 3,826.1 will confirm the new direction upwards with the target being the next key level of 3,883.6 and a reconvened placement of a stop-loss beyond the range.
❤️Sending you lots of Love and Hugs❤️
ETH - simple chart and mega moveEthereum is currently the strongest and most stable asset in the market, especially after many had lost hope in it.
Now, Ethereum is back with strength, and it’s just a few steps away from breaking out of the current pattern.
📈A breakout above the upper boundary will likely lead to a new all-time high (ATH) for ETH.
My projection: Ethereum could surpass $7,000 before the end of 2025.
Best regards:
Ceciliones🎯
Closing the Week on ETH 1H
ETH is about to close the week just above the 0.236 Fib level.
The 50MA is crossing this key level, and the 200MA is close behind — showing alignment across moving averages.
MLR > SMA > BB Center confirms the current uptrend.
Volume is picking up slightly, though it’s Sunday — so expectations remain tempered.
RSI is nearing overbought but still has room to push higher.
MACD supports the bullish momentum.
Taken together, these signs lean bullish for the weekly close.
But this is crypto — and anything can happen in the final hours.
We’ll be here to watch it unfold.
Always take profits and manage risk.
Interaction is welcome.

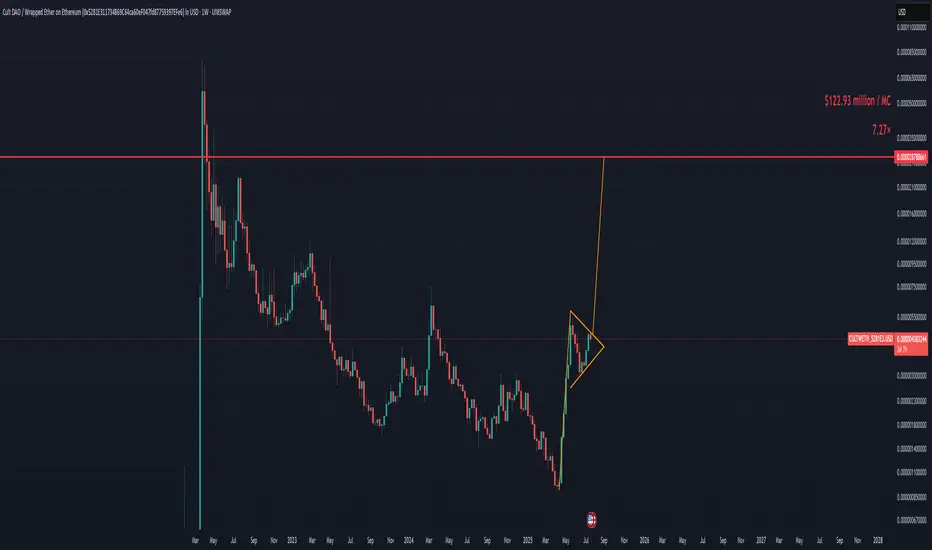
Brace for Impact: CULT DAO’s Bull Flag Points to Violent Upside!If you missed the last 500% wave from CULT DAO, fear not you’re just in time if you’re reading this.
My bottom call was slightly off, but since the lows, it's up 500% and it's just getting warmed up.
We are now forming a giant bull flag that will take CULT DAO straight to $122 million a 7.27x from this price.
I will be publishing CULT DAO TA’s until we hit a one billion dollar market cap, which we should reach sometime in Q4 2025.
Seeing a giant bull flag forming as we enter the final phase of the bull market is beautiful.
Prepare accordingly. Time is limited. We will blast off in under 30 days.
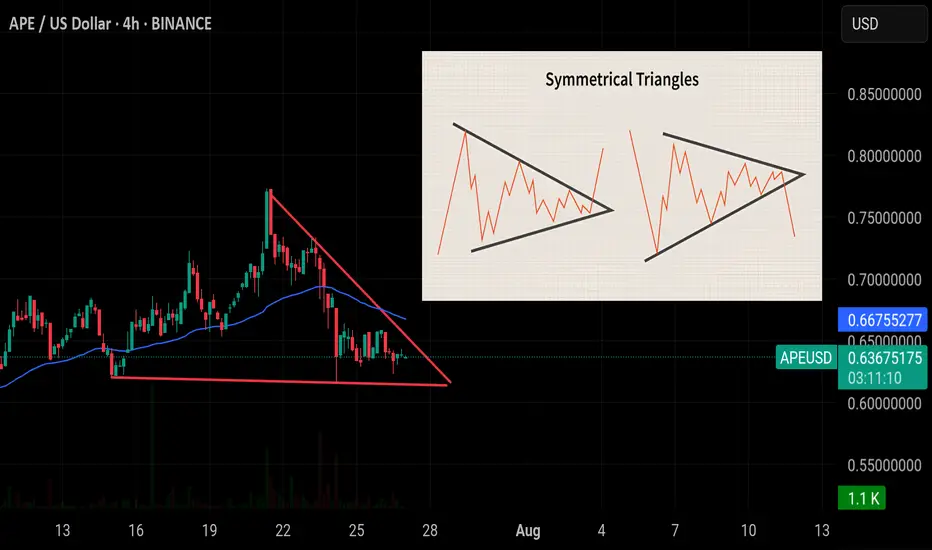
Symmetrical Triangle – Quick Guide 🕯A symmetrical triangle forms as price consolidates between two converging trendlines—one sloping up, the other down. It’s a neutral pattern, showing indecision.
📈 Breakout Direction Matters
Above = Bullish
Below = Bearish
🔍 Watch Volume:
It typically drops during formation and spikes on breakout—confirming the move.
✅ How to Trade:
Wait for a candle close outside the triangle on high volume
Enter in breakout direction
Stop-loss: just inside the triangle
⚠️ Pro Tip: Context matters—trend before the triangle often hints at breakout direction.
#Educational #btc #btcoin #eth
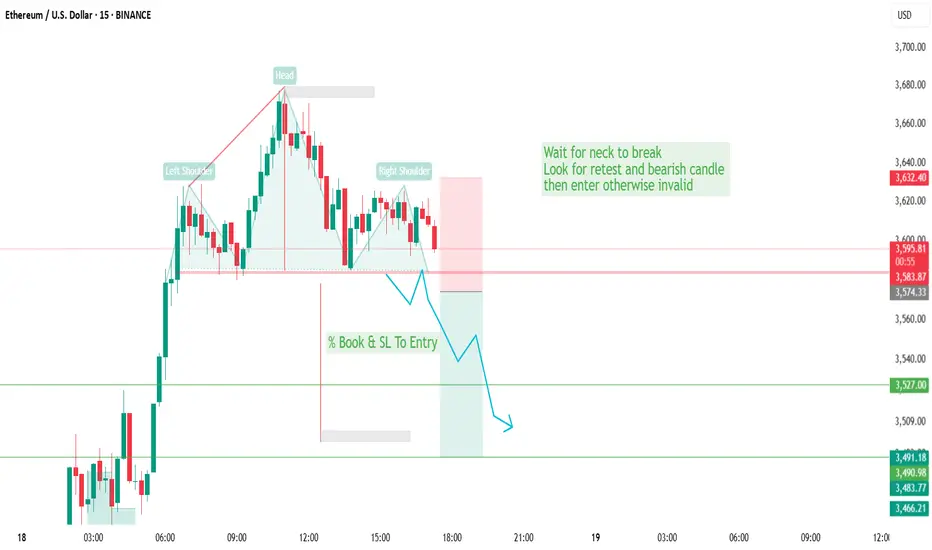
ETHUSDETH USD Conditional trade// High risk
Possible Head and shoulder in making
Wait for neck to break
Look for retest and bearish candle
then enter otherwise invalid
$ETH MAJOR FALLING TREND BREAKOUT!CRYPTOCAP:ETH MAJOR FALLING TREND BREAK AND RETEST COMPLETE.
Eth season seems to be just around the corner
MORE TO COME
ETH to $3700 Before a Major Bounce?Ethereum has been showing signs of exhaustion after its recent rally. I'm watching the $3700 level closely — it's a key support zone that has acted as both resistance and support in the past.
🟦 If ETH pulls back to this area, I expect it to find strong buying interest, potentially leading to a significant bounce and continuation of the bullish trend.
📌 Scenario I'm Watching:
🔻 Pullback to the $3700 support zone
📉 Shakeout or stop hunt below previous lows
💚 Followed by a strong bullish reversal — possible move toward $4000+
Why $3700?
Confluence of previous highs/lows
Psychological round number
Potential liquidity pocket
Not Financial Advice!
This is a scenario I'm tracking, not a guarantee. As always, wait for confirmation (e.g. bullish engulfing, RSI divergence, volume spike) before jumping in.
📉 If $3700 fails decisively, I'll reassess — next support likely around $3550–3600.

4:1 R:R for BTCBulls are likely to send it higher before the 120K breakout. This early setup is worth a try.
Entry: 118,200
Stop-loss: 115,000
Target: 135,000
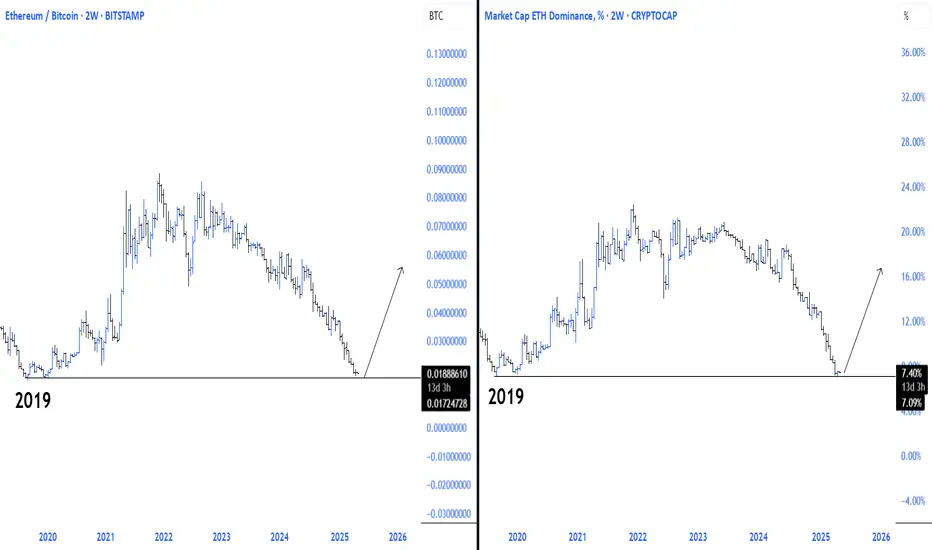
Ethereum Bitcoin pair bottom confirmed!As confirmed by CRYPTOCAP:ETH \ CRYPTOCAP:BTC momentum, we can say that a local bottom was seen at 2019 accumulation levels. With a major reversal from the current region, we can see major movements across Altcoins, with Ethereum being an undeniable leading force and leader for altcoins.

ETHBTC x ETH.DETHBTC x ETH.D
Ethereum bitcoin pair and ethereum dominance will gain upward momentum with the reaction it receives from the major support line in 2019
The better Ethereum is, the better Altcoins will be.
BTC setup looks good for 5R.Looks like BTC is about to make another leg up toward 135K. Playing a 5:1 R:R on this setup
Entry: 119,000
Stop Loss: 116,000
Target: 135,000

ETHUSD Will Go Down From Resistance! Sell!
Here is our detailed technical review for ETHUSD.
Time Frame: 1D
Current Trend: Bearish
Sentiment: Overbought (based on 7-period RSI)
Forecast: Bearish
The market is testing a major horizontal structure 3,641.87.
Taking into consideration the structure & trend analysis, I believe that the market will reach 2,871.15 level soon.
P.S
Overbought describes a period of time where there has been a significant and consistent upward move in price over a period of time without much pullback.
Disclosure: I am part of Trade Nation's Influencer program and receive a monthly fee for using their TradingView charts in my analysis.
Like and subscribe and comment my ideas if you enjoy them!
