Ethereumanalysis

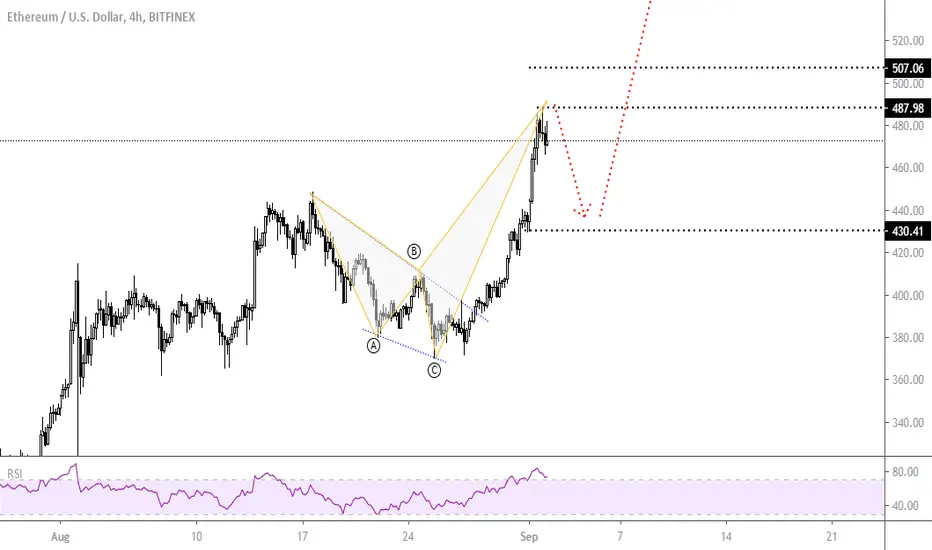
Ethereum is ready to pullbackI am expecting a 5-0 pattern here, I anticipate a decline to 430 price region before the bullish move continuation.
ETH/USD Rockets To 2-Year Highs Technical Analysis (09/01/2020)Technical Analysis 1 September 2020
Ethereum (ETH/USD) extended recent gains early in today’s North American session as the pair appreciated to the 473.53 area after trading as low as the 428.65 area during the Asian session. Stops were elected above the 474.59 area, an upside price objective that represents the 50% retracement of the historical depreciation from 828.97 to 80.60. Additional upside price objectives include the 487.55, 498.68, 516.03, 517.38, 531.80, and 543.09 areas. The pair’s ongoing upward momentum was confirmed yesterday when buying pressure emerged around the 418.79 area during a pullback, representing the 61.8% retracement of the historical depreciation from 627.83 to 80.60. Stops were elected below the 398.91, 397.08, 396.37, 392.67, 386.63, 384.29, and 382.47 areas during the pair’s recent depreciation from the 447.50 area, and traders are curious to see if these levels provide any technical support during pullbacks.
The 396.69 area remains an important technical level, representing the 23.6% retracement of the historical depreciation from 1419.96 to 80.60. Following the pair’s recent appreciation, important technical levels include the 416.00, 409.64, 389.91, 383.02, 374.83, and 360.04 areas. Traders are observing that the 50-bar MA (4-hourly) is bearishly indicating below the 100-bar MA (4-hourly) and above the 200-bar MA (4-hourly). Also, the 50-bar MA (hourly) is bullishly indicating above the 100-bar MA (hourly) and above the 200-bar MA (hourly).
Price activity is nearest the 100-bar MA (4-hourly) at 407.83 and the 50-bar MA (Hourly) at 433.80.
Technical Support is expected around 349.75/ 331.95/ 315.08 with Stops expected below.
Technical Resistance is expected around 487.55/ 498.68/ 516.03 with Stops expected above.
On 4-Hourly chart, SlowK is Bearishly below SlowD while MACD is Bullishly above MACDAverage.
On 60-minute chart, SlowK is Bearishly below SlowD while MACD is Bullishly above MACDAverage.
Yesterdays Technical Analysis 31 August 2020 ETH
Ethereum (ETH/USD) added to recent gains early in today’s North American session as the pair appreciated to the 439.00 area after trading as low as the 418.16 area during the European session. Some Stops were elected above the 438.40 area during the ascent higher, representing the 78.6% retracement of the recent depreciation from 445.45 to 412.51. Traders had earlier pushed the pair as high as the 439.00 area during the Asian session before profit-taking knocked ETH/USD lower. Recently, bids emerged above the 377.44 area, representing a test of the 61.8% retracement of a recent appreciating range from 362.88 to 401.00. Stops were elected below the 398.91, 397.08, 396.37, 392.67, 386.63, 384.29, and 382.47 areas during the pair’s recent depreciation from the 447.50 area. Following the pair’s recent depreciation from the 447.50 level to the 379.53 area, traders are eyeing upside retracement levels around the 395.57, 405.49, 413.52, 421.54, and 431.46 areas. The 396.69 area remains an important technical level, representing the 23.6% retracement of the historical depreciation from 1419.96 to 80.60. Following the pair’s prior run-up, important technical levels include the 414.17, 396.12, 392.67, 383.53, 376.90, 363.13, and 358.75 areas. Recently, the pair has encountered buying pressure around the 23.6% retracement of the appreciating range from 268.39 to 415.00, and downside retracement levels in this appreciating range include the 373.89, 364.70, 355.50, 344.13, and 342.42 areas.
Afte recently taking out the 445.45 level, one upside price objective is the 454.79 areas. Stops were recently elected above the 336.10, 337.33, 342.29, 350.44, 354.22, 366.48, and 369.26 areas during the move higher. Recently, bids emerged just above the 314.07 area, a level that represents the 50% retracement of the broad historical depreciation from the 547.54 to 80.60. A couple of interesting levels that traders will observe during retracements lower include the 301.20 and 301.40 areas, and they are related to buying pressure that emerged around the 241.62 and 319.86 areas. Likewise, the 312.82, 316.32, and 322.16 levels are areas with important technical significance. Chartists are observing that the 50-bar MA (4-hourly) is bearishly indicating below the 100-bar MA (4-hourly) and above the 200-bar MA (4-hourly). Also, the 50-bar MA (hourly) is bullishly indicating above the 100-bar MA (hourly) and above the 200-bar MA (hourly).
Price activity is nearest the 100-bar MA (4-hourly) at 406.75 and the 50-bar MA (Hourly) at 418.57.
Technical Support is expected around 349.75/ 331.95/ 315.08 with Stops expected below.
Technical Resistance is expected around 454.79/ 487.55/ 498.68 with Stops expected above.
On 4-Hourly chart, SlowK is Bullishly above SlowD while MACD is Bullishly above MACDAverage.
On 60-minute chart, SlowK is Bearishly below SlowD while MACD is Bearishly below MACDAverage.

ETH/USD Thwarted By 200-Hour Simple Moving AverageEthereum (ETH/USD) found a small bid early in today’s North American session as the pair appreciated to the 412.04 area after trading as low as the 393.75 area earlier in the Asian session. Stops were reached below the 401.57 area during the pair’s move lower, a relative low from earlier this week, with further Stops elected below the 398.91 and 397.08 areas. Buying pressure emerged above the 392.67 area, representing the 38.2% retracement of the recent appreciation from 215.16 to 447.50. Chartists are noting that the pair has recently been capped around or below the 100-bar simple moving average on 4-hourly charts. Following the pair’s recent depreciation from the 447.50 level to the 393.75 area, traders are eyeing upside retracement levels around the 413.05, 419.63, 426.20, 434.34, and 435.57 areas. The 396.69 area remains an important technical level, representing the 23.6% retracement of the historical depreciation from 1419.96 to 80.60. Following the pair’s recent run-up, important technical levels include the 414.17, 396.12, 392.67, 383.53, 376.90, 363.13, and 358.75 areas. Recently, the pair has encountered buying pressure around the 23.6% retracement of the appreciating range from 268.39 to 415.00. Downside retracement levels in this appreciating range include the 373.89, 364.70, 355.50, 344.13, and 342.42 areas.
After recently taking out the 445.45 level, one upside price objective is the 454.79 areas. Stops were recently elected above the 336.10, 337.33, 342.29, 350.44, 354.22, 366.48, and 369.26 areas during the move higher. Recently, bids emerged just above the 314.07 area, a level that represents the 50% retracement of the broad historical depreciation from the 547.54 to 80.60. A couple of interesting levels that traders will observe during retracements lower include the 301.20 and 301.40 areas, and they are related to buying pressure that emerged around the 241.62 and 319.86 areas. Likewise, the 312.82, 316.32, and 322.16 levels are areas with important technical significance. Chartists are observing that the 50-bar MA (4-hourly) is bullishly indicating above the 100-bar MA (4-hourly) and above the 200-bar MA (4-hourly). Also, the 50-bar MA (hourly) is bearishly indicating below the 100-bar MA (hourly) and below the 200-bar MA (hourly).
Price activity is nearest the 100-bar MA (4-hourly) at 404.78 and the 50-bar MA (Hourly) at 413.54.
Technical Support is expected around 349.75/ 331.95/ 315.08 with Stops expected below.
Technical Resistance is expected around 454.79/ 487.55/ 498.68 with Stops expected above.
On 4-Hourly chart, SlowK is Bullishly above SlowD while MACD is Bearishly below MACDAverage.
On 60-minute chart, SlowK is Bearishy below SlowD while MACD is Bullishly above MACDAverage.
Title :ETH/USD BUY LIMIT ORDER
Asset : Crypto
Symbol : ETH/USD
Type : Limit Order
Time Frame : 4hr
Entry Price 1 : $331.00
Entry Price 2 : $306.00
Stop Loss : $296.00
Take Profit 1: $371.00
Take Profit 2 : $406.00
Take Profit 3: $451.00
Trail your stop loss
Take profit 4 $487.00
Take profit 4 $506.00
ETHEREUM is set to move higherA breakout of 400 will pave way for a further bullish move to 420 - 430 price region .

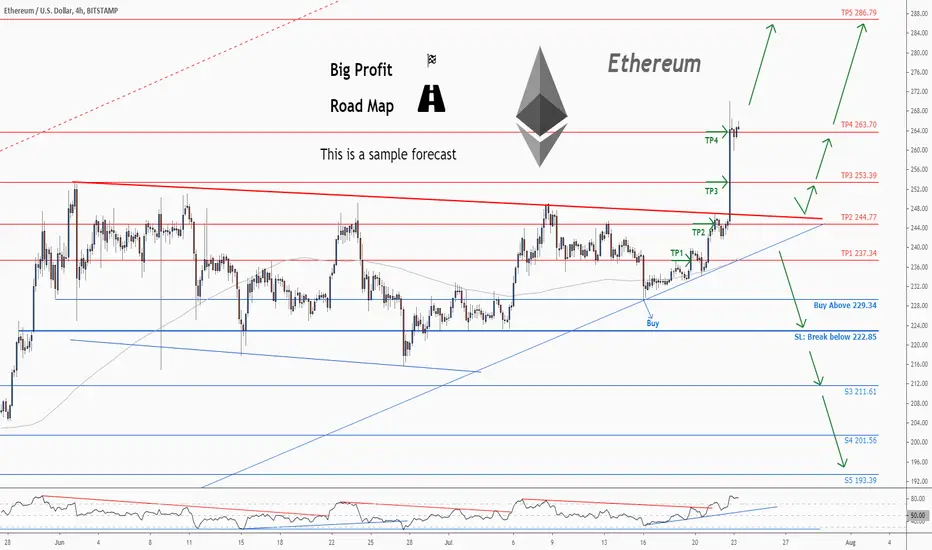
ETHUSD Update: Profit=13929 pip SL=3245 pip Reward/Risk > 4.3:1 Trade Setup summary:
Profit targets=13929 pip (800 + 1543 + 2405 + 3436 + 5745)
Stop Loss = 3245 pip
Reward/Risk > 2.6 : 1
Current Status:
Total Profit: 11684 pip
Closed trade(s): 8184 pip Profit
Open trade(s): 3500 pip Profit
Trade Setup:
We opened 5 BUY trade(s) @ 229.34 based on 'previous Forecast' at 2020.07.06 :
Closed Profit:
TP1 @ 237.34 touched at 2020.07.20 with 800 pip Profit.
TP2 @ 244.77 touched at 2020.07.21 with 1543 pip Profit.
TP3 @ 244.77 touched at 2020.07.22 with 2405 pip Profit.
TP4 @ 263.70 touched at 2020.07.22 with 3436 pip Profit.
800 + 1543 + 2405 + 3436= 8184
Open Profit:
Profit for one trade is 264.34 (current price) - 229.34 (open price) = 3500 pip
1 trade(s) still open, therefore total profit for open trade(s) is 3500 x 1 = 3500 pip
Break Even 229.34
Technical analysis:
. ETHUSDis in a range bound and the beginning of uptrend is expected.
.The price is above the 21-Day WEMA which acts as a dynamic support.
. The RSI is at 83.
Trading suggestion:
. There is still a possibility of temporary retracement to suggested support line (244.77) again. if so, traders can set orders based on Price Action and expect to reach short-term targets.
Take Profits:
TP5= @ 286.79
❤️ If you find this helpful and want more FREE forecasts in TradingView
. . . . . Please show your support back,
. . . . . . . . Hit the 👍 LIKE button,
. . . . . . . . . . . Drop some feedback below in the comment!
❤️ Your Support is very much 🙏 appreciated! ❤️
💎 Want us to help you become a better Forex trader ?
Now, It's your turn !
Be sure to leave a comment let us know how do you see this opportunity and forecast.
Trade well, ❤️
ForecastCity English Support Team ❤️
#ETHUSD ANALYSIS.. BEARS ARE READY.. I think investors should pay attention to death cross that took place in Ethereum a while ago, in this context, the possibility that the trend might reverse for Ethereum should not be ignored..
Death cross can have an effect like a short upward movement firstly and a deep correction phase for a long time.. In the technical indicators, the T3 curve may return to negative in the near future, and the coppock curve has turned its direction downward.. There is no clear sell signal yet, but in my opinion there are some leading indicators that the bears will take control the market.. I expect a price movement in #ETHUSD as I mentioned in the chart..
Disclaimer: What I wrote is not investment advice.. Please do your own due diligence when it comes to crypto-investing.. Never put in money that you cannot afford to lose.. Invest at your own risk..
I wish you all the best..
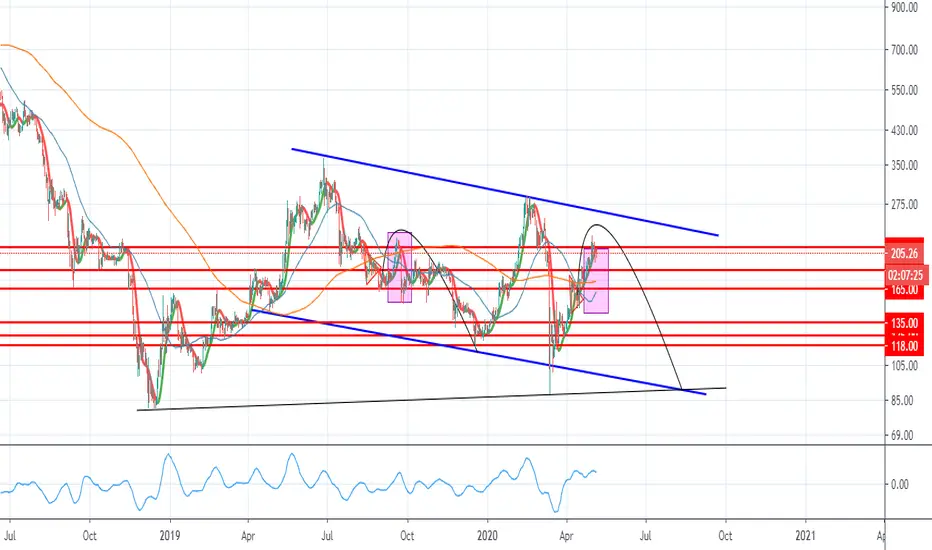
ETH|USD - TRADE SET UPS/OVERVIEWPrice activity is nearest the 50-bar MA (4-hourly) at 162.37 and the 50-bar MA (Hourly) at 173.28.
Technical Support is expected around 153.22/ 149.31/ 146.77 with Stops expected below.
Technical Resistance is expected around 185.38/ 196.54/ 206.29 with Stops expected above.
On 4-Hourly chart, SlowK is Bearishly below SlowD while MACD is Bullishly above MACDAverage.
On 60-minute chart, SlowK is Bearishly below SlowD while MACD is Bullishly above MACDAverage.
Ethereum (ETH/USD) gave back some gains in today’s North American session as the pair peaked around the 185.38 area. Stops were reached above the 177.39 area, a downside price objective related to selling pressure that emerged around the 252.99 area in March, and this represents ETH/USD’s strongest showing since then. Additional Stops were elected above the 184.01 area, an upside price objective related to buying pressure that originated around the 90.00 area, and intensified around the 148.08 area. Some buying pressure emerged around the 170.04 area during a pullback in Thursday’s North American session and yesterday’s Asian session, a level that represents the 76.4% retracement of the depreciation from 176.82 to 148.08. Below current price activity, traders will be curious to see how price activity will react around the 154.57 and 149.31 levels, representing the 61.8% and 76.4% retracements of the appreciation from 140.81 to 176.82. Another important range that traders are monitoring is the appreciation from 123.82 to 176.72, with the 150.27 level representing the 50% retracement and the 144.00 level representing the 61.8% retracement.
Another very important level that traders are watching is the 159.62 level, an upside price objective related to buying pressure that emerged around the 90.00 level in March. If the pair is able to resume its upward trajectory above current price activity, additional upside price objectives include the 196.54 and 206.29 levels. Below current price activity, downside price objectives include the 144.00, 140.81, and 136.25 levels. Chartists are observing that the 50-bar MA (4-hourly) bullishly continues to indicate above the 100-bar MA (4-hourly) and 200-bar MA (4-hourly). Also, the 50-bar MA (hourly) bullishly continues to indicate above the 100-bar MA (hourly) and 200-bar MA (hourly).
ETHBTC Breakout Not Happening YetETHBTC breakout on 3 day chart shows rejection on the past 2 candles suggesting that now is not the time for ETHUSD to accelerate beyond BTCUSD. Some more consolidation and then we'll re-evaluate.

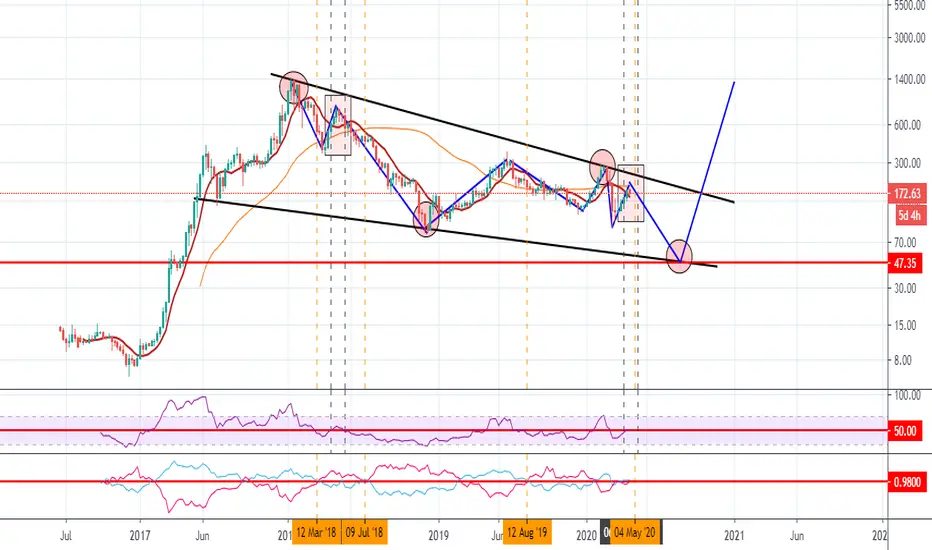
#ETHUSD.. DOMINATION OF BEARS WILL END SOON BUT FIRST... Bears will dominate the whole market for a while, but I firmly believe that these are the last zig-zags before a new market cycle..
We see wedge pattern on #ETHUSD weekly chart and I think, as I mentioned in the graphic, we will find the bottom we have been looking for for a long time.. I think the reference value of rsi 50 is very important, in this context, we can see a fractal as the leading indicator that sales will get harder soon, we will wait and see.. Also, the value of 0.95 for vortex has worked quite meaningfully from the past to the present, as it can be seen in the weekly chart of Ethereum, the value in question produces important clues for us and should be watched carefully in the future..
All these arguments point to a negative process in the medium term, my personal opinion is that Ethereum will drop up to $ 47 and gives a serious buying opportinuty before a new market cycle..
Sometimes you need to break your knees a bit more to jump higher..
Disclaimer: I am not a financial advisor.. Please do your own due diligence when it comes to crypto-investing.. Never put in money that you cannot afford to lose.. Invest at your own risk..
I wish you all the best..
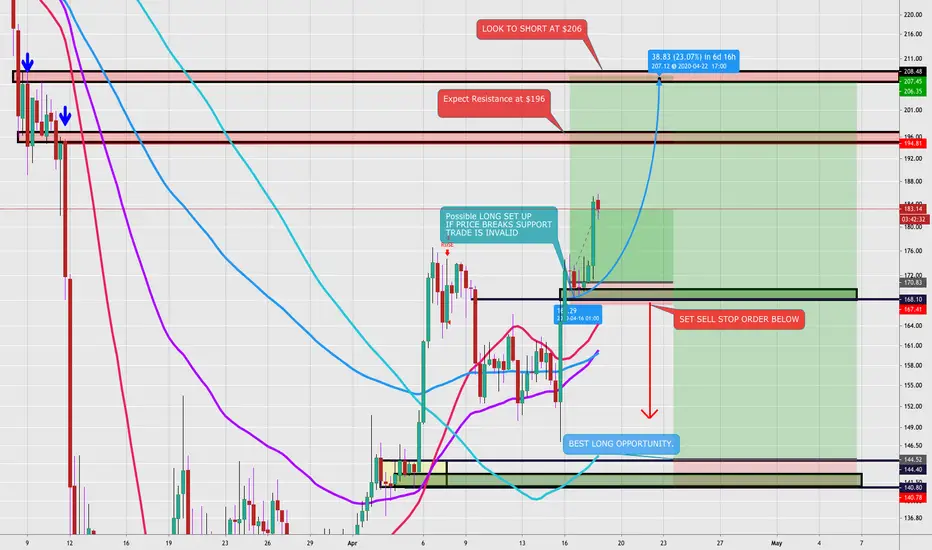
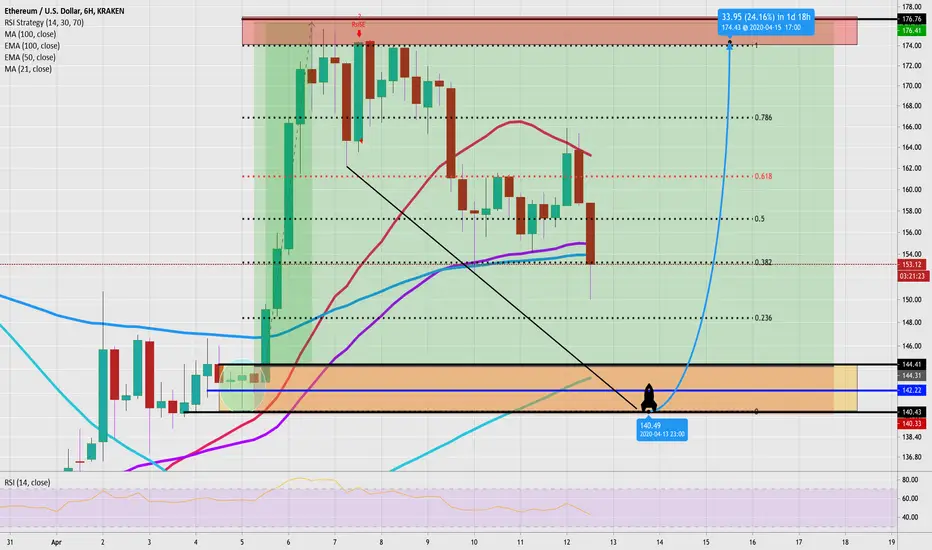
ETH/USD LONG SET UP TO RETEST $176.00Title :ETH/USD BUY LIMIT ORDER
Asset : Crypto Symbol : ETH/USD
Type : Limit Order Time Frame : 4hr
Entry Price 1 : $148.86 Entry Price 2 : $144.48
Stop Loss : $139.48
Take Profit 1: $153.86 TP 2: $158.46
TP3: $163.86 TP.4 $176.48
Price activity is nearest the 50-bar MA (4-hourly) at 159.57 and the 100-bar MA (Hourly) at 163.28.
Technical Support is expected around 153.22/ 149.31/ 146.77 with Stops expected below.
Technical Resistance is expected around 164.56/ 167.45/ 176.82 with Stops expected above.
On 4-Hourly chart, SlowK is Bullishly above SlowD while MACD is Bearishly below MACDAverage.
On 60-minute chart, SlowK is Bullishly above SlowD while MACD is Bullishly above MACDAverage.
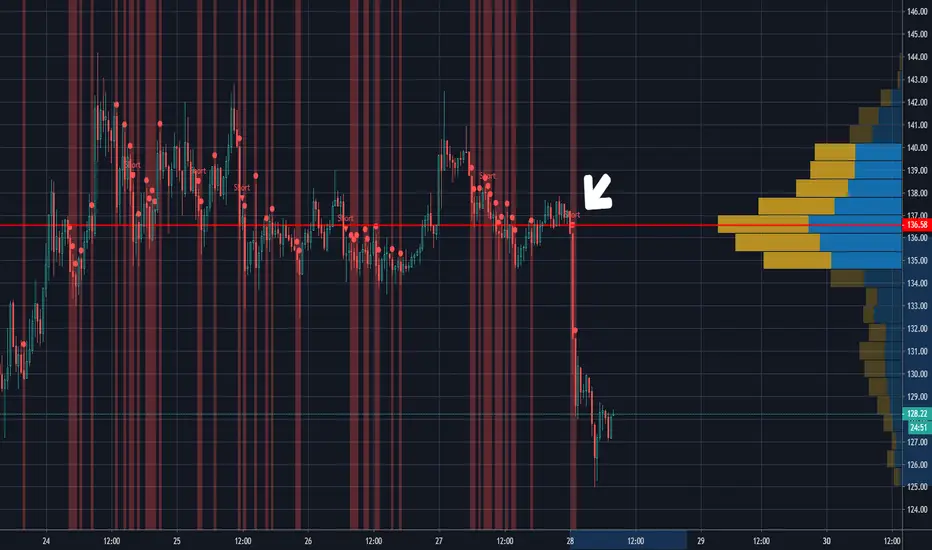
ENLA Auto Indicator called the Short on ETH for around 8% ProfitPossible Head & Shoulders with pump back in the upcoming week.
Crypto was build for Financial Crisis but the actually Situation is not just a financial crisis, it is more like the people need the Money for life and to protect theyr Businesses.
NO FINANCIAL ADVISE
ETH/USD LONG SET UP ON PULLBACKLast week’s major sell-off saw ETH/USD experience one of its most dramatic sell-offs ever, a move that exacerbated the downturn from the 290.00 area that began in February. Traders exited long positions and decoupled from risk associated with ETH/USD and a series of major Stops were triggered during the crushing move lower at many levels. These price areas included the 177.39, 161.62, 154.03, 133.40, 130.67, 105.18, and 101.76 levels. Additional downside price objectives include the 111.69, 103.40, 95.66, 90.00, and 80.60 levels.
MavRich Premium Signals (Faris Issa)
Title :ETH/USD BUY LIMIT ORDER
Asset : Crypto Symbol : ETH/USD
Type : Limit Order
Time Frame : 1Month
Entry Price 1 : $96.68
Entry Price 2 : $82.50
Stop Loss : $72.68
Take Profit 1: $120.68
TP 2: $132.50
TP3: $140.50
TP.4 $160.68
Price activity is nearest the 50-bar MA (4-hourly) at 158.83 and the 50-bar MA (Hourly) at 120.51.
Technical Support is expected around 100.15/ 95.66/ 80.60 with Stops expected below.
Technical Resistance is expected around 125.08/ 133.37/ 140.95 with Stops expected above.
On 4-Hourly chart, SlowK is Bearishly below SlowD while MACD is Bullishly above MACDAverage.
On 60-minute chart, SlowK is Bullishly above SlowD while MACD is Bullishly above MACDAverage
ETH 4H DivergenceBullish divergence on the 4H chart, this may result in a short term upside. My 'bait' wick analysis was incorrect, and i apologize to anyone that entered a trade. I will link it. This divergence shows promise for the short term, and margin / leverage traders however. Fortune favors the bold! Currently analyzing the success rate of these divergences.

Ethereum SHORTwe can stop in this zone 0.38 fibonacci and continue towards the objective or complete the B wave in the marked area
ETH cap wide trading rangeETH cap can be seen to have a wide trading range, as indicated by the support and resistance provided by the parallel channel that is currently present. Massive opportunity for upsides.

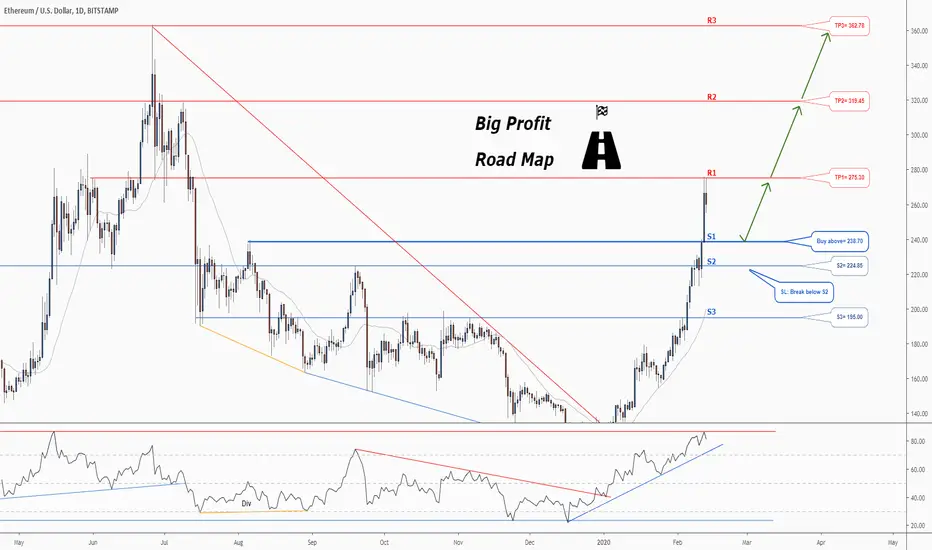
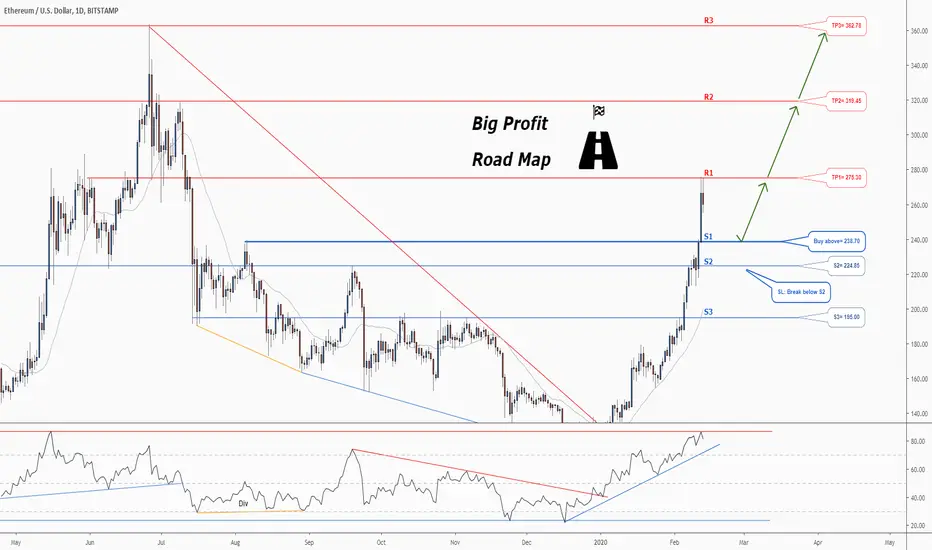
Don't miss the great buy opportunity in ETHUSDTrading suggestion:
. There is a possibility of temporary retracement to suggested support line (238.70). if so, traders can set orders based on Price Action and expect to reach short-term targets.
Technical analysis:
. ETHUSD is in a Uptrend and the Continuation of uptrend is expected.
.The price is above the 21-Day WEMA which acts as a dynamic support.
. The RSI is at 80.
Take Profits:
TP1= @ 275.30
TP2= @ 319.45
TP3= @ 362.75
SL= Break below S2

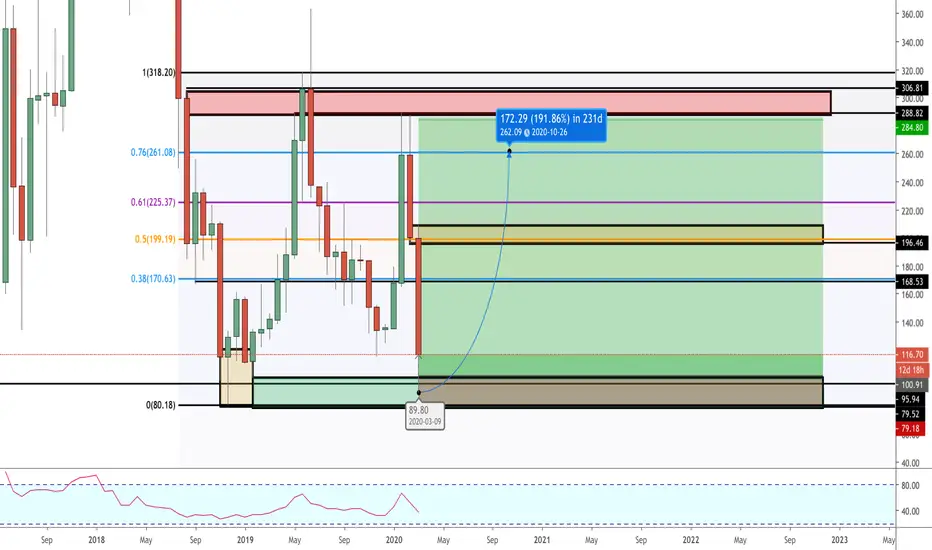
Ethereum : Double Bottom pattern.Ethereum : Double Bottom pattern.
Note: This is only for Educational purposes; this is not investment advice.
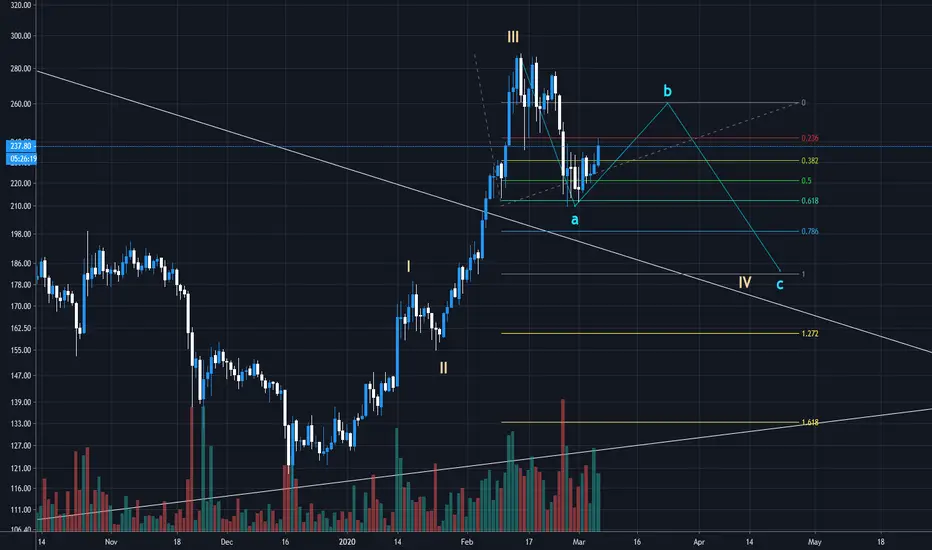
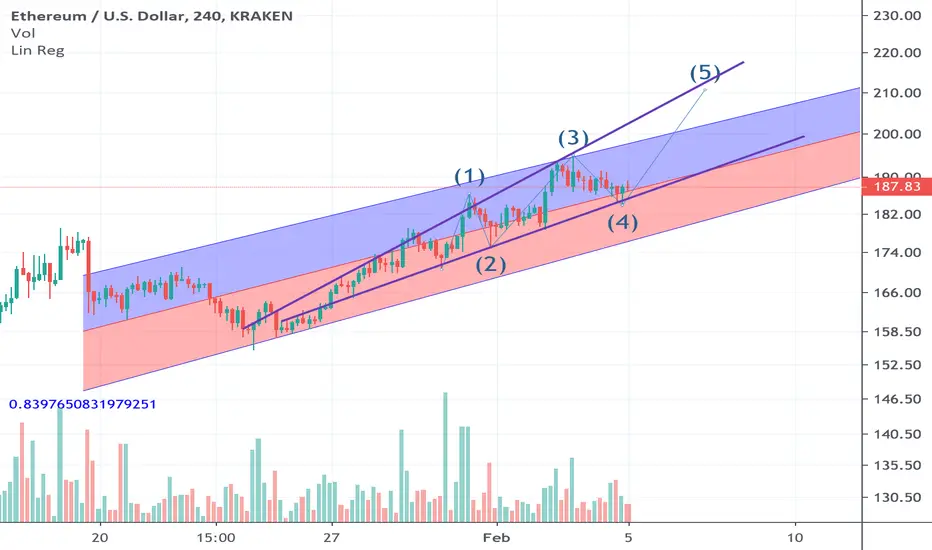
ETHUSD Elliot Impulse WaveElliot impulse wave, currently beginning 5th wave, supported by a strong linear regression uptrend. 4H chart. Broadening ascending wedge.
Ethereum - $ETH - Heads-Up! I am Very optimist. The price close weekly above $166.75 a green candle in $ETH is coming.
Would be impressive though...
I really thought that we would see a retracement... but here we are... Welcome to trading.
Next levels to focus on are $167.4 and $174.
Reaching $174 will be a bullish heads up! Come on $ETH!
#ETHEREUM #CRYPTO

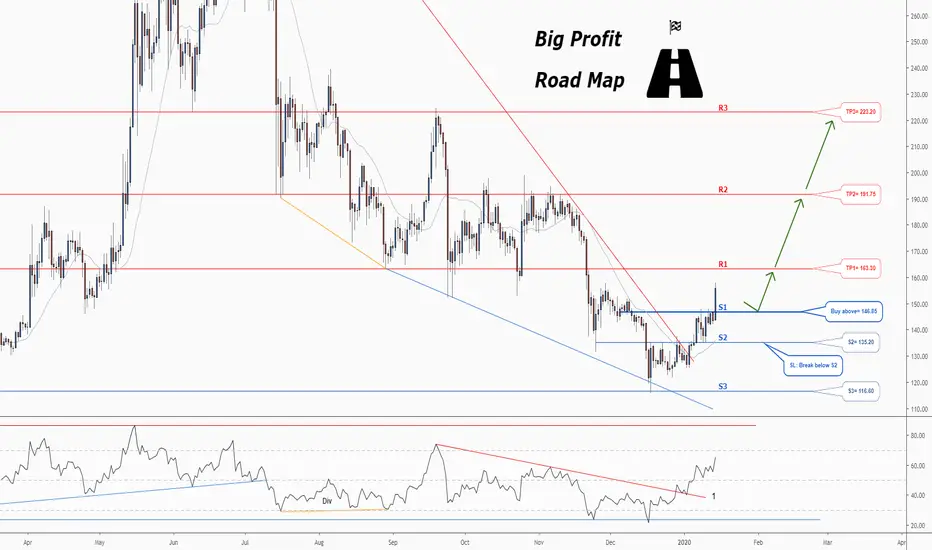
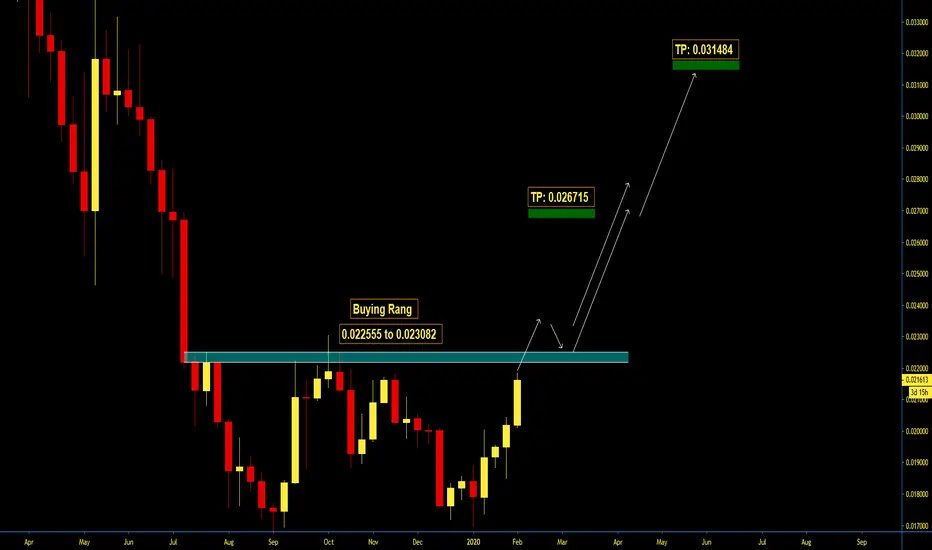
Don't miss the great buy opportunity in ETHUSDTrading suggestion:
. There is a possibility of temporary retracement to suggested support line (146.85). if so, traders can set orders based on Price Action and expect to reach short-term targets.
Technical analysis:
. Ethereum/US Dollar is in a range bound and the beginning of uptrend is expected.
.The price is above the 21-Day WEMA which acts as a dynamic support.
. The RSI is at 65.
. The RSI downtrend #1 is broken, so the probability of beginning of uptrend is increased.
Take Profits:
TP1= @ 163.30
TP2= @ 191.75
TP3= @ 223.20
SL= Break below S2