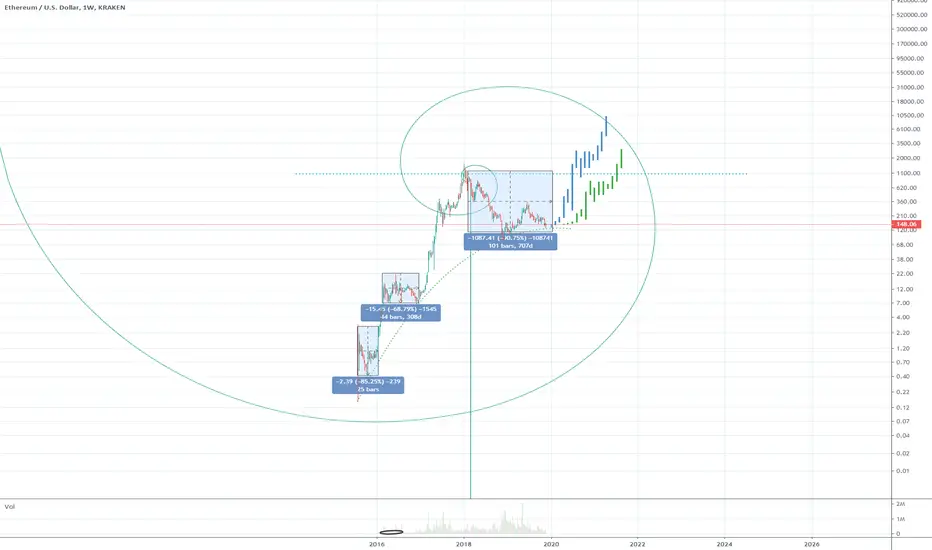
My first ever fractalConstructive criticism encouraged! I'm new to fractals and they seem to be a great and very exciting tool for trading, long term Ethereum chart.
Ethereumanalysis
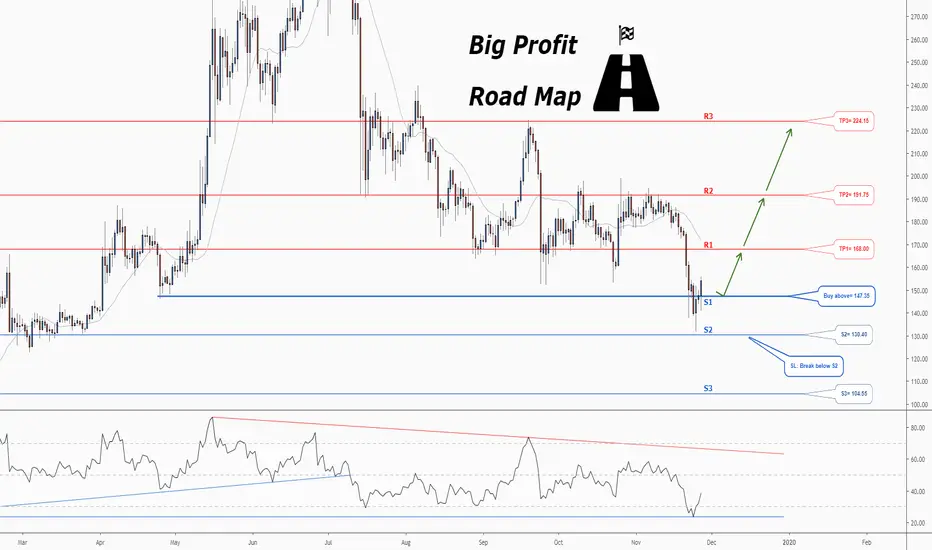
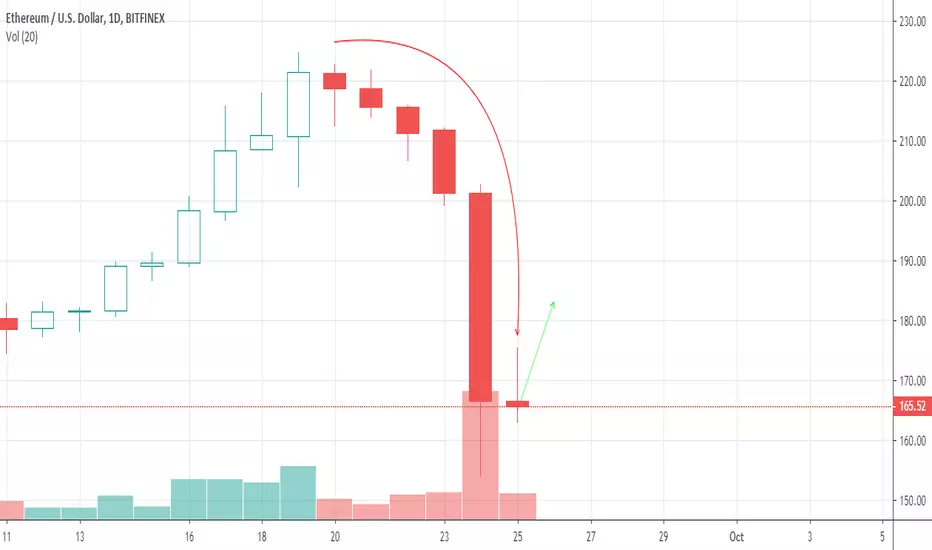
Don't miss the great buy opportunity in ETHUSDTrading suggestion:
. There is a possibility of temporary retracement to suggested support line (147.35). if so, traders can set orders based on Price Action and expect to reach short-term targets.
Technical analysis:
. ETHUSD is in a range bound and the beginning of uptrend is expected.
. The price is below the 21-Day WEMA which acts as a dynamic resistance.
. The RSI is at 38.
Take Profits:
TP1= @ 168.00
TP2= @ 191.75
TP3= @ 224.15
SL= Break below S2
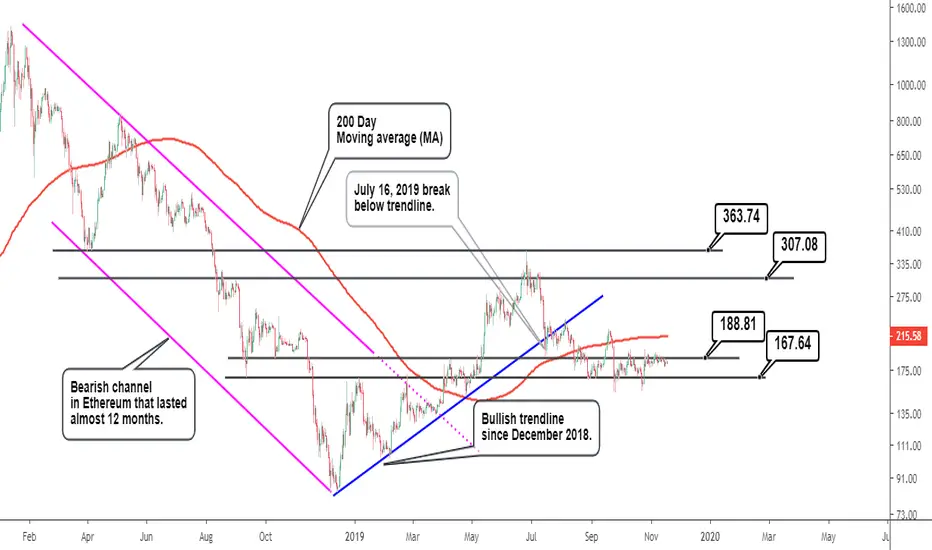
Ethereum Analysis: Daily Timeframe Conclusion for today's Ethereum Analysis: Price closing below ~176.49 implies more downside momentum in Ethereum.
The Daily timeframe (log scale) is examined in today's Ethereum analysis. Chart patterns examined that are plotted include a bearish price channel and a bullish trendline. The 200 day moving average is also plotted to help provide perspective for future development of price action. December 15, 2018 price swing that reached the 363.30 price peak (on June 26, 2019) has since been followed by a downtrend in Ethereum.
Part of the current downtrend includes a July 16, 2019 break below the long term bullish trendline that lasted over 6 months. Price action also did break below the 200 moving average after closing below the bullish trendline, adding to a current bearish bias in Ethereum.
Price levels plotted on the chart offer areas of support (188.81 to 167.64) and resistance (363.74 to 307.08) for Ethereum and need to be monitored closely for bullish or bearish swings. A close above the 200 day moving average is bullish and implies price resuming an uptrend that should reach the resistance zone at the minimum.
A break below 176.49 on the other hand improves the chances of continuing the downtrend from June 26, 2019.
Ethereum market cap update 11.6.2019Possible reversal point incoming on didi index. Also increasing momentum on TSI. Possibly very bullish immediately above 20B :)

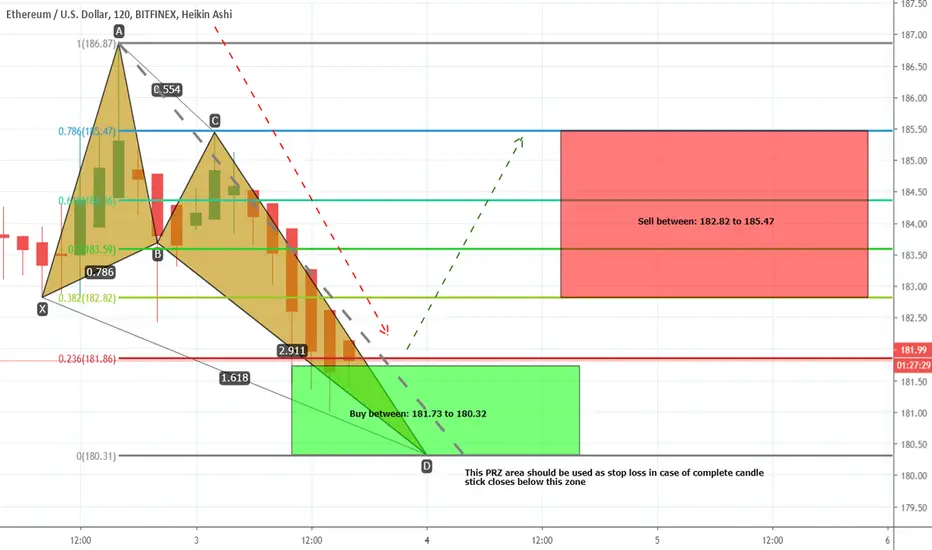
ETHUSD formed bullish Butterfly | A long opportunityPriceline of Ethereum / US Dollar cryptocurrency has formed a bullish Butterfly pattern and entered in potential reversal zone.
This PRZ area should be used as stop loss in case of complete candle stick closes below this zone.
I have used Fibonacci sequence to set the targets:
Buy between: 181.73 to 180.32
Sell between: 182.82 to 185.47
Regards,
Atif Akbar (moon333)
Ethereum Price Analysis: 3 Things You Must KnowConclusion for today's Ethereum Analysis: A break above ~196.88 is required as a minimum to consider any bullish position(s) in Ethereum.
Ethereum Analysis for today is presented on a log scale on the Daily timeframe. Price action from December 17, 2019 shows an overall upswing, followed by a bearish trend since June 25, 2019.
Three crucial points to keep in mind that provide context for Ethereum’s future price development are the following:
(1) Falling Wedge chart pattern: Part of the establishment of the falling wedge includes a break below the previous bullish price channel that lasted over 7 months. The falling wedge is currently active, but eventually implies a bullish breakout for Ethereum.
(2) 200 Day moving average: A break below the 200 day moving average on September 22, 2019 is bearish for Ethereum and price has traded under the average ever since then. Added confirmation of more momentum to the downside involves the 200 day moving average slope changing from zero to negative.
In such a scenario, a break below the lower boundary of the wedge would be anticipated as opposed to an upside breakout (ideal implication of a falling or descending wedge).
(3) Price level between 196.88 and 153.02: The aforementioned price level is important to watch in Ethereum as price has already successfully tested the lower boundary of the range on September 24, and 27, 2019. Another successful test occurring on October 23, 2019 improves the chances of the 153.02 level offering support for the price of Ethereum.
Momentum indicators can also be used to used to provide added confirmation of potential support. The upper region of the boundary at ~196.88 is tentative. Price reaching 196.88 and failing to close above it could serve as a breeding ground for more selling.
Conservative strategies to buy Ethereum includes waiting for price to close above 196.88 and also Ethereum’s 200 day moving average.

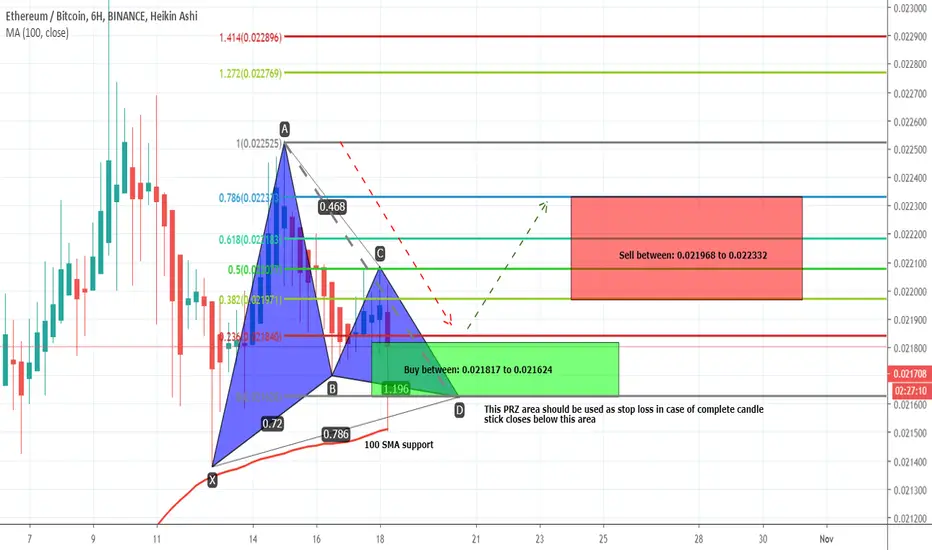
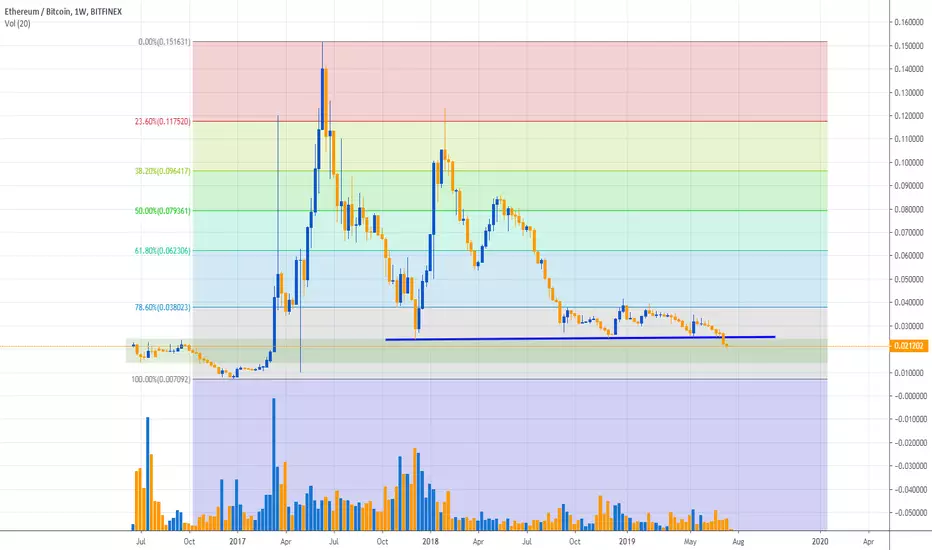
ETHBTC formed bullish Gartley | A good long opportunityPriceline of Ethereum / Bictoin has formed a bullish Gartley pattern and entered in potential reversal zone.
This PRZ area should be used as stop loss in case of complete candle stick closes below this area.
We have a strong support of 100 simple moving average beneath the PRZ level.
I have used Fibonacci sequence to set the targets:
Buy between: 0.021817 to 0.021624
Sell between: 0.021968 to 0.022332
Regards,
Atif Akbar (moon333)
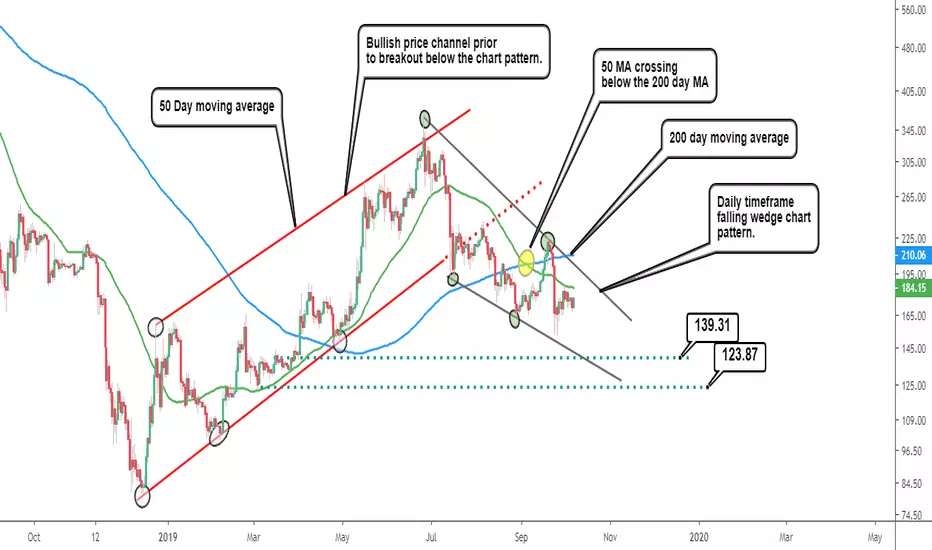
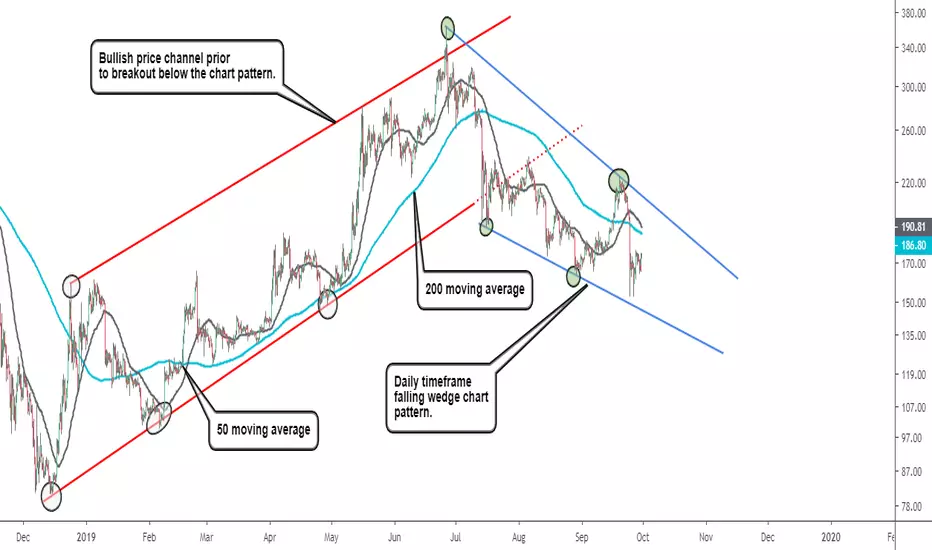
Ethereum analysis: Daily Timeframe Chart Patterns and 3 Things YConclusion for today’s Ethereum technical analysis: Key support for Ethereum lies between 123.87 and 139.31. A break below 123.87 implies more selling ahead...
The Daily timeframe chart is used in today’s Ethereum analysis (log scale) to provide the alternatives for future price action.
The previous uptrend in Ethereum from December 2018 to June 2019 has been broken to the downside (i.e. confirmation or close of price outside of bullish channel) and price remaining in the current downtrend.
The following are 3 important ideas and/or areas to focus on for future development in Ethereum price.
(1) Current falling wedge chart pattern (tentative): The downside motion of price from the June 25, 2019 peak to current date is captured using a falling wedge (or falling diagonal).
Eventual resolution to the upside is anticipated i.e. a break above the upper boundary of the wedge. This therefore presents a foundation for considering long positions from a conservative point of view with risk: reward ratios calculated accordingly before attempting a long (bullish) trade.
(2) Action of the 200 Day and 50 moving average: The 50 day moving average did cross below the 200 day moving average on September 4, 2019. This implies bearish sentiment in Ethereum is still active and reduces the chance of bullish momentum developing. Price action at the minimum should therefore close above the 50 moving average before the potential for any bullish trade can be considered. Even better is a close above the 50 moving average and also its slope turning upwards.
(3) Support at 123.87 and 139.31: The support region is crucial for Ethereum and requires monitoring to see if price gives way to the downside or if there is consolidation at or close to the support region. The aforementioned support region also coinciding with the bottom of the falling wedge signifies the validity of the region as support.
A break below the lower boundary (123.87) reduces the chances of any bullish price swing developing and rather argues for more downside action in Ethereum. Momentum indicators can also provide additional guidance.
Above all, the best course of action is to wait to see what transpires before pulling the trigger (long or short).
Is ETH beacon of hope?
Ethereum is right now exchanging at the estimation of $172.47 and its worth is expanding by 0.91%. The market capitalization of the money is $18,707,468,198 and the 24-hour volume of the cash is $7,158,803,681. The flowing inventory of the money is 107,953,283 ETH and the ROI of the cash is 6,019.90%.
Recently has been intense for the money as it experienced a great deal of high points and low points in the market. The worth arrived at the low estimation of $167.00 at 21:00 UTC, nonetheless, the money recuperated the worth and accomplish the estimation of $169.56. Then again, the money likewise exchanged at the high estimation of $175.43 at 15:39 UTC yet it doesn’t remain there for long and esteem before long began diminishing and reach up to the $167. The money is consistently under bearish weight this week, it begins the week with the high estimation of $200 however the cash began exchanging under bearish weight.
News Source: TheCoinRepublic
Ethereum Technical Analysis: Bearish Momentum Slowing Down?Conclusion for today’s Ethereum Analysis: Price closing above ~204.18 implies higher Ethereum price.
Ethereum Analysis for today is provided on the 6 hour (intraday) timeframe that covers over 9 months of market action. The bullish channel in Ethereum that started in December 2018 and reached a price peak of 363.18 on June 26, 2019 is plotted on the chart.
A reversal candle marked the end of the channel with Ethereum selling off to not only test the lower boundary of the channel, but break and close below it. A falling wedge chart pattern is indicated on the chart to provide perspective for the meandering price action from the June 26, 2019 peak to date. The falling wedge is ideally bullish and implies price eventually breaking the upper boundary of the pattern and moving upwards.
The 200 moving average along with the 50 moving average both maintain a down trending slope which suggests that bearish force in Ethereum is still very active and therefore provides chances for more downside action. Any movement to the downside would be expected to test the lower boundary of the wedge and should not move past if any bullish momentum is to develop.
Alternatively, price moving past ~176.58 that goes on to break the upper boundary of the wedge (confirmation of pattern) should produce fresh bullish momentum in Ethereum.
ETH Bears Continue to Push ETH Price Down?In the ongoing fall of the Crypto advertise, Major Cryptos have declined in the exchange against USD. Ethereum has indicated major Bearish conduct from the previous week, Ethereum is positioned at #2 in the crypto showcase and has an all out inventory of 107,885,087 ETH. It has a net market top of $18,234,913,436 USD .
Ethereum is presently exchanging at $169.02 USD, and in the previous 24 hours, its volume is seen at $13,159,465,485 USD with a coursing supply of 107,885,087 ETH. Ethereum hit a record-breaking high of $1,432.88 USD on the thirteenth of January 2018, likewise its least worth was estimated at $0.420897 USD on the 21st of October 2015. In the previous day, Ethereum exchanged its most astounding at $203.50 USD and the least at $162.73 USD. As thought about today, Ethereum has diminished a sum of - 16.71%, which is $-33.73 USD.
News Source: TheCoinRepublic
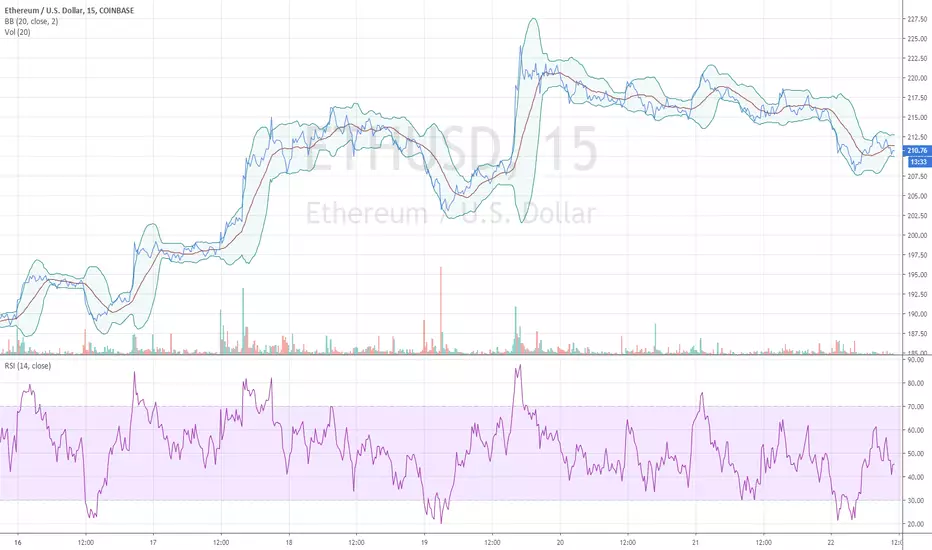
Ethereum Price Analysis - ETH Most Likely to Stay Above $200
Relative Strength Index: The RSI is currently at a healthy 41 points. This signals some sideways trading up ahead.
Bollinger Bands: The price is also within the bands' range, however it's touching the lower band. This means the price will try to rebound slightly, at least until the MA line.
Volume: There is very little volume for Ethereum at the time of writing, most likely attributed to the fact that it's the weekend. This means the market most likely won't make any major moves anytime soon.
Ethereum Price Prediction
The RSI, BBs and Volume are all signalling a sideways market up ahead. Combine that with the news that Ethereum is gearing up for ETH 2.0, and we should anticipate some bullish momentum in the coming weeks.
My prediction is that ETH will trade at the $200-$210 level for the next few days, before testing new support at higher levels.
Read Full Ethereum Price Analysis and Prediction: Cryptomode
ConsenSys Announced Kavita Gupta Left her Role As Founding partn
Consensys is one of the main blockchain innovation firms, it is a New York-based firm established in 2014 by Joseph Lubin. Kavita Gupta leader of the ConsenSys joined the organization, ConsenSys Venture in 2017 as it was propelled in San Francisco, administrating the financial limit of $50 million subsidized by the Co-author of the Ethereum and ConsenSys, Joseph Lupin.
As of late, in the report distributed in The Block that Kavita Gupta has left the place of employment of the leader of the ConsenSys Venture. This news turns out as a stun to the individuals in the digital currency industry. She has worked for such a long time for the ConsenSys Venture and had real jobs in the undertakings, for example, startup Blockfi, the blockchain framework firm StarkWare. She has eminent association in giving the organization status as one of the main firms in the blockchain organizations.
News Source: TheCoinRepublic
Ethereum Technical Analysis: Bull move on the move...Conclusion for today’s Ethereum Analysis: Price breaking below ~177.65 implies continuation of the current downtrend in Ethereum.
Ethereum analysis for today is carried out on an intraday (4 hour) timeframe candlestick chart that focuses on price action since the last week of June of current date. A head and shoulders top pattern (ideally bearish) that confirmed on a break below its neckline did provide a topping action in Ethereum with lower prices following afterwards.
The 50 moving average also crossing below the 200 moving average on July 14, 2019 did provide additional bearish bias favoring lower Ethereum price. Signs of bearish hesitation are indicated on the chart by horizontal green lines which mark an area of support for Ethereum price.
A price low of 163.62 was achieved on August 29, 2019, while a second attempt at pushing price lower only reached the 165 price level (September 06, 2019). The implication therefore of price holding at support favors a bullish momentum to the upside.
Also worthy of note is the current action of the moving averages which shows the 50 moving average attempting to cross back above the 200 moving average (since its July 14, 2019 cross below). A successful completion of a cross will provide additional bullish momentum and argue therefore against selling Ethereum.
A close below ~177.65 poses a challenge to the bullish analysis for Ethereum and rather suggests a possible resumption of the current downtrend in Ethereum price.

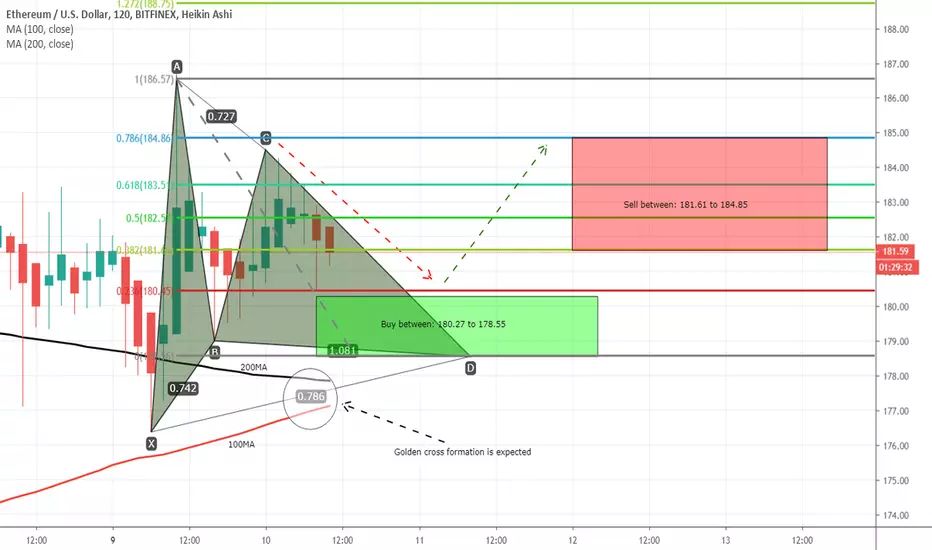
ETHUSD forming a bullish gartley | A good long opportunityPriceline of Ethereum / US Dollar is forming a bullish gartley and soon it will be entered in potential reversal zone insha Allah.
We have a golden cross formation expected below the PRZ are between 100 simple moving average and 200SMA.
I have used Fibonacci sequence to set the targets:
Buy between: 180.27 to 178.55
Sell between: 181.61 to 184.85
Regards,
Atif Akbar (moon333)
ETHUSD formed bullish BAT | A good long opportunityPriceline of Ethereum / US Dollar cryptocurrency has formed a bullish BAT pattern and entered in potential reversal zone.
I have defined the targets using Fibonacci sequence:
Buy between: 175.64 to 174.67
Sell between: 177.96 to 181.45
Regards,
Atif Akbar (moon333)

now we got confirmation to buy ether !!take action fast as possible we have very secure stop loss
good luck join our team soon !!
#bank trader
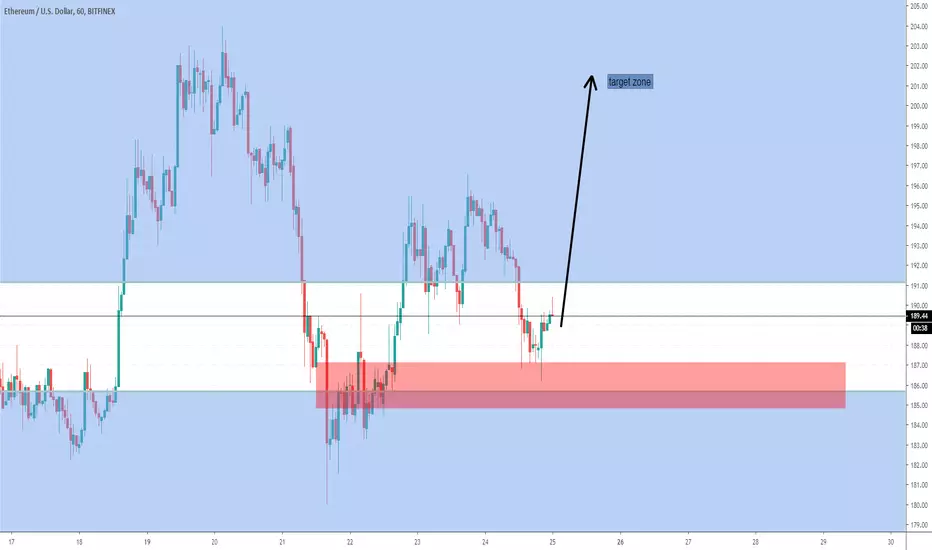
Ethereum Good opprtunity to buy now (ETHUSD)Hello Traders,
in this chart i'm sharing Ethereum analysis good long opprtunity now,
You can place buy bid with SL and before invest also do your own research as well.
Our previous success analysis:
Legal disclaimer: I am not a financial advisor, You trade at your own risk and nobody can guarantee you results.
Global Rashid
The Guide To The Right Path

Ethereum Technical Analysis:Break below bullish trendlineConclusion for today’s Ethereum analysis: Price closing above ~246 is bullish for Ethereum price.
Ethereum price analysis for today is carried out using a log scale on the Daily timeframe. A candlestick chart is used with price action displayed from the January 2018 to current date.
The previous bearish trendline in Ethereum is indicated on the chart prior to a successful break above its upper boundary in March 2019. The bullish swing also since December 2018 is also represented with the use of a bullish trendline.
Resistance for Ethereum price is currently marked between 307.08 and 363.74, with the latter representing a price level where a change of polarity can be observed on the Daily timeframe. In essence, the 363.74 price level will be key to watch and will be important for future price development.
A break below the Daily timeframe bullish trendline that lasted over 6 months implies bearish implications. Adding to the current bearish bias is also a consolidation of price just below the trendline. However, the 200 Day moving average (MA) plotted on the chart offers support for Ethereum price, as well as the upper boundary of support between 188.81 and 167.64.
As a result, price moving to the upside from 200 Day moving average and price capturing closing above ~246 will argue for a bullish bias in Ethereum.

#ETHUSD#Ethereum, Operating instructions for AugustWe have been stuck for a month between $ 197 and $ 233 and we expect it to continue for another month.
So what can be done by then? Buy as close as possible to support $ 197 and sell as close to resistance as $ 233.
If you are a trader who wants to trade only with the trend then wait for the price to approach $ 233 and then sell.

we found it good to take action ether usd in bank level buy zone ,
hopefully reach our target soon
good luck

Ethereum bearish But not much!ETHBTC have broken the blue support line but no volume followed. it seems ethereum is ranging and does not care about ressitance. so a conclude that this blue line support is no longer valid. i think ethereum will surprise us rallying to the up side. i drew a support area. may be ethereum will bounce from these levels.
ETH Ethereum Buy The Bounce Or The Breakout!What ill be waiting for to play out this week with Ethereum is waiting for a Bounce above previous resistance or buying a breakout!
