ETH/USDT Price Action Analysis — Bullish Continuation Expected 📊 ETH/USDT Price Action Analysis — Bullish Continuation Expected 🚀
🔍 Chart Overview (as of June 9, 2025):
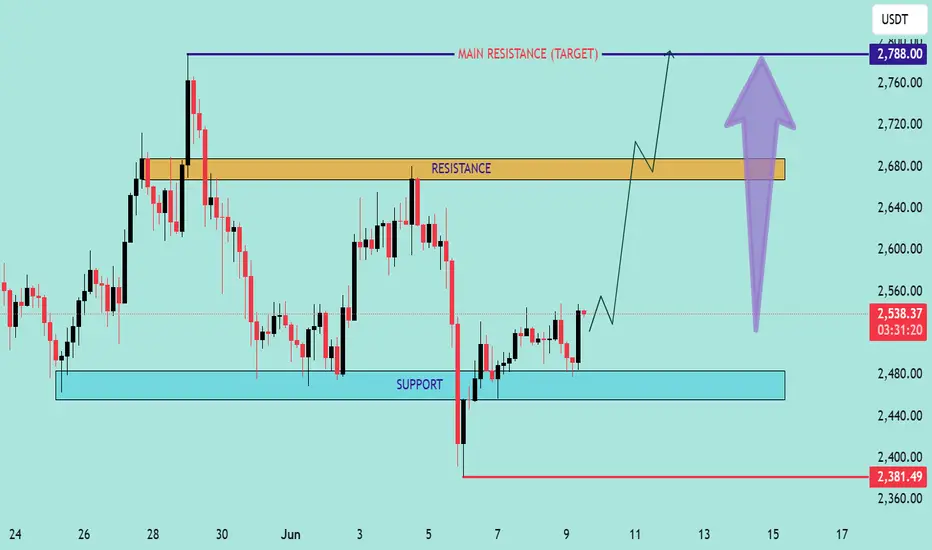
This chart of ETH/USDT highlights a well-defined support and resistance structure, projecting a potential bullish move toward a main resistance target at $2,788.00.
🧱 Key Zones:
🔵 Support Zone: $2,440 – $2,480
Price rebounded strongly from this area, showing buyer interest and liquidity absorption.
🟠 Resistance Zone: $2,660 – $2,690
Previously rejected zone where supply overtook demand. Price must break and hold above this for further upside.
🔺 Main Resistance Target: $2,788.00
If resistance is cleared, this is the next major supply area, acting as a potential take-profit level.
📈 Price Action Insight:
Price is currently hovering near $2,538.37, approaching resistance.
The chart suggests a potential breakout scenario after a short consolidation.
A bullish breakout above $2,690 could trigger a sharp rally toward the $2,788 target.
The chart projects a pullback-retest pattern (break, retest, and continuation) before the final leg up.
⚠️ Risk Management:
Invalidation Level: $2,381.49
A break below this level would invalidate the bullish setup and could lead to further downside.
✅ Summary:
Bias: Bullish 📈
Entry Area: Break and retest above resistance zone ($2,660–2,690) 🔓
Target: $2,788 🎯
Invalidation: Below $2,381.49 🚫
📌 Note: Always use proper risk management and confirm breakouts with volume or momentum indicators (e.g., RSI, MACD).
Ethereumbitcoin
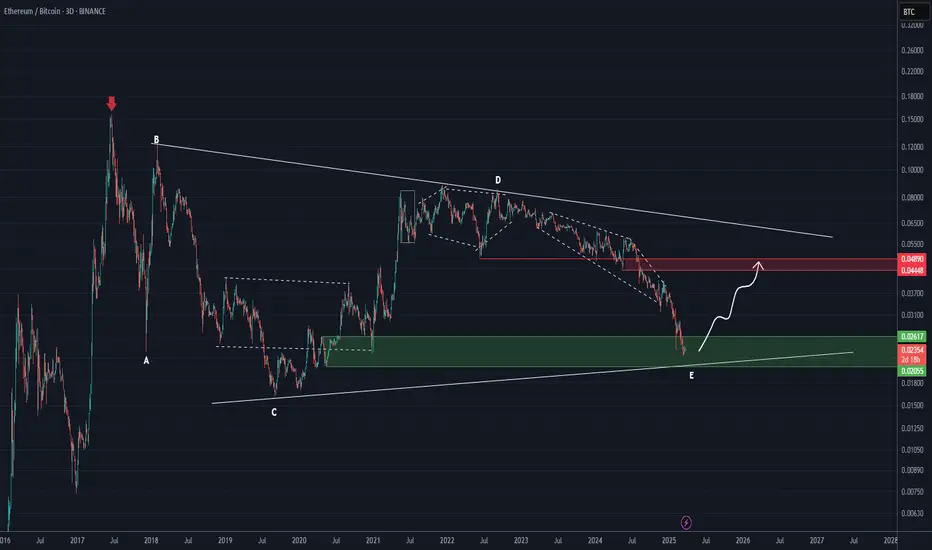
Ethereum vs. Bitcoin (3D)This analysis is an update of the analysis you see in the "Related publications" section
We have slightly updated the Demand zone.
Ethereum has reached a strong support zone compared to Bitcoin. From this green zone, we expect a bullish move towards the red zone. This indicates that in the coming weeks and months, Ethereum is likely to outperform Bitcoin.
These zones should not be ignored. Ignoring these high-timeframe support zones would be a critical mistake.
For risk management, please don't forget stop loss and capital management
Comment if you have any questions
Thank You
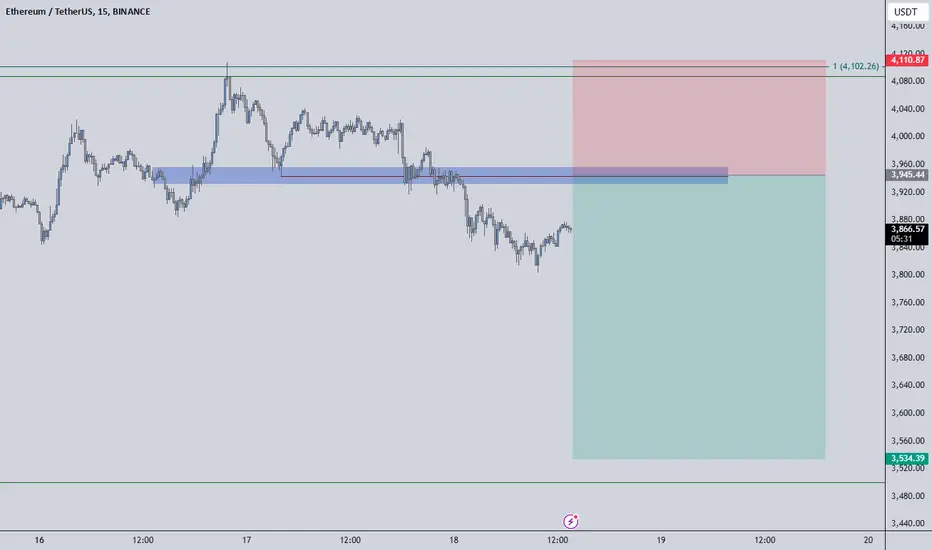
ETHEREUMUSDT | Risky Hedge ShortIn our previous ETHUSDT analysis, we mentioned the importance of the $4102 level and the possibility that our rapid entry into the range with its manipulation could lead to bad possibilities.
The price has entered the range again and continues to fall, but it is not nice that the liquidity remaining above is very open. Still, taking a short hedge is not a bad trade by taking the possibility of a losing 1R from here.
I keep my charts clean and simple because I believe clarity leads to better decisions.
My approach is built on years of experience and a solid track record. I don’t claim to know it all, but I’m confident in my ability to spot high-probability setups.
My Previous Analysis
🐶 DOGEUSDT.P: Next Move
🎨 RENDERUSDT.P: Opportunity of the Month
💎 ETHUSDT.P: Where to Retrace
🟢 BNBUSDT.P: Potential Surge
📊 BTC Dominance: Reaction Zone
🌊 WAVESUSDT.P: Demand Zone Potential
🟣 UNIUSDT.P: Long-Term Trade
🔵 XRPUSDT.P: Entry Zones
🔗 LINKUSDT.P: Follow The River
📈 BTCUSDT.P: Two Key Demand Zones
🟩 POLUSDT: Bullish Momentum
🌟 PENDLEUSDT.P: Where Opportunity Meets Precision
🔥 BTCUSDT.P: Liquidation of Highly Leveraged Longs
🌊 SOLUSDT.P: SOL's Dip - Your Opportunity
🐸 1000PEPEUSDT.P: Prime Bounce Zone Unlocked
🚀 ETHUSDT.P: Set to Explode - Don't Miss This Game Changer
🤖 IQUSDT: Smart Plan
⚡️ PONDUSDT: A Trade Not Taken Is Better Than a Losing One
💼 STMXUSDT: 2 Buying Areas
🐢 TURBOUSDT: Buy Zones and Buyer Presence
🌍 ICPUSDT.P: Massive Upside Potential | Check the Trade Update For Seeing Results
🟠 IDEXUSDT: Spot Buy Area | %26 Profit if You Trade with MSB
📌 USUALUSDT: Buyers Are Active
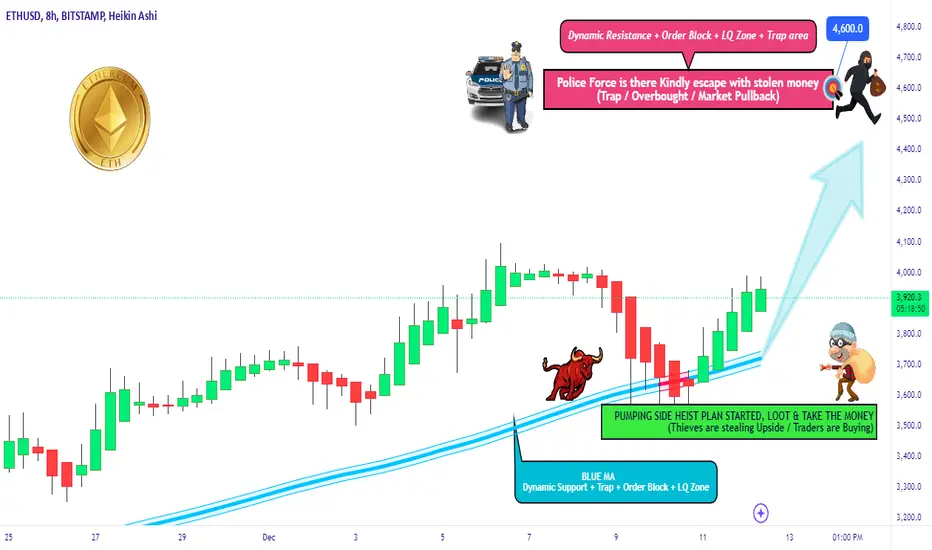
ETH/USD "ETHEREUM" Crypto Market Heist Plan on Bullish SideHi there! Dear Money Makers & Robbers, 🤑 💰
Based on Thief Trading style technical analysis, here is our master plan to heist the ETH/USD "ETHEREUM" Cryptocurrency market. Please adhere to the strategy I've outlined in the chart, which emphasizes long entry. Our aim is the high-risk Red Zone. Risky level, overbought market, consolidation, trend reversal, trap at the level where traders and bearish robbers are stronger. So Be Careful, wealthy and safe trade.
Entry 📈: Acceptable anywhere; I advise placing buy limit orders within a 15-minute Chart. The entry for the Recent/Nearest Low Point should be in pullback.
Stop Loss 🛑: Using the 4H period, the recent swing low
Goal 🎯: 4600.0
Scalpers, take note: only scalp on the long side. If you have a lot of money, you can go straight away; if not, you can join swing traders and carry out the robbery plan. Use trailing SL to safeguard your money 💰.
Warning : Our heist strategy is incompatible with Fundamental Analysis news 📰 🗞️. We'll wreck our plan by smashing the Stop Loss 🚫🚏. Avoid entering the market right after the news release.
Take advantage of the target and get away 🎯 Swing Traders Please reserve the half amount of money and watch for the next dynamic level or order block breakout. Once it is resolved, we can go on to the next new target in our heist plan.
💖Supporting our robbery plan will enable us to effortlessly make and steal money 💰💵 Tell your friends and family to follow, like, and share. Boost the strength of our robbery team. Every day in this market make money with ease by using the Thief Trading Style.
I'll see you soon with another heist plan, so stay tuned 🫂
ETHBTC To the Moon ScenarioScenario: Macro Cup & Handle plays out...
This assumes the crypto market becomes bullish again and we get that final leg up in the bull market. ETH will become the strongest altcoin ever EOY.

ETH will push to demand zoneEthereum will push to demand zone soon around 2800-2850$.
Then we have a fuel to run to 4000$ in first push.
Then 5200$.
Be ready and don't get shaken out.
PS: Don't worry, ethereum is not dead. Many L1 altcoins are sleeping right now for example AVAX and BNB.

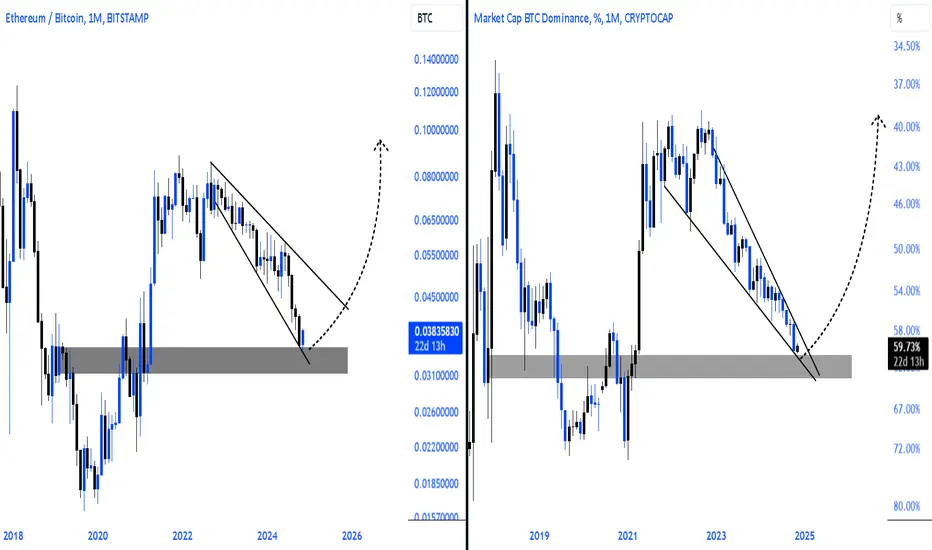
$ETHBTC x $BTC.D#Altseason is inevitable!
CRYPTOCAP:BTC.D ➡️📉 BINANCE:ETHBTC ➡️📈
#Ethereum is undeniably a major leading force and a major indicator for #Alts .
#Bitcoin dominance is at major resistance level while BINANCE:ETHBTC is rejected at major support level and is poised for an epic comeback!
$ETH is weakening against $BTC in LTF?#eth / #btc pair rallied in last 2 months period and needs to rest i think. A bearish divergence is formed in #ethereum against #bitcoin chart. Retrace to red box is necessary. Breaking up the channel with huge volume is the invalidation of divergence. Not financial advice.

$ETHBTC chart's falling channel#ethereum against #bitcoin chart, #ETHBTC has reached top of the channel before ETF approval. Volatility will be insane.

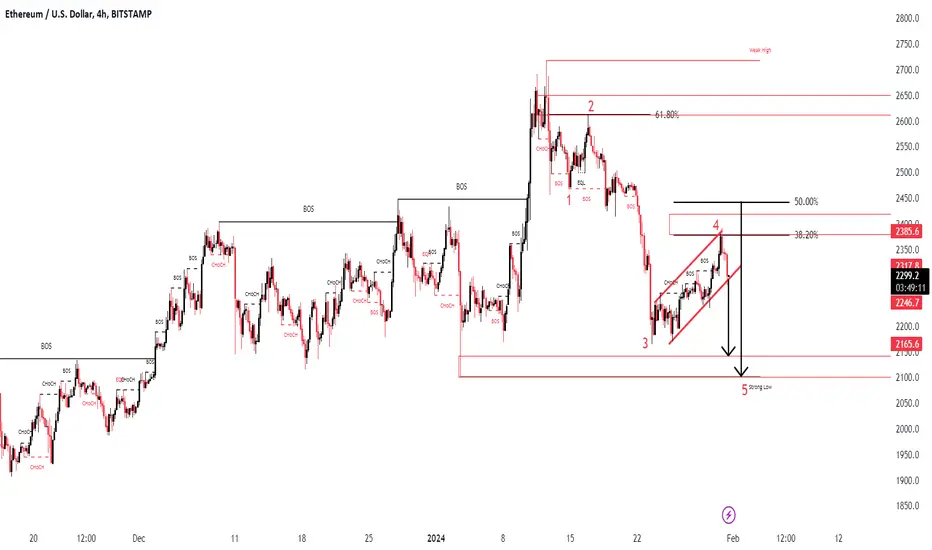
ETHUSDPair : ETHUSD ( Ethereum / U.S Dollar )
Description :
Completed " 1234 " Impulsive Waves and Rejecting from Daily Demand Zone or Fibonacci Level - 38.20%. Break of Structure and Completed the Retracement. Break out of Upper Trend Line of Consolidation Phase to make Fake Breakout. Strong Divergence in RSI
ETHBTC looking strong and ready to rallySince BTC topped around 31k, ETH has outperformed BTC. It looks like ETH is slowly gaining more and more, as more ETH is being slowly burned through EIP-1559 and more ETH is being staked. As ETH outflows since the Shapella upgrade have peaked and inflows are dominating, ETH now has a yield of about 5%; ETH looks more attractive than BTC.
Of course, BTC has its upcoming halving less than a year from now, and recently Ordinals have given Bitcoin new life. As gold was rallying, the digital gold narrative was also more robust. However, Ethereum has seen its Layer 2 protocols gain more and more traction while AI stocks are pumping like crazy and gold is dumping. Essentially flexible tech is preferred to stable and inert metals.
ETHBTC has almost completed a breakout, as it hasn't fully reclaimed all key diagonals and the yearly pivot. It has reclaimed all critical support, penetrated the 0.06-0.066 area, which I was expecting to happen for a while, and is now looking solid.
Someone could go long now, with a stop loss below 0.064 or waiting for the full breakout. Someone could wait before going long for BTCUSD and ETHUSD to have a failed breakdown by hitting 25700$ and 1720$, respectively.

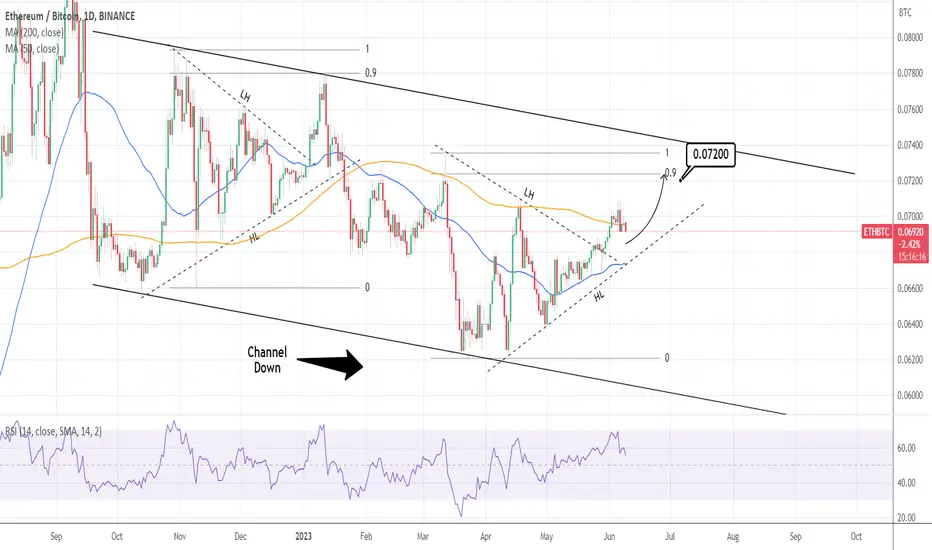
ETHBTC: targeting the top of the Channel Down.ETHBTC is consolidating right now on neutral 1D technicals (RSI = 55.810, MACD = 0.001, ADX = 53.149) supported by the HL trendline. A bounce on the 1D MA50 would be ideal for a new buy, but if it breaks the trend turns bearish. Until it does, we are bullish, targeting the 0.9 Fibonacci (TP = 0.07200) as it happend on January 2023. But of those where the bullish waves inside a long term Channel Down.
## If you like our free content follow our profile to get more daily ideas. ##
## Comments and likes are greatly appreciated. ##
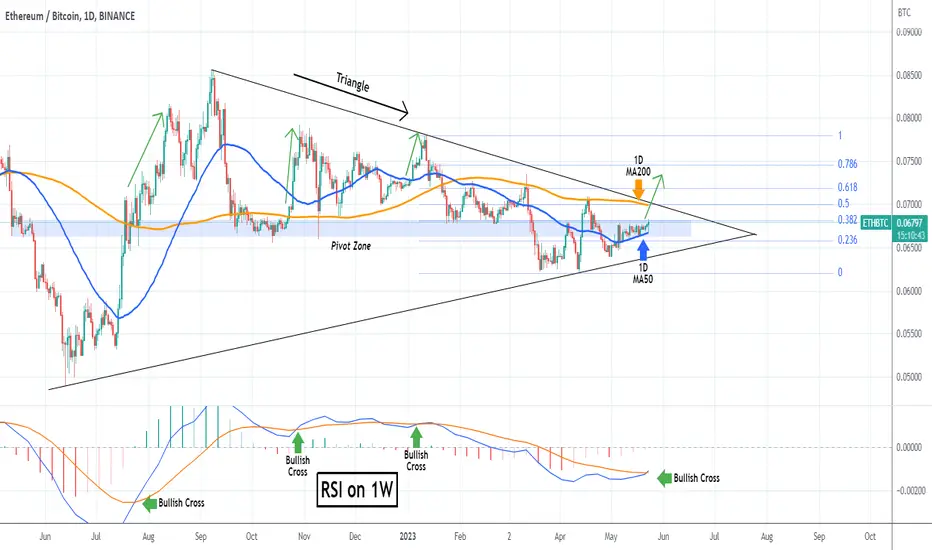
ETHBTC Bullish Cross completed on 1W. Rally ahead.The ETHBTC pair has been trading inside a Triangle pattern for almost a year (since the June 13 2022 Low). For the past 3 weeks the 1D MA50 (blue trend-line) has been supporting while the 1D MA200 (orange trend-line) has been the Resistance since January 21 as the price has failed to close a 1D candle above it (having 3 clear rejections on it).
The key difference here is the formation of a Bullish Cross on the 1W MACD. In the past 12 months, this has always been a Buy Signal. We are buying and targeting the 1D MA200, and if it closes a 1D candle above the 1D MA200, we will extend buying towards the 0.618 Fibonacci level.
-------------------------------------------------------------------------------
** Please LIKE 👍, FOLLOW ✅, SHARE 🙌 and COMMENT ✍ if you enjoy this idea! Also share your ideas and charts in the comments section below! **
-------------------------------------------------------------------------------
💸💸💸💸💸💸
👇 👇 👇 👇 👇 👇
ETHBTC may be putting in a major fakeoutAs usual, what follows isn't financial advice but a mere observation.
This idea is to be considered as a follow-up of the one that can be found linked below.
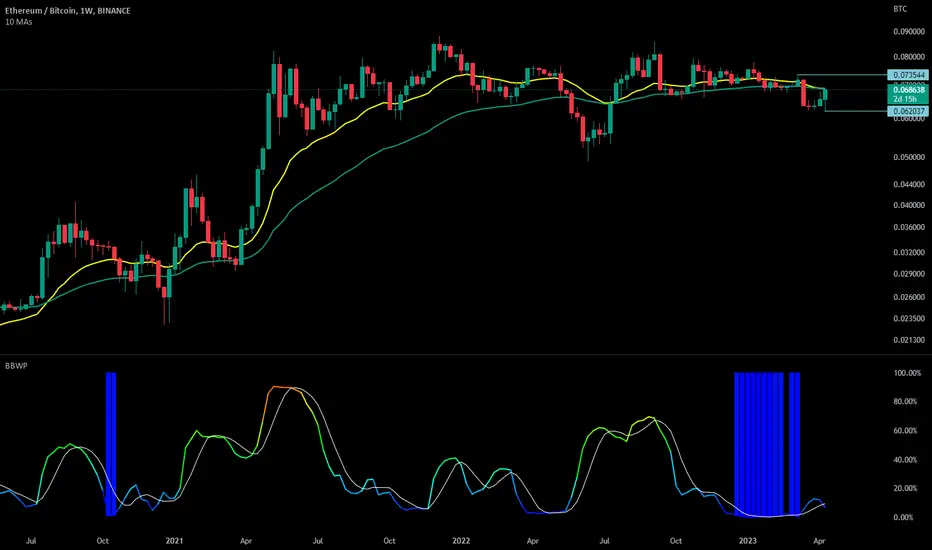
As explained in my last study, we're witnessing extremely low levels of volatility on the weekly timeframe for ETHBTC.
While price action wasn't exactly confidence-inducing until a couple days ago, tides might be beginning to change.
We can observe how since july 2020, the 21EMA (yellow) and the 55EMA (green) have never had the chance to bearishly cross.
This brings me to a very simple point, if we can see a weekly ETHBTC close above both EMAs, essentially producing a fakeout, the idea that the expansion phase coming from this extremely low volatility environment will be to the upside will begin to appear more probable.
The horizontal ray that's marking the march 2023 high (0.073544) is the obvious line in the sand for me, a weekly close above that level will make me consider that ETHBTC is putting in a major - possibly even macro - low.
Keep in mind that as long as the price keeps being held down by both the 21EMA and the 55EMA this is just a possible scenario waiting to unfold, but still unconfirmed.
Furthermore, a weekly close below this current week low (0.062037) will very likely result in a much more severe downside continuation, with targets already discussed in the idea linked below.
Whatever happens, stay safe and wait for confirmation.
#Ethereum - thoughts out loud #11Good evening, we are from Ukraine!
Why was it necessary to place a limit buy order at this particular moment and what were the goals for profit-taking?
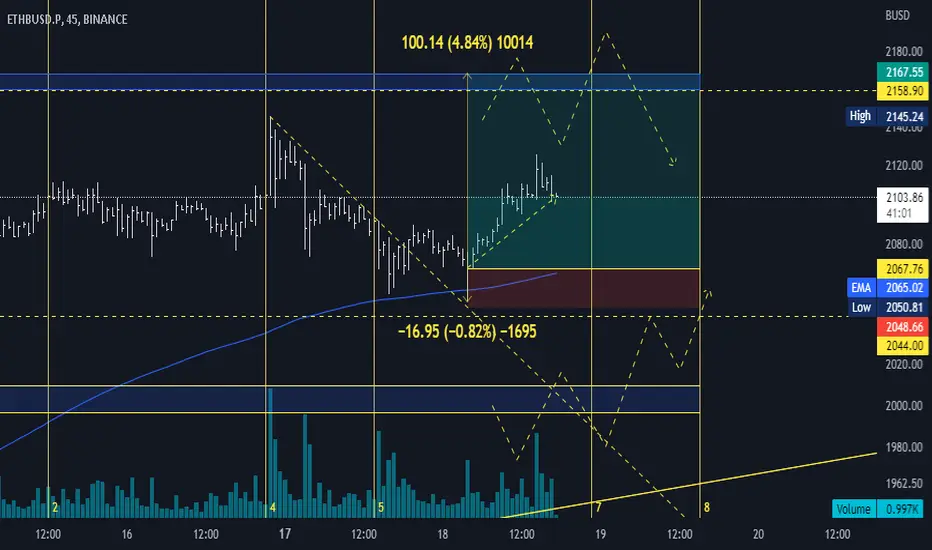
I'll start with the first one, because we are at the bottom of the trading range after manipulating (on volumes) with a false breakout of the lows and a quick resumption of purchases on the buy bars with an extended spread. That is, the technical reason is more in favor of the longs.
The second part of the question. The first target is the local high of 2160. Moreover, if the situation develops positively, the position can be held up to 2200, accompanying the instrument.
Thank you all for your attention, I wish you success.
Sometimes you win /sometimes you learn .
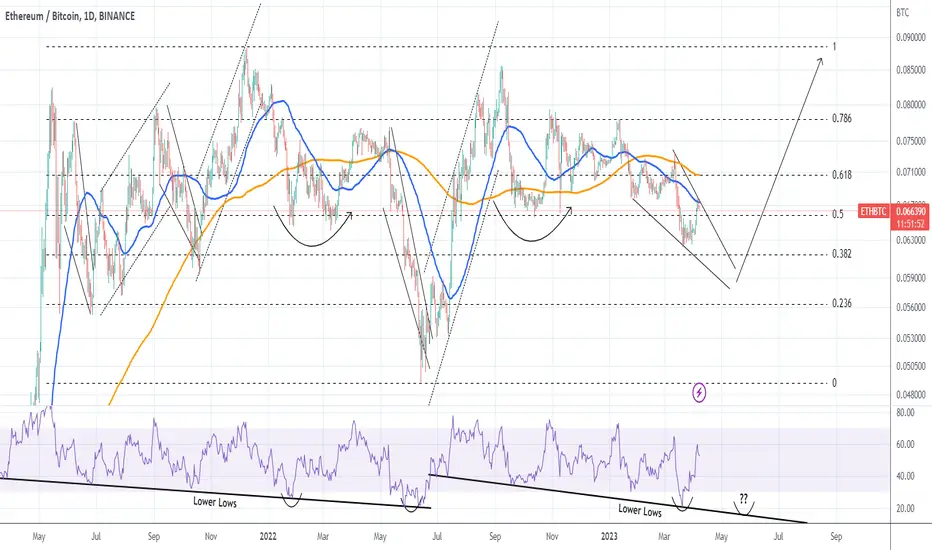
ETHBTC About to bottom and Ethereum to outperform?We haven't looked into the ETHBTC pair in a while but there is no better time than now, in the build up of what the market calls an 'alt season'. As you see the pair hit its 1D MA50 (blue trend-line) this week after a strong rebound on the RSI from below the 30.00 oversold barrier. Last time that happened was on June 13 2022.
The Fibonacci levels help at identifying key Support and Resistance levels within this two year horizon very effectively. The question is, do we have one last Lower Low on the 1D RSI trend-line before ETH starts outperforming BTC again?
-------------------------------------------------------------------------------
** Please LIKE 👍, FOLLOW ✅, SHARE 🙌 and COMMENT ✍ if you enjoy this idea! Also share your ideas and charts in the comments section below! **
-------------------------------------------------------------------------------
💸💸💸💸💸💸
👇 👇 👇 👇 👇 👇
#Ethereum - thoughts out loud #8]Good evening, we are from Ukraine!
Continuation of the movement.
Thank you all for your attention, I wish you success.
Sometimes you win /sometimes you learn.

#ETHBTC - 10% Gain Likely, 25% Possible!With a strong ascending trend line on the underside, and Buy signal from Crypto Tipster v2 and only a few real areas of resistance above, we can see a small Bullish move on #ETH / #BTC very soon.
We should see a good 10% rise to the next level of resistance, and if we can push through this level then 25% wouldn't be too hard to achieve either!
_________
What Do You Think?
If you enjoyed or agree with this idea - drop us a comment, like & follow! 😀
Ideas by theCrypster meet the guidance notes and disclaimer as mentioned below and within our website. See Signature for more info! ✌️
🔥🔥🔥
Crypto Tipster v2
theCrypster
🔥🔥🔥

#ETHBTC - A Small Short Trade Here, But What's Next?After some mega trades throughout 2022 with #ETH #BTC we've been a little quiet recently ranging within a smaller channel with trades showing small profits and/or small losses.
We've got a chance now of another small profit from a Short trade but the real question is what's going to happen next? When a breakout of this ranging market happens (which it will!), the direction #ETHEREUM heads is up for debate!
What do you guys think?
If you enjoyed or agree with this idea - drop us a comment, like & follow! 😀
Ideas by theCrypster meet the guidance notes and disclaimer as mentioned below and within our website. See Signature for more info! ✌️
Crypto Tipster v2 by theCrypster

ETHBTC - After Rejecting the Downside, We've got an Upside!ETH and BTC have quite closely correlated over recent times, with the price somewhat consolidating in this ever-tightening wedge formation. This wedge is coming to a close soon, but there's still time to profit from a few more swings!
We've received a Buy signal from CTv2 shortly after the price tested and was rejected by the lower trend line, this should indicate a move to the upper trend line - total profits of well over 5%, not bad for a few days!
If you enjoyed or agree with this idea - drop us a comment, like & follow! :)

ETHBTC - A Quick FakeOut Followed by 5-15% DeclineHey guys - Just taking a quick look at ETHBTC and it would seem we've experienced a little fakeout above trend levels only to experience quite a sharp decline to the point of breaking below recent support.
There is still strong support located around 5% below current price so this may act as a natural level to reject the downward momentum - or ETH may well break below this level too on it's descent to an overall 15% loss.
Either way we've got a Short signal from Crypto Tipster v2 and if the last 2 years of signals are anything to go by, we trust this to provide some good results!
If you enjoyed or agree with this idea - drop us a comment, like & follow! :)

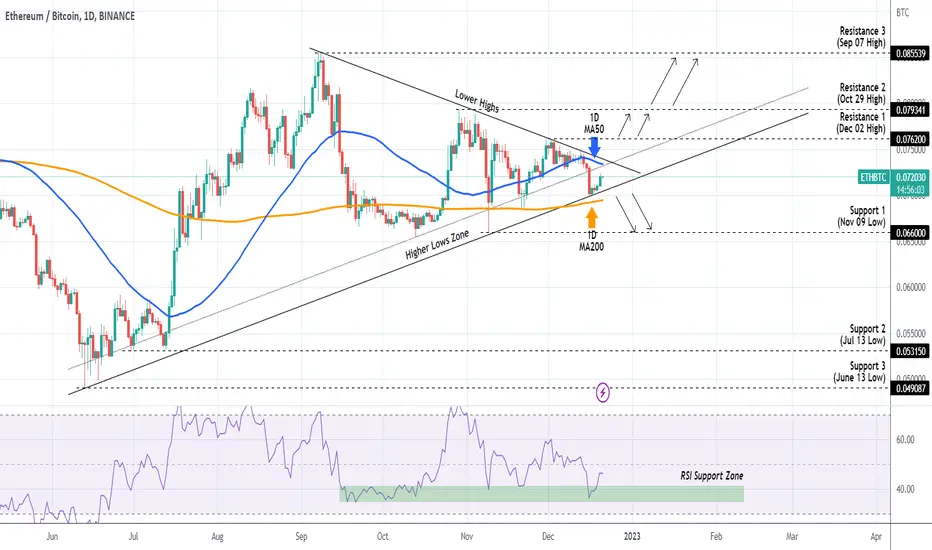
ETHBTC As tight on the edge as it can get.The ETHBTC pair has been trading within the 5-month Higher Lows Zone for the past 5 days, tight also within the 1D MA50 (blue trend-line) and 1D MA200 (orange trend-line). All this while it remains bearish below the Lower Highs trend-line that started on the September 07 High.
The 1D RSI is rebounding off its 3-month Support Zone, so technically we should see a rebound. How high that will be depends on the September Lower Highs trend-line. A break above should target on the short-term the 0.076200 Resistance 1 (Dec 02 High). As long as a candle closes above each Resistance level, the next one can be targeted and pull-backs bought on the RSI Support Zone.
A break below the Higher Lows and the 1D MA200 (which hasn't had a 1D candle closing below it since October 22), would be bearish and should target the 0.0660 Support 1 (Nov 09 Low).
-------------------------------------------------------------------------------
** Please LIKE 👍, SUBSCRIBE ✅, SHARE 🙌 and COMMENT ✍ if you enjoy this idea! Also share your ideas and charts in the comments section below! This is best way to keep it relevant, support me, keep the content here free and allow the idea to reach as many people as possible. **
-------------------------------------------------------------------------------
You may also TELL ME 🙋♀️🙋♂️ in the comments section which symbol you want me to analyze next and on which time-frame. The one with the most posts will be published tomorrow! 👏🎁
-------------------------------------------------------------------------------
💸💸💸💸💸💸
👇 👇 👇 👇 👇 👇
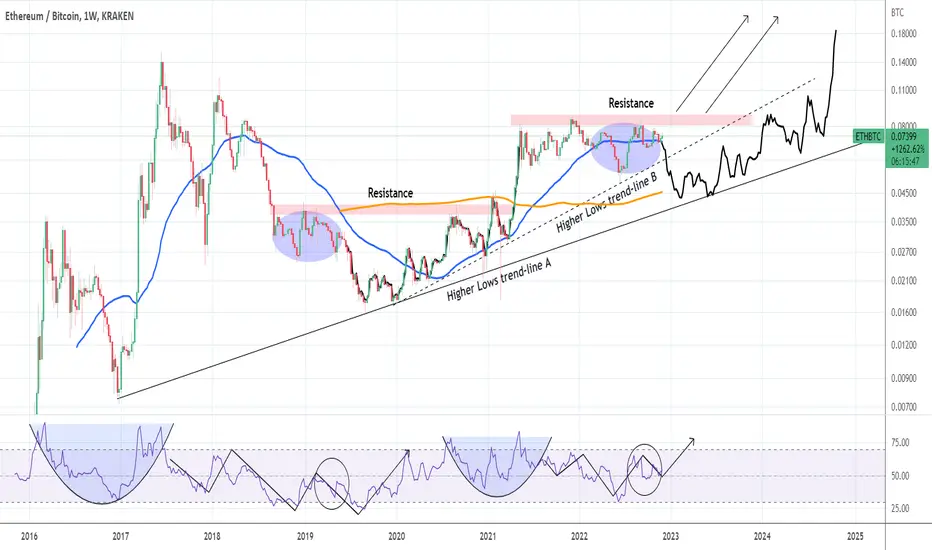
ETHBTC: Bitcoin will outperform Ethereum unless this line breaksThe ETHBTC pair on a 1W basis has been trading sideways this past month. The 1W MA50 (blue) is supporting. With also have another two rising Support levels, the Higher Lows trend-line A (started on Dec 26th 2016) and the Higher Lows trend-line B (started on December 23rd 2019).
The Resistance Zone since May 10th 2021 is holding and only if this level breaks, can we see an immediate rally on ETHBTC. Until we do, it is more likely to see Bitcoin outperform Ethereum as the candle action since March 2022 is similar to the one from September 2018 - May 2019. The 1W RSI is a testament to the repetitive nature since March 2016.
If we get a repeat, that would make a bottom on Higher Lows trend-line A and then steadily rise on Higher Highs and Higher Lows.
## If you like our free content follow our profile to get more daily ideas. ##
## Comments and likes are greatly appreciated. ##
## Also DONATIONS through TradingView coins help our cause of increasing the daily ideas put here for free and reach out more traders like you. ##