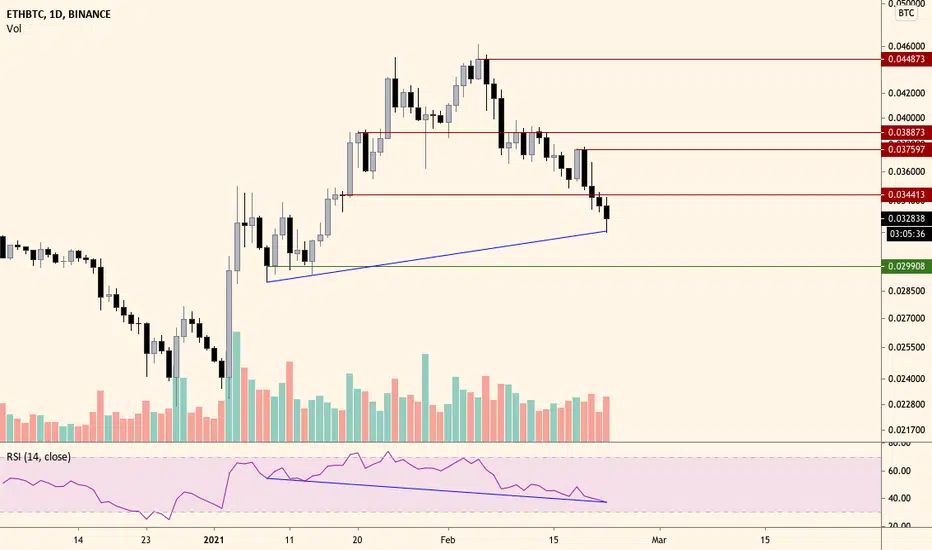
ETH BTC - slight rise against the strong btcPrices are still below the EMA.
Slight rise from support levels.
Good buying if you have BTC.
Ethereumbitcoin
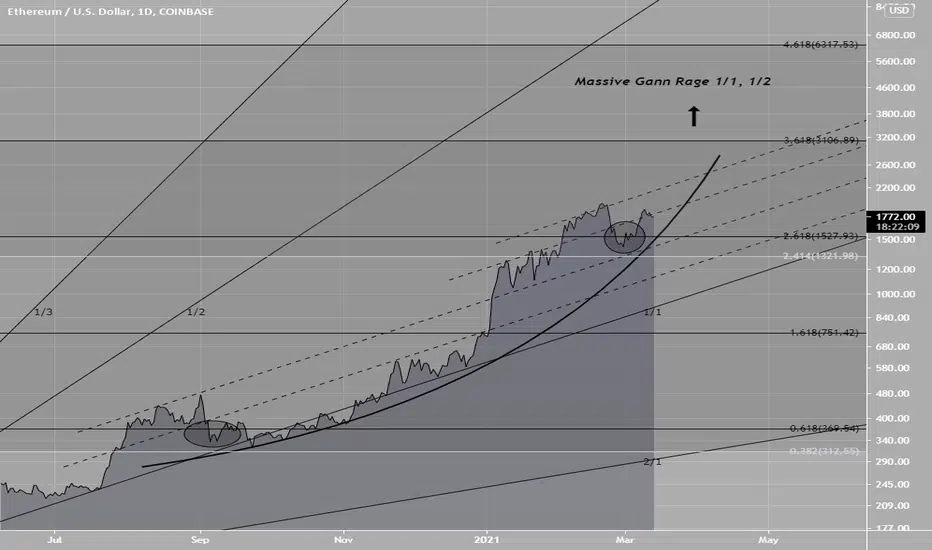
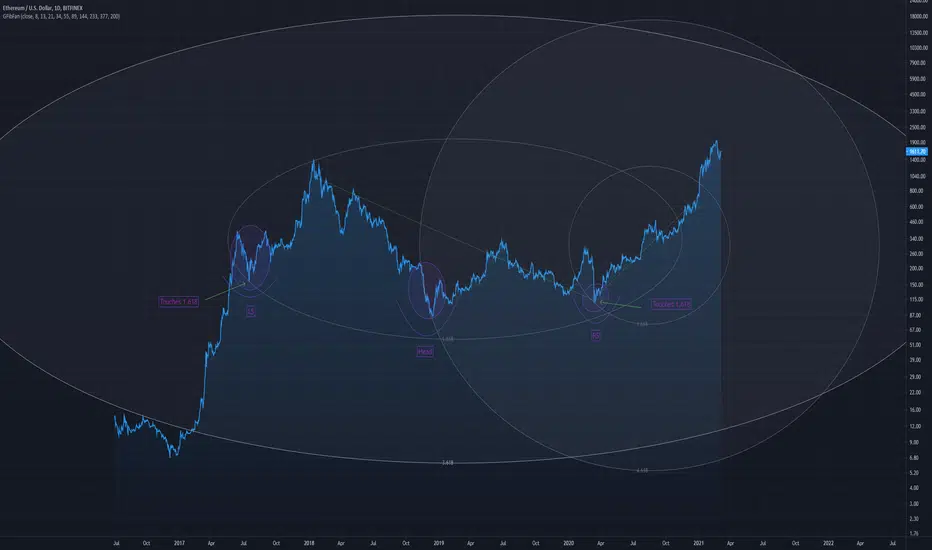
Ethereum Gann Bullish OutcomeComparison point at 0.618 and 2.618
If the curve holds it will open a large range within the (1/1 - 1/2) Gann range, this is a big range extending up to around 6.3k
A bearish Idea for ETH
Another more long term bull idea
I am long ETH
ETH-BTC Indicator Analysis - BullishA bullish case for ETH-BTC
Similarities in price action can be seen within the boxes
This is better shown on the log trend indicator
The 200MA is extremely flat, suggesting that it may rise rather than fall
Also the Ichimoku indicator shows that price has broken above the cloud, now the cloud will act as support for price rather than resistance, such as it did in the previous scenario (first box)
Attaching some other ETH-BTC ideas
I am long Ethereum..

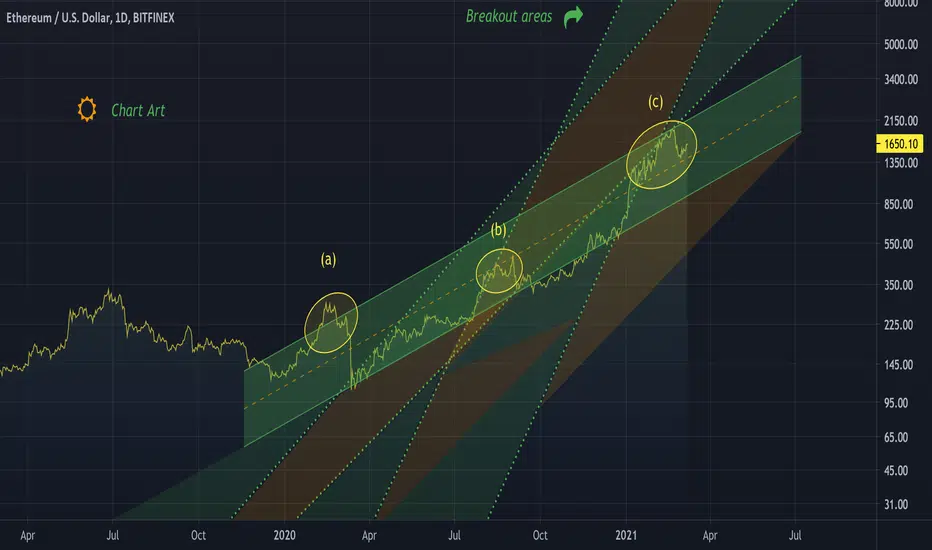
Ethereum Chart ArtUsing triangles to make cool colour patterns
In this case it is the recent uptrend formed on Ethereum
I believe this channel formed will breakout to the upside in a strong fashion, it is just a matter of time
Enjoying making cool patterns like this
Linking some more serious ETH predictions
ETHEREUM / BTC some strong Momentum , but will it be enough We will see. If it goes up here and tested it successfully it's really bullish. If not we can see a really ugly h&s

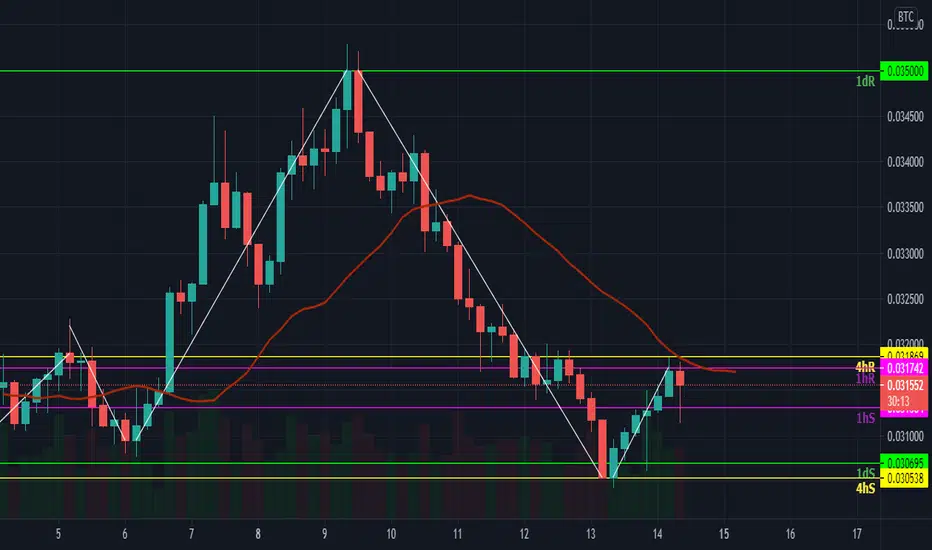
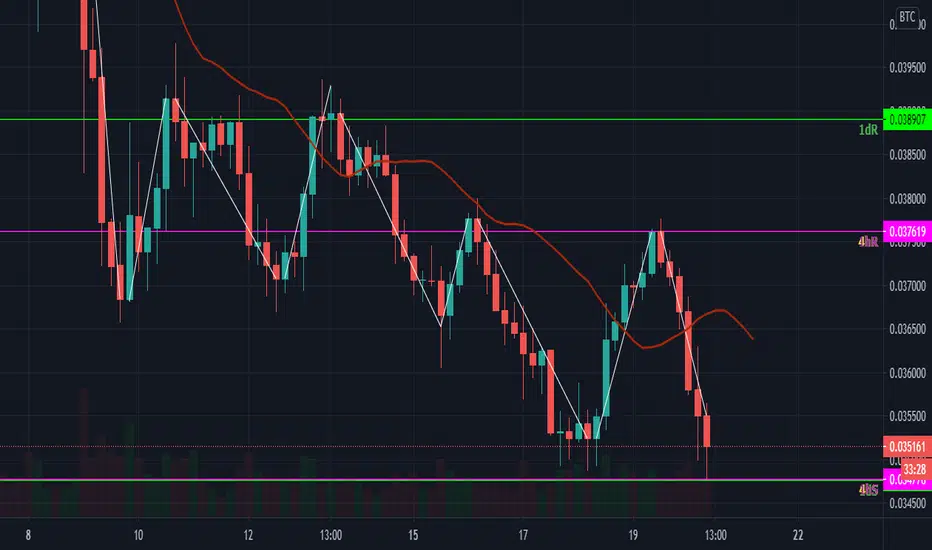
ETH BTC - Rise to the 4h resistance on 1h chartAfter a considerable eth/btc drop off the back of the strong btc growth, we see a rising ETH/BTC.
Interesting to note the tight 1 day support & resistance levels.
EMA is flatlined so we'll see slow growth.

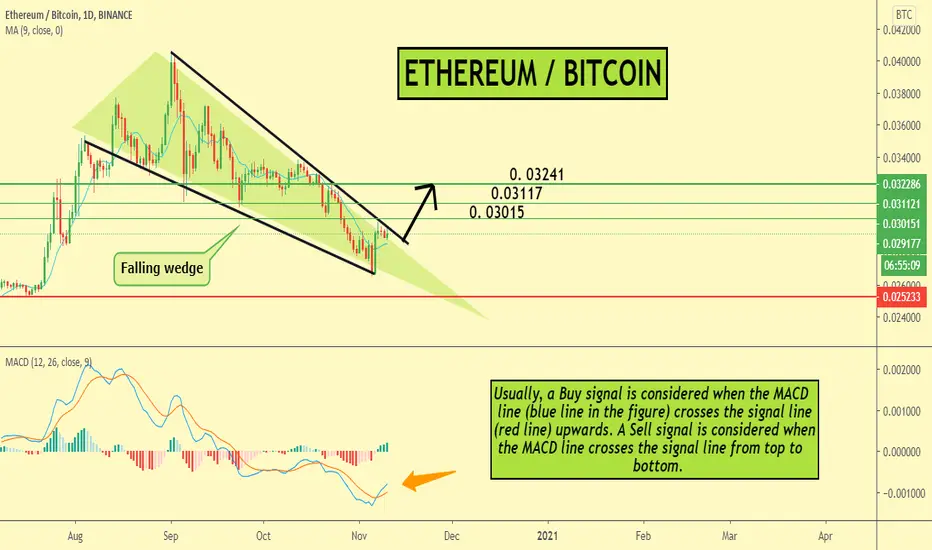
ETH/BTCHello! MacD indicator shows a good buy signal on ETH / BTC!
Usually, a Buy signal is considered when the MACD line (blue line in the figure) crosses the signal line (red line) upwards. A Sell signal is considered when the MACD line crosses the signal line from top to bottom.
The larger the timeframe (the time period of one chart element), the less false signals will be.
Thanks for attention🧡
I will be glad to be helpful to You💋
Stay connected🤗
Your Rocket Bomb🚀💣
The Monster Uncaged - Hidden Inverse H&SClear relationship between the two price point touches at their respective 1.618 trends (bear and bull)
This is a very bullish outlook for Ethereum, hence the title
A pattern like this of this magnitude will push Ethereum a lot higher
Crazy bullish long term
ETH-BTC Wedge Breakdown Eventuality Using more indicators
We can see similar MACD formations between these two price points (purple ovals)
Also similar price formations, with a common bounce of a MA line between the two
Evidence suggests that this wedge that has formed bullishly will break down, bearishly
A head and shoulders can also be identified on the RSI weekly chart
^ above idea suggests continuation, scrap that, bearish action is favored
This is the wedge above that price is currently within

ETH IS ABOUT TO MELT FACESWe have heard a lot of talk about ETH Gas Fees, DOT is taking over, ADA, SOL . . . BLA BLA BLA. Let the Alt king show that patience pays off. I would expect this bad boy to melt faces soon just like BTC did earlier in the year. The longer the consolidation the louder the bang. . . . Needles to say I am continuing to accumulate at these levels and look forward to seeing my net worth grow.

ETH BTC to fall to the 0.03 levelFalling Resistance levels on all timeframes
Falling EMA
Good ETH buying at 0.03

ETH BTC down to 0.03 1d supportSteeply plummeting EMA on the Eth-Btc chart.
Falling support levels.
Good opportunity to get well priced ETH from your BTC.

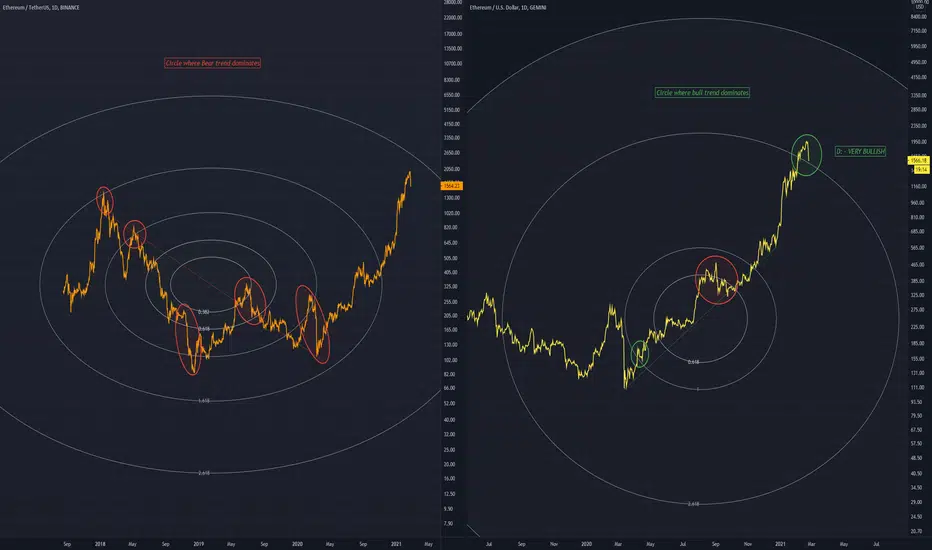
Ethereum Bear Vs Bull - CircleWithin the bear circle trend we can see areas of resistance (in red)
What really draws my attention though is the bull trend, where price is sitting currently above 2.618! this area will act as support for price.
This is ridiculously bullish for Ethereum.
I can't believe I am just seeing this now..
BUY BUY BUY
Attaching some of my other ETH analyses
Bix
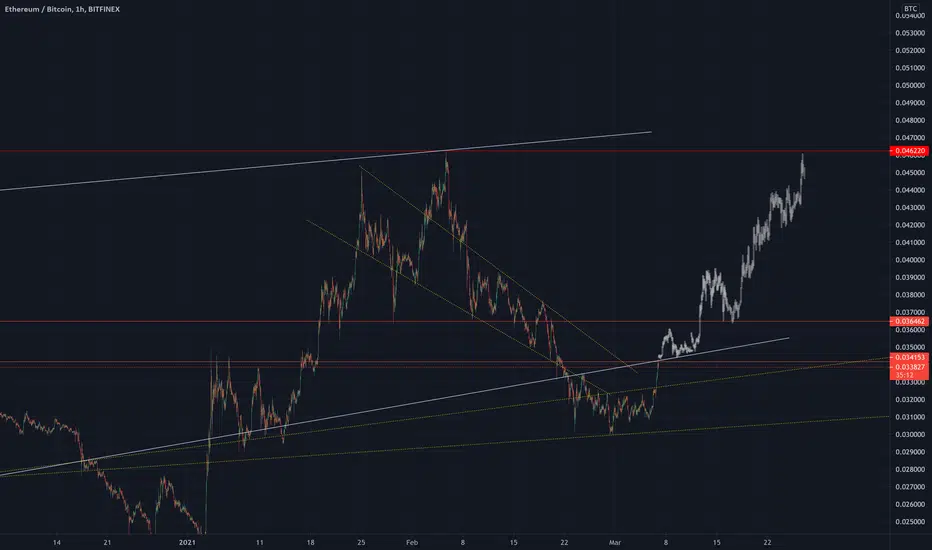
Ethereum bullish divergenceETH/BTC breaking through support after support. Next big support zone around 30k sats. Could see a turnaround here with the strong bullish divergence, however it could also playout a little further until the support zone.
How did you survive this red monday dip?
ETH BTC - good time to pick up well priced ETH if you have BTCFalling falling support levels and eth/btc prices.
Discounts for all!

Ethereum completing big Cypher for upto 58.5% rallyHi friends hope you are well, and welcome to the new update on Ethereum coin.
On long-term weekly chart chart, After formation of BAT and Gartley patterns, the priceline of ETH with BTC pair is completing the formation of bullish Cypher pattern and soon it will be entered the potential reversal zone There are also 50 and 100 simple moving averages supports in this buying zone.
This trade has a profit possibility of 58.5%, and the loss possibility is 14%.
Note: Above idea is for educational purpose only. It is advised to diversify and strictly follow the stop loss, and don't get stuck with trade.

ETH BTC down to the 0.033 levelWe'll continue to see a drop of the eth to btc pricing due to the strong price of Bitcoin.

ETH BTC - falling peaks and troughs BTC - ETH has set a trend of falling peaks and troughs.
Falling EMA off the back of a strong BTC.
ETH-BTC Gann - Areas of importanceCircle is the main area of importance, would be great to hodl and continue the up trend.
The main bull breakout can be observed above the curve of resistance plotted (arrow)
If this trend hodls a very large breakout may result against bitcoin
Ethereum hodls utility, Bitcoin is a store of value.


ETHEREUM FALLING SOON hello traders ,
Welcome to my price forecast Ethereum/usd.
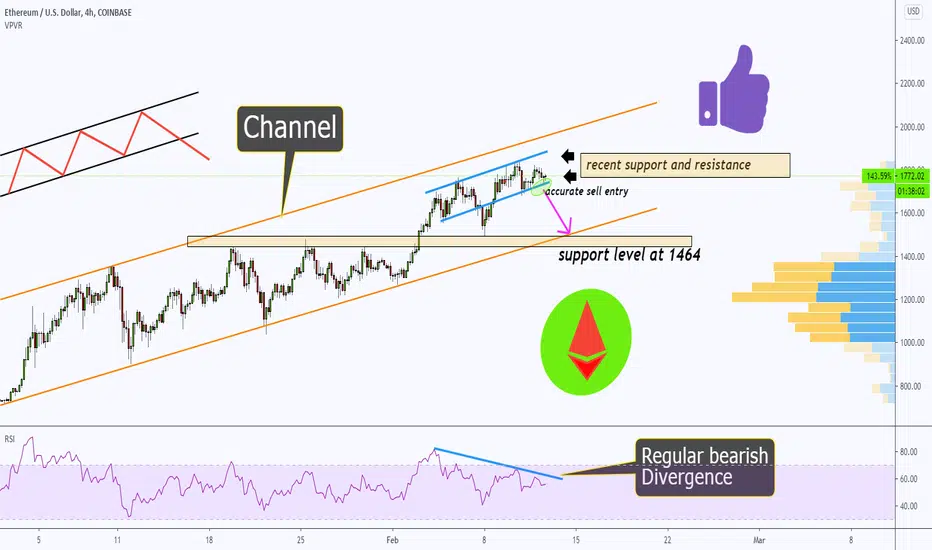
Ethereum is moving inside upward channel.
there are basically three types of channel directions,
one is upward slopping channel which 80 - 90 % of the time break downside
second is downward slopping channel which 80 - 90 % of the times break upside .
third one is side ways which means market unable to decide the direction and
we can trade inside channel with the help of price action.
now what is price action ?
price action is vast topic but it include candlesticks, support resistance, moving average etc
so here we see in Ethereum price is in upward channel and hopefully it will break downside .
our target is at support level for now .
and we also see bearish divergence which confirms its upcoming fall.
safe entry is after blue line break.
Thanks for watching my idea , have a green day ..
ETH breakdown lingers despite the network overtaking Bitcoin in
Ethereum retraces from the new record high aiming to secure support above $1,700.
The formation of a rising wedge pattern hints that the correction could be extensive.
Ethereum network is moving more value in Ether compared to Bitcoin blockchain with BTC.
Ethereum is struggling to sustain the uptrend after rising to a new all-time high. The largest smart contract token was recently elevated above $1,800 but could not continue on the trajectory eyeing $2,000.
Meanwhile, a retreat has come into the picture, whereby Ether is seeking higher support. The bulls in the market are prioritizing support above $1,700 to keep their focus on $2,000. However, short term analysis shows that bears are gaining control and fast, thus the likelihood of Ethereum diving to lower levels.
The 4-hour chart brings to light the formation of a rising wedge pattern. Usually, this pattern is regarded bearish and leads to a trend reversal. Therefore, if validated, ETH may drop toward $1,600.
Notably, the 50 Simple Moving Average (SMA) on the 4-hour chart is in line to provide the much-needed support and help avert the potential losses. Nonetheless, if the bearish outlook remains persistent, Ether will be forced to look for support near the 100 SMA and the 200 SMA.
Similarly, the Moving Average Convergence Divergence emphasizes the growing pessimistic outlook. In other words, the least resistance path is downward until robust support is secured.
It is essential to note that Ethereum has recently grown to become the most significant protocol for trustless money settlement, overtaking Bitcoin. An on-chain metric by Glassnode shows that the Ethereum network is moving more value with Ether than Bitcoin blockchain, which uses BTC. Simultaneously, Ethereum 2.0 will review the high gas fees on the network; hence the value transferred might continue to hit higher highs.
Ethereum intraday levels
Spot rate: $1,735
Relative change: -7
Percentage change: -0.4%
Trend: Bearish
Volatility: Low
