Ethereum Classic (ETC) - March 28 (4h)It fell from the long-term uptrend line (1) and the uptrend line (2).
At 4.250, you must get support.
You need to make sure that you can ascend quickly to the long-term uptrend line (1) and the uptrend line (2).
The key point in your current location is 5.889.
------------------------------------------
All coins are located at attractive prices.
However, careful trading is necessary as BTC moves.
----------------------
Even if it's annoying, please click "Like".
Thank you.
Ethereumclassic

ETCBTC Just Got Its Horizontal Support Zone Confirmed [BULLISH]I was looking at this support zone for a while now. After a 6% price gain in about 24h, the price kept dropping and dropping rapidly. Finally it found support which made the bears temporarily leave.
I see two important resistance zones directly above it, to which I expect the price to increase. Now that the hit of the support zone seems like a possible reversal moment, I expect the price to reach above the resistance level 1 with a bit of struggle. Then, with an S/R flip I expect resistance level 1 to act as support to go to resistance level 2.
Follow me for consistent high quality updates, with clear explanations and charts.
Please like this post to support me.
- Trading Guru
--------------------------------------------------------------
Disclaimer!
This post does not provide financial advice. It is for educational purposes only!
About the links below:
20% Discount on Binance: Did you know that Binance introduced a new system where you can get 20% discount on your fees? Find the step-by-step guide on how to add it to your account on the website of 100eyes
Forex & Crypto Scanner: Nobody can keep track of all the pairs on all timeframes. This scanner works on Telegram and sends an automated message including a chart every time something happens to a coin. E.g. it can automatically detect areas of support and resistance, RSI Divergences, Fib Retracements, and more.
Also, check my recent popular ideas on BTC:

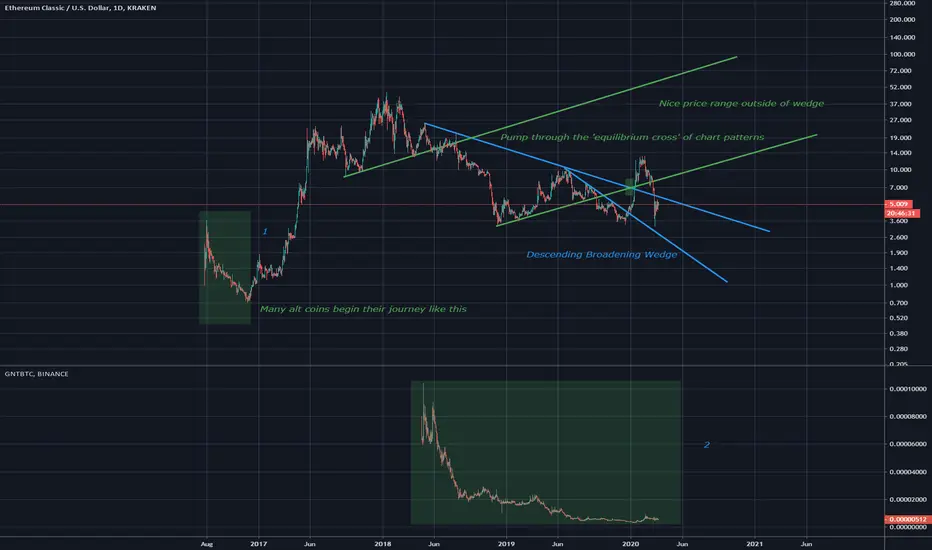
ETC and altcoin comparisonETC has formed a descending broadening wedge, this is a bullish pattern. There is a large price range for bullish movement outside of the wedge. Also included early phases of ETC and compared to GNT (golem), shows clear degeneracy, with a sharp reversal point. Big money to be made.
Ethereum Classic (ETCUSDT) short.All description on the chart.
Please, don't forget to like and follow.
Thank you.
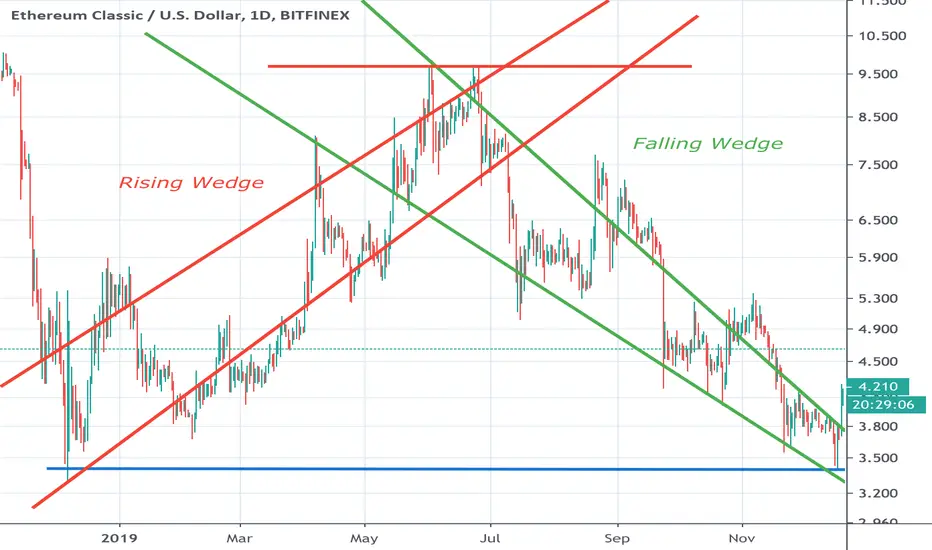
Some wedge symmetryExample of wedge symmetry, rising wedge turned falling wedge on the ETCUSD pair. The falling wedge begins wide at the top and contracts as it proceeds, eventually tightening to a point where it 'explodes' which can be seen. The rising wedge is the same except beginning wide at the bottom and tightening as it proceeds upwards, eventually leading to bearish movement. Apologies for the top red line it is not symmetrical at all!
Ethereum Classic (ETCUSDT) long.ll description on the chart.
Please, don't forget to like and follow.
Thank you.

On ETC it looks like we are in a 7 swings for now (corrective)?Regardless, it seems like we still need one more low in the current wave to give us divergence and finish a clean 5
#ethereumclassic

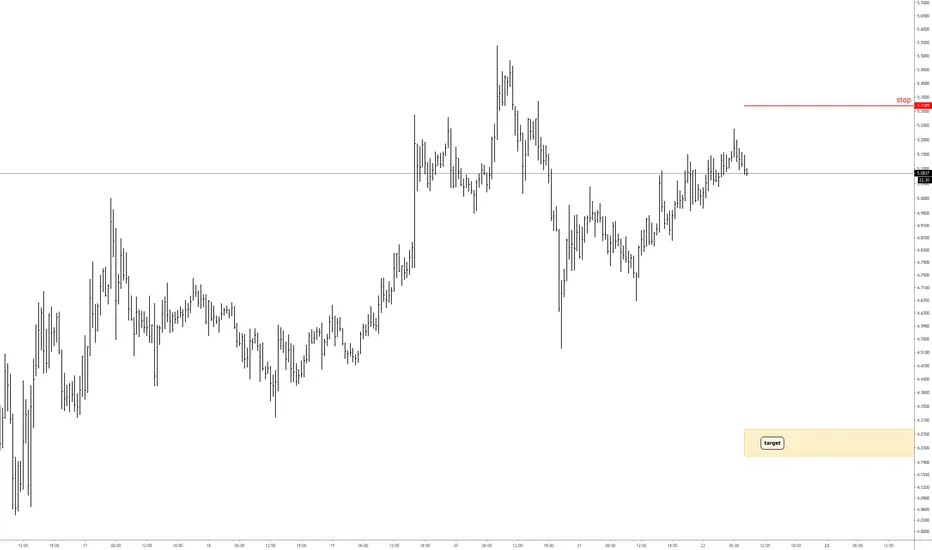
Nearing end of correction, long play in sightAfter 3 weeks of sitting out and waiting to hit target buy zone, we are almost there.
Trend-line support on the 5-year log is just above $7,600, and rising, 61.8% fib retracement sits at $8,250. Again, per my research, no Bitcoin rally has retraced less than 64%, ever, so I'm still eyeing that buy-wall around $8,000. $7,950 is my target strike price, but I will watch price action as we get near we may go lower, we may not break $8,000, we may tap $7,800 or so. I will let the chart tell me when the reversal happens.
RSI at 40 and falling, on the daily. Will be eyeing RSI of 30 near bottom. MACD, after almost signalling a bullish cross-over is diverging and showing weakness again.
I believe this is the 1st & 2nd wave of a 1,2,3,4,5 Elliot Wave pump for 2020 and the next one, wave 3, is going to be a solid rally.
As always, look for Tether injections, as rallys have always happened immediately after they occur.
Curious to see how this reversal develops. Will we get a big inverse head-and-shoulders from bottom? Or will we go sideways until we use the 5-year log support line to drive us up? Or, maybe, we fall through trend-line support and we're back to $6,000 in a month or two. This last possibility I highly doubt, but definitely cannot rule it out, anything is possible.
Will be layering in my buys, aggressively, and posting updates along the way.

ETC/BTC Bearish TimeHello Traders,
Today i am gonna be doing a quick analyses about Ethereum Classic, for this asset we have a big uptrend moviment, and now the bears held control of the price, we lost wall the fibonnacci Retracement levels, we dont have any bulls defence, and now the price is acumuting on it seens to be a Bearish Rectangule, the last chance to make the price have uptrend moviment is remaing above the 0.03828 level, if we lost this level, the price will go back to test the important support line.
Please support this publication with your like. You are welcome to follow us on the Tradingview.
Best regard Sandro and Gustavo.

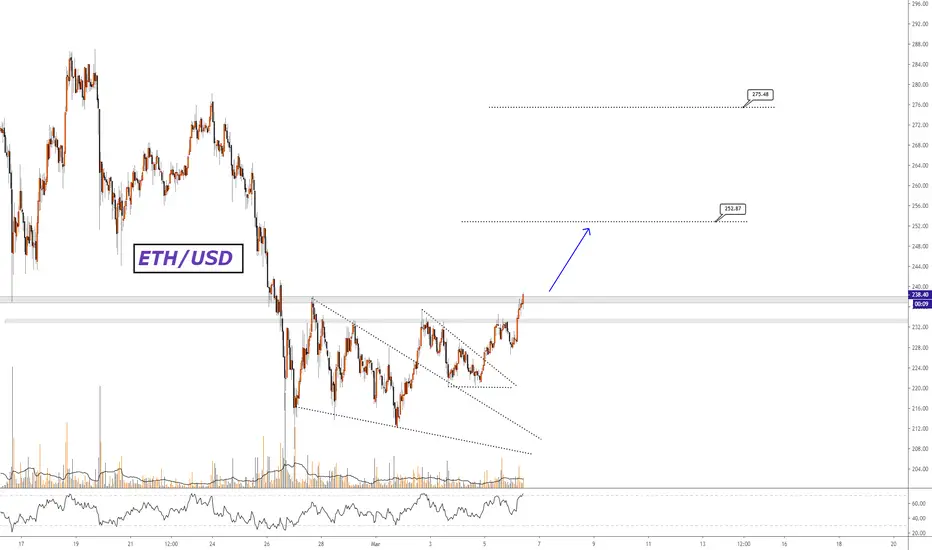
#Ethereum Short-term RiseHello dear, please support this idea by pressing the like button
- Target 1 : 252$
- Target 2 : 275$
Check out some of our previous analyzes and don't forget to click on the "Like" button
ETHUSD congratulations on our previous sellcheck my previous analysis tagged below to understand why we are buying as we see reversal on a support so we buy to next resistance
check my BTCUSD analysis too AND FOLLOW ME FOR MORE UPDATES THANKS

Ethereum Classic (ETCUSDT) long.All description on the chart.
Please, don't forget to like and follow.
Thank you.

Ethereum Classic Attempting push upward
Hodl that bag
If I had to enter here I'd put a limit at $8.50 with tight stop

Ethereum classic long potentialStrong linear regression uptrend, moving up along a strong upward trendline. Moonshot?

Ethereum Classic Heiken ashi in a chop range but still looks like it could be upward continuation
Renko on the bottom is showing a double bottom cup pattern
Order book seems in favor of the bulls
I don't have a crystal ball but if this trend continues I think we could top out in the mid $20s but that is just complete speculation based off Fibonacci extensions

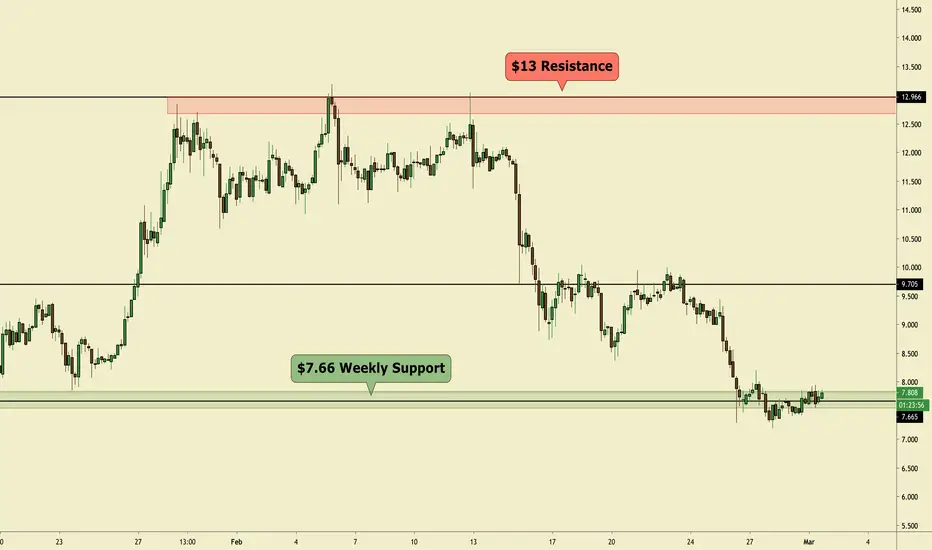
ETC|USD - Great Buy at $7.66 Weekly SupportETC move broke down after it couldn't close above $13 resistance, targeted $7.66 and from here the move should be done bleeding.
Great entry is along $7.66 support level.
As always please do your own research, I am not a financial advisor.