✴️ Ethereum Classic Moves Past EMA50Ethereum Classic (ETCUSDT) managed to move above EMA50 to the upside.
This is the first time this happens since July 2022.
Now, can it stay above EMA50?
We have the long-term higher low and basically the exact same conditions as we did last year.
The prognostications look good.
We can't say if it will or will not stay above this level.
The technicals are bullish and we can expect additional growth but here is how really things work...
If ETCUSDT moves back below EMA50, the mid-term bullish bias is lost.
Staying above this level and the bulls remain in control.
We got the breakout... It is for the market to decide how things will turn.
We should see growth for 1-2 months... Hopefully!
Namaste.
Ethereumclassic
ETC/USDT Secondary trend. Channel. Accumulation and distributionSecondary trend. Timeframe 3 days. Which formed a downward reset channel with a significant 108% move after a huge +2000% to 3000% pump. This is what happens when a coin is "forgotten about by all," not advertised in the news, and accumulated for such a long 2.2 years.
The real ether. The “green” parent of the expensive “black” ethereum.
Coinmarket Coin: Ethereum Classic
At the moment the price is approaching the uptrend of the main trend (long-term). Dynamic support (green) of the large channel.
The medium-term reversal zones of the secondary trend are shown on the chart and circled in yellow, on which (breakthrough / not breakthrough) depends on the further development of the trend.
The graph shows the accumulation and distribution zones. Zones of smart and stupid.
Position resets.
"Waves of interest" with price retention is expensive
1—distribution zone. Formation of a 6.5-month triangle). -61% from the reversal level of the triangle breakout.
2—zone after the triangle breakout. Formation of the descending channel.
The whole drop is 10.8 months (327 days).
The price is now at the “Hamster Pump” peak zone (buying back liquidity “expensive” from those who didn't want to sell cheap) $17.22 - $20 before a huge pumping +2244% of the average set price.
Accumulation in the horizontal channel, 2.2 years.
The channel is 100% $3.78 to $7.35. Average liquidity set price of $6.
Maxima—$13.18 (redemption of coin volume “expensive” for subsequent failure under market dump).
Minimums—$3.1 (market dump 13 03 2020).
Expensive and cheap ether. Mining.
Ethereum is moving to version 2.0. There will be a transition from proof-of-work to proof-of-ownership, and mining on video cards will cease to be profitable. This will happen in the second half of 2022, perhaps even this summer.
This very unpopular and painful decision (inevitable) has been dragging on for 3 years now. It is very likely that this year will be the end of this problem. It's not hard to guess which cryptocurrency the miners who mine ETH now will most likely switch to. Consequently, it can very positively influence ETC price.
For those who don't know, let me remind you. ETC is the true ether. ETH is a fork. Forced fork, to get back stolen ETCs during attack on DAO (just to roll back transactions of “hackers” wallets).
That's how 2 Ethers came into existence. ETC (limited quantity of coins) and ETH (unlimited quantity of coins). Of course, they began to promote and develop centralized fork, that is ETH.
The whole story about birth of ETH with ETC and the story (real imitation) with hackers attack on DAO and stealing of ETC coins was made just for “birth” of more centralized crypto-mint for testing technology, especially smart contracts on it.
Under the idea fixed my previous trading ideas for this coin, including closed (pre-pump recruitment zone).

ETC(Ethereum Classic): +20% In One Week...What's Next?ETC(Ethereum Classic): +20% In One Week...What's Next?
This is an analysis that I shared one week ago.
The first bullish move was perfect + 20% profits so far.
So if you are happy you can close these profits also here:)
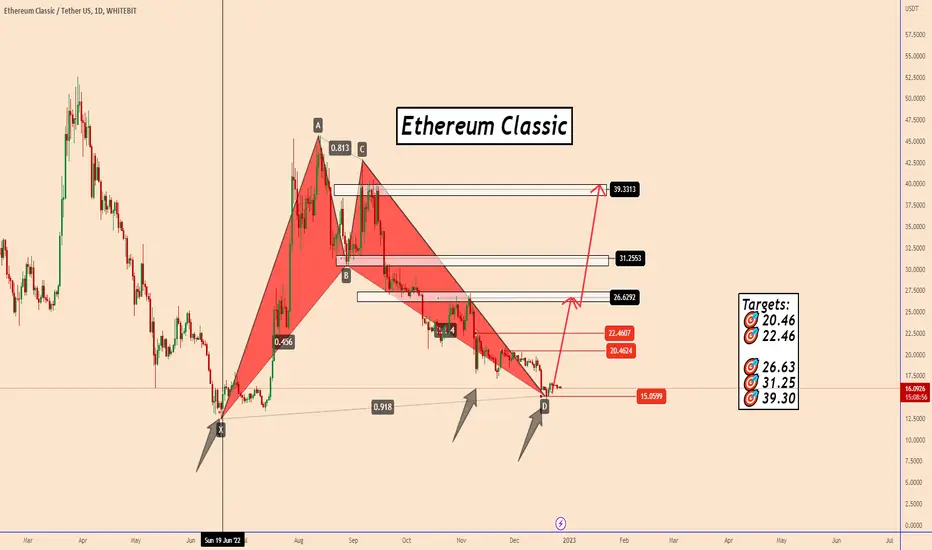
However, the price completed this beautiful harmonic bullish pattern
and it can be a good signal that the bullish wave should be ready soon.
PS: If all will be well regarding the fundamental outlook of the crypto market the price should rise again from this point.
Targets:
🎯 20.46
🎯 22.46
🎯 26.63
🎯 31.25
🎯 39.30
Thank you and Good Luck!
Previous Analysis:

✳️ Ethereum Classic vs Bitcoin Fully Mapped (70% to 198%)We have a lovely chart here for Ethereum Classic vs Bitcoin (ETCBTC).
We've done multiple analysis on the ETCUSDT pair for you, we hope you are enjoying them but the bitcoin pair is actually our favorite...
We like bitcoin pairs because the more bitcoin one can accumulate the better.
ETC peaked in September 2022.
A strong and long correction followed.
This correction hit a low 19-December, which is 104 days from peak to valley.
We say that cryptocurrency trading pairs tend to correct between 2-3 months.
Here we have a perfect 3 months correction.
Support is found right at the 0.786 fib. retracement level relative to the bullish wave that started in mid-June.
Now we have a bullish candle as prices move above EMA10.
This is how it all starts...
First a low/bottom, June 2022.
The main wave starts and peaks September 2022.
Second comes the correction that ended last month with a higher low.
And in January 2023 we resume the growth.
Additional details (targets and support) on the chart.
Namaste.

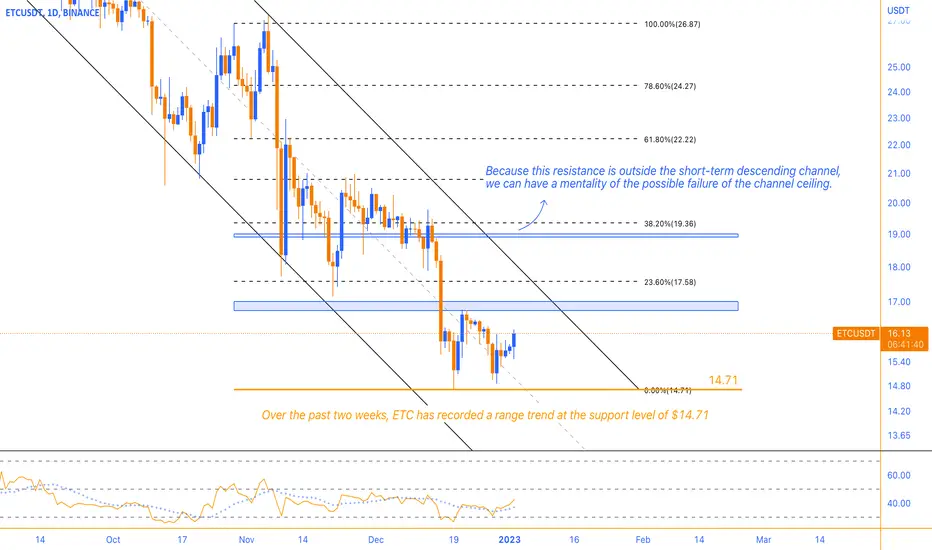
ETC - The classic twin bottom pattern is formedOver the past two weeks, ETC has recorded a range trend at the support level of $14.71. While swinging on this support, the classic double bottom pattern is formed, and if the neckline resistance of the pattern is broken, i.e., the break of the $16.75 to $0.17 range, we can consider the pattern confirmed. The price target after confirming the pattern is considered in the range of 18.90 to 19 dollars. Because this resistance is outside the short-term descending channel, we can have a mentality of possible breaking of the channel ceiling.
Of course, this breaking could be fake because in the current downward trend, the power of the bearish candles is greater, and still, because the pattern's neckline is broken, the trend in the 4-hour timeframe can also be bullish. Therefore, pullbacks will face demand for support. The downtrend line on the RSI is being broken, which could be a good sign for this week. Of course, if the last daily candle closes well, we expect this upward movement.
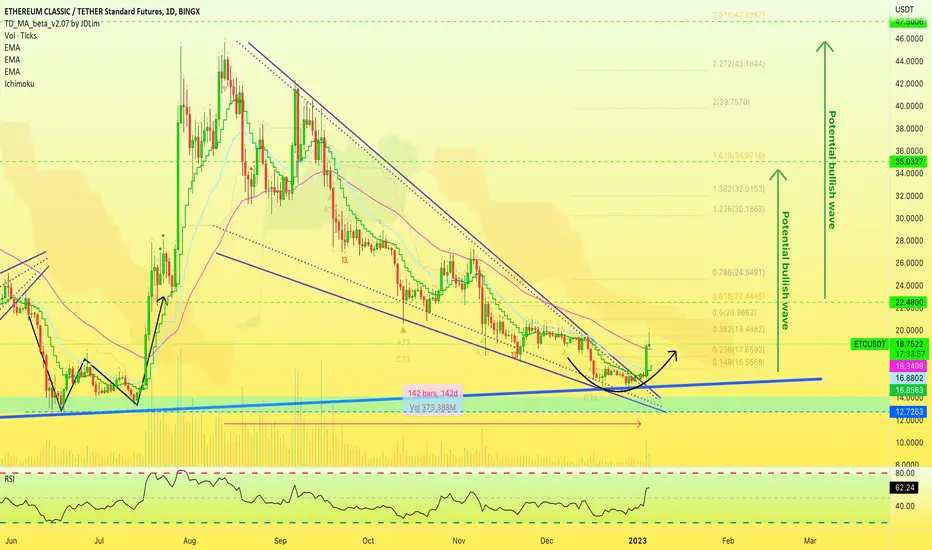
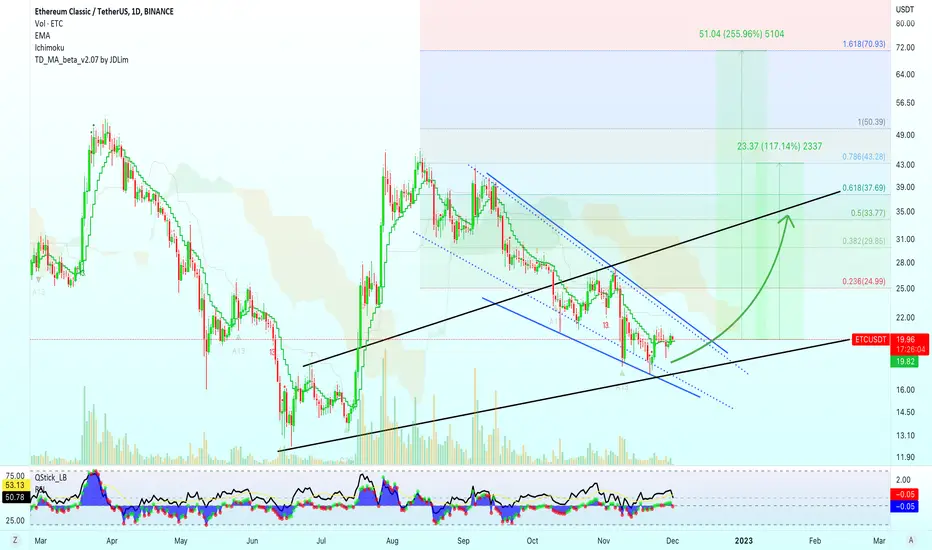
✴️ Ethereum Classic Part 2 | Can It Go Higher Than $45?Part 1 is the July/August 2022 bullish wave...
It is hard to believe but its been more than 4.5 months since the last high.
Cryptocurrencies tend to correct for 2-3 months, normally... This time it has been already 4.7 months and we are still within a higher low.
What this means is that the next bullish wave is overdue.
Even on another shakeout, it gets closer and closer with each passing day.
Higher lows lead to higher highs... So there is potential for Ethereum Classic to go above $45 .
See the chart for additional information.
Namaste.

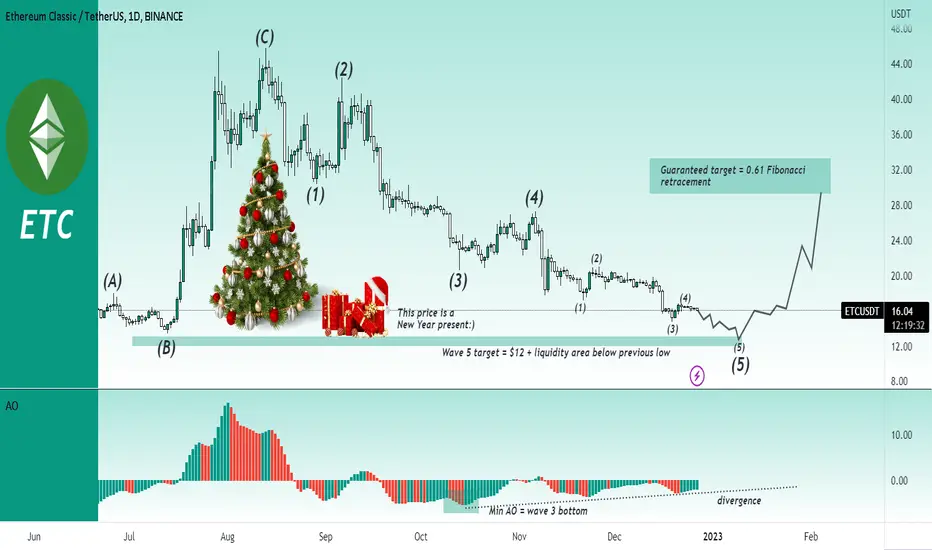
Ethereum classic ETC has almost reached the bottom!Hello, traders!
Last couple of days we told about we told about crypto assets which have to dump significantly before reaching the actual bottom. Today we have Ethereum Classic which in my opinion has only 20% potential dump before the new bull run .
ETCUSDT showed the wonderful corrective wave C which caused the FOMO and hit $45 , but after that the ending wave 5 became the huge disappointment for hurried traders. This wave has the clear internal structure. Minimal Awesome Oscillator value helps us to find the bottom of the wave 3. The entire cycle can be drawn using the wave 3 point. I suppose now ETC is in wave 5 inside wave 5. It has the natural target $12 where I am going to buy this cryptocurrency.
Even if Ethereum Classic is a scam the buyer reaction is anticipated from this level because it’s the huge liquidity are. The guaranteed target is the 0.61 Fibonacci at $30 , therefore we can make an easy 2x . I am going to execute this trade.
Best regards, Ivan
________________________________________________________________________________________________
If you like my trade ideas, please smash the boost button to stimulate me make more quality analytics!
ETC: Price Finally Completed a Bullish Harmonic PatternETC: Price Finally Completed a Bullish Harmonic Pattern
After so many days the price completed a harmonic bullish pattern
which I have shared before.
Trading volume is very low since FTX dumped the entire crypto market.
However, the price completed this beautiful harmonic bullish pattern
and it can be a good signal that the bullish wave should be ready soon.
PS: If all will be well regarding the fundamental outlook of the crypto market the price should rise again from this point.
Targets:
🎯 20.46
🎯 22.46
🎯 26.63
🎯 31.25
🎯 39.30
Thank you and Good Luck!
ETHUSD Ethereum : Crash or dash? That's on you! 13.6Let's cut out the psychological pressure of seeing red and look at facts.
What's right now dominating the financial markets?
Inflation and panic selling.
What happens once the dust settles?
Think about "investment", what makes it attractive?
Crypto currency and specifically the Ethereum is an excellent hedge against inflation, fundamentally.
With scarce supply which is likely to burn faster than mined, and technology which could be the future of payment solutions - Ethereum shines.
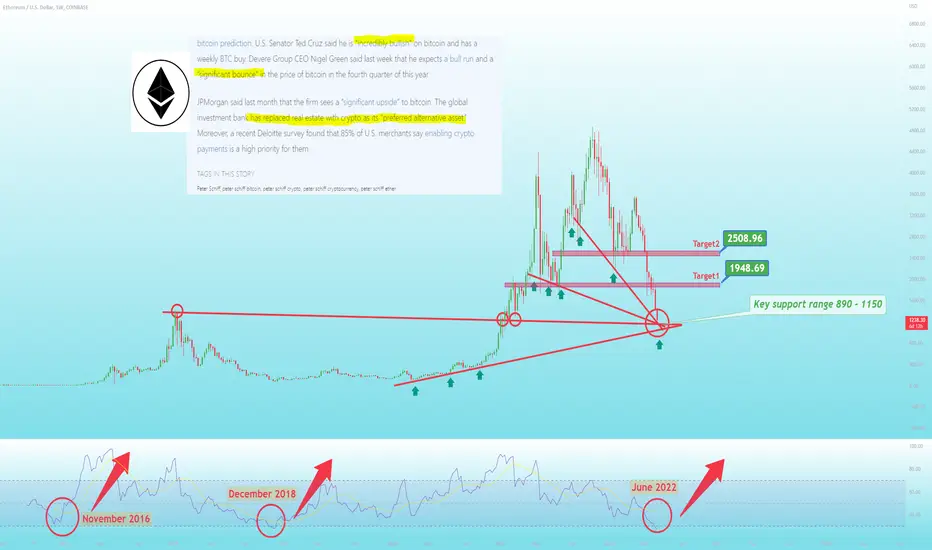
So let's explain the crash technically:
1) Oversold condition which is only comparable to November 2016 and late 2018 - Both times proving to be extremely attractive buys.
2) Connecting trend-lines spanning back 1-4 years show very tight convergence between 890 - 1150.
3) A "Falling wedge" pattern is visible on a weekly time frame, which is bullish.
JP Morgan among other major names in finance name Crypto currency to be a smarter investment than real estate in current climate.
Don't let your emotion control your judgement, don't let fear run you out of investment.
Be smart, be patient, be calculated.
---------------------------------------------------------------------------------------
Thank you so much for reading! If you found my idea useful please like and follow - It would mean a lot.
My goal is to help as many traders as possible make sense of the markets.
If you have any questions or comments please don't hesitate, it's the fuel to keep me going :)
----------------------------------------------------------------------------------------
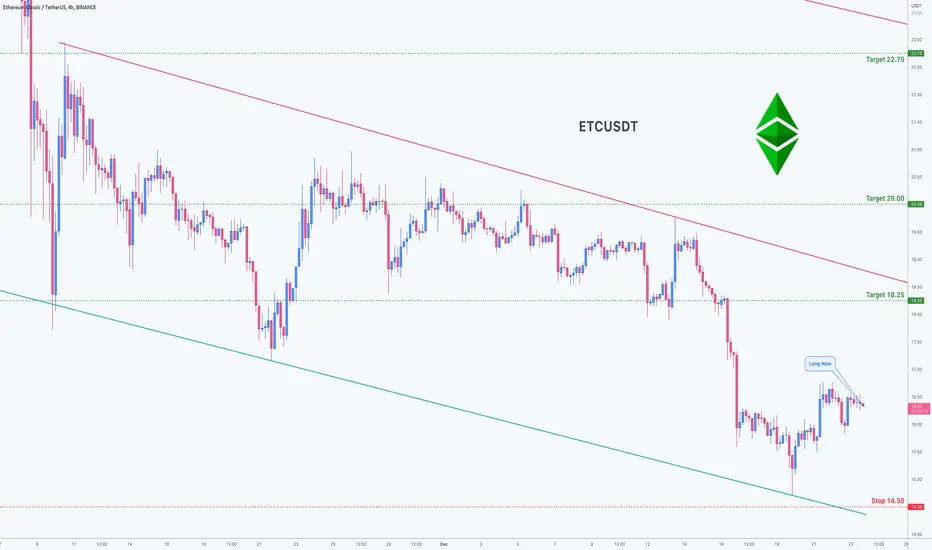
Trading opportunity for ETCUSDTBased on technical factors there is a Buy position in :
📊 ETCUSDT
🔵 Buy Now 16.34
🧯 Stop loss 14.50
🏹 Target 1 18.25
🏹 Target 2 20.00
🏹 Target 3 22.75
💸RISK : 1%
We hope it is profitable for you ❤️
Please support our activity with your likes👍 and comments📝
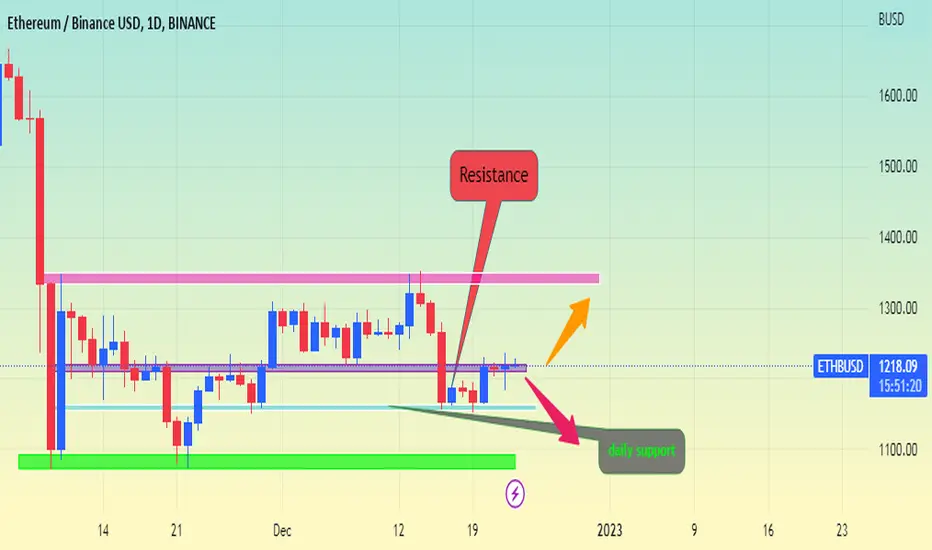
ETH ANALYSIS#ETH UPDATE.
#ETH is currently trading at the resistance area on daily,since eth could not close above the resistance last day we must wait eth to close above the blue box resistance area.On closing above the resistance the next resistance for eth would be pink box area.
✴️ Ethereum Classic Weekly | Falling Wedge Clear Picture (120%) It doesn't need any analysis does it?
Ethereum Classic (ETCUSDT) on the weekly timeframe gives a clear picture.
We have the classic falling wedge pattern and a perfect -9 on the TDs showing up.
We have a long-term higher low when looking back at June and the value area also points up.
No need for more analysis... Over 120% possible in 2023 Q1.
Namaste.

✳️ Ethereum Classic vs Bitcoin Has 100%+ Potential Or MoreLook at this signal, the RSI for Ethereum Classic (ETCBTC) hit its lowest level since November 2020.
Last time this same level was hit on the daily RSI ETCBTC went on a massive bull-run, the biggest in its history.
The entire wave produced a total increase in price of 1,816%.
A strong/long-term support level has been activated.
There is potential for a bounce at this level.
There can be one final drop or a period of consolidation before the bigger wave.
The time horizon is between January and March 2023 for this bullish wave to take place.
Get ready... Be prepared!
You've been warned, in a positive way.
Time will tell of course.
Namaste.
Legend: ✳️ = Altcoins vs Bitcoin | ✴️ = Altcoins vs Tether | 🅱️ = Bitcoin | 📈 = Index | 💾/💿 = Stocks/Conventional Markets

Coinbase to delist Ethereum Classic ETC from Coinbase Walletpast chart
Coinbase to delist Bitcoin Cash (BCH), Ethereum Classic (ETC), XRP (XRP), and Stellar ( XLM ) from Coinbase Wallet!
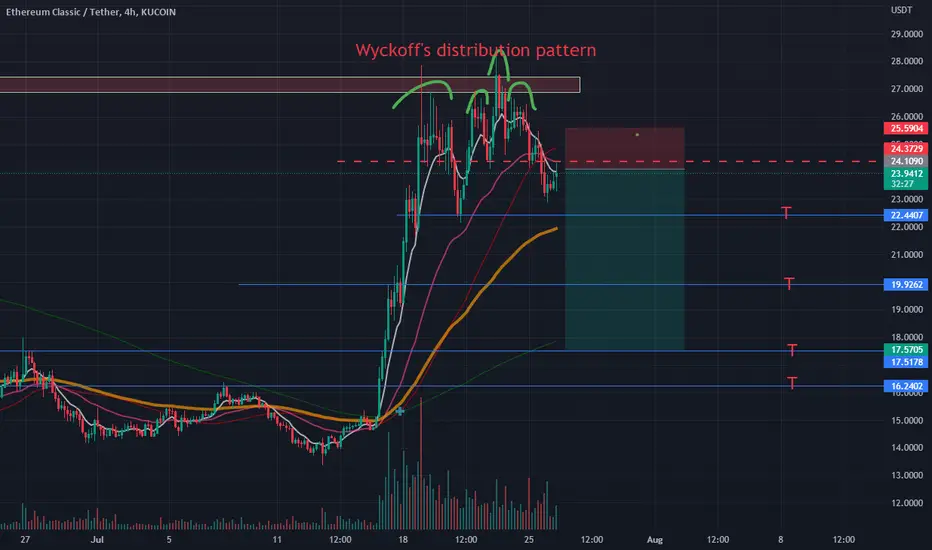
My price targets:
ETC/USDT short
Entry Range: $19 - 20
Price Target 1: $16.77
Price Target 2: $14.24
Price Target 3: $12.82
Stop Loss: $23

Shorting ETC yet! Showing the distribution pattern!! Feel like gonna drop a lot. It is kinda meme coin tbh it looks like a risky trade but I'm taking it with 3 percent of my portfolio.. The meat looks fresh and juicy.

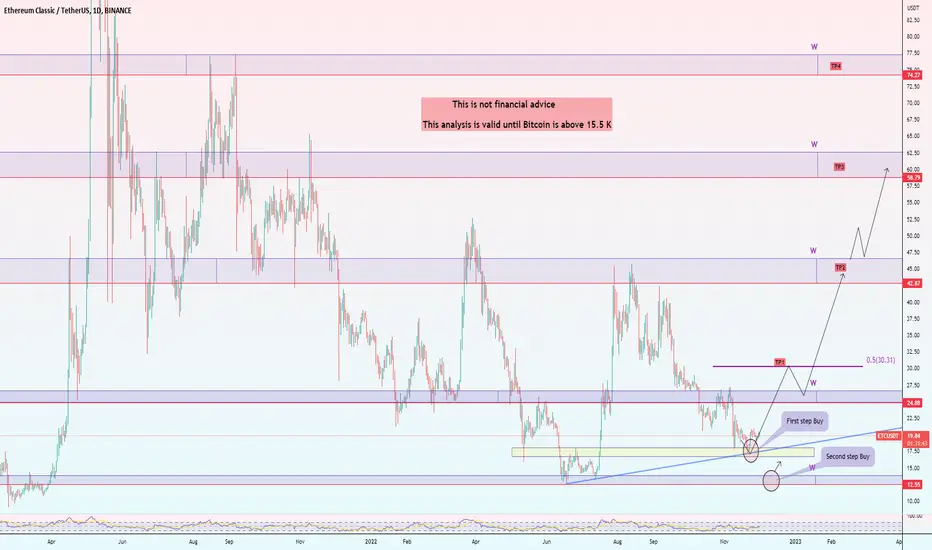
ETHEREUM CLASSIC, a long term vision. ETCUSDTHello my friends, A multi timeframe analysis of ETC and a long term vision for investment if you still trust crypto for next months and years. two points to buy 16$ and 12$ , so you can consider it and manage your money.
Good luck
If you like the idea, do not forget to support with a like and follow me for next analysis :)
Write your comment and opinion below for me
Ethereum Classic | DiversifyThis is one of those that I hold personally for a safe double up.
I keep conservative targets, being happy with 50%, 70% or 100% and then consider a move to the next pair/chart.
Sometimes we aim much higher of course, but that too through diversification; Taking many trades by splitting our capital.
Reducing risk and increasing our growth potential.
Some pairs will go ahead and grow 20-30% in days and even reach 200%, 300% and beyond.
Just one trade can change the course of your portfolio... We can't take them all.
Diversifying helps to take advantage of those pairs that move stronger...
Since one will only grow by a total of 50% while another can easily do 500% or 600%.
If we do 5% on 20 pairs or 10% or 10 trades.
We put a strong limitation on any individual pontetial loss.
Yet our growth potential can remain really big if we know how to pick the right charts.
There are many ways to pick which charts to trade.
I like those before the bullish breakout take place.
Namaste.
Ethereum Classic vs Bitcoin ConsolidationThe bulls have the upper-hand here.
Ethereum Classic peaked 6-September vs Bitcoin.
A strong correction followed which ended in a sudden stop, flat.
Going flat at exactly the 0.618 Fib. retracement level which is the Golden ratio and at the same time MA200 support, on low volume, is a strong giveaway if you are into reading the charts.
Some more consolidation yet at any time, ETCBTC can shoot up.
A drop is always possible but low propbability at this point.
Support remained intact 8-9 Nov. when we had a strong drop all across... If it didn't fail back then, now we just wait for the move up.
Namaste.

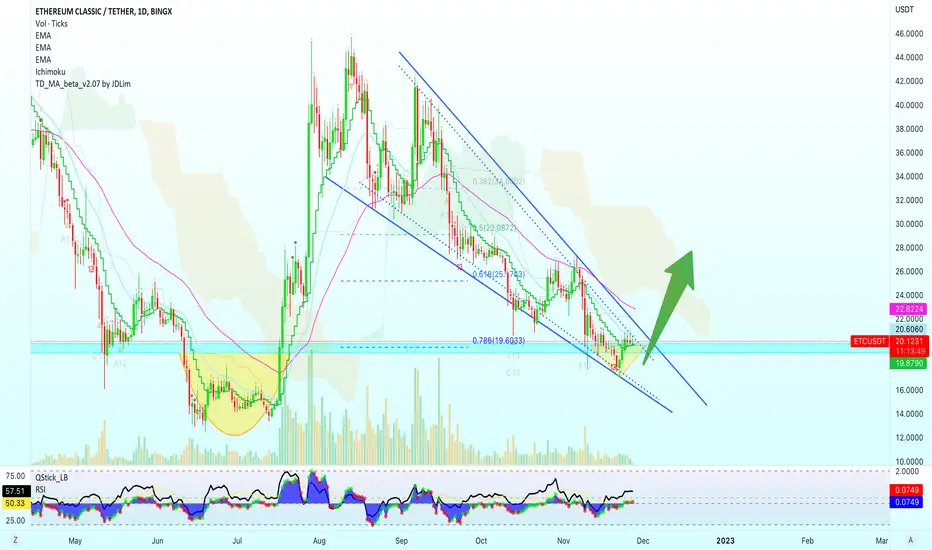
5 Classic Signals Tells Us Ethereum Classic Will GrowWe have a convergence of multiple classic signals on the Ethereum Classic vs Tether chart.
Let's look at those now.
1) The classic falling wedge pattern.
2) The very common higher low (Nov.-higher vs June-lower).
3) Price bounce after hitting below the 0.786 Fib. retracement level.
4) Strong RSI (bullish above 50).
5) Trading above EMA10.
Each of these signal is strong enough by itself...
In conjuction, the paint a clear for ETCUSDT; The bullish bias here is strong.
Namaste.
ETH USDT SHORT 👑Hello TradingView community 🚀 and my followers, please if you like the ideas, don't forget to support them with likes and comments, thank you very much and here we go.
Today I want to talk to you about the ETH chart.
At the moment price break the structure.
Then, I think ETH breaks continue to move down to my goal.
My target is located at charts level.
I expect this scenario.
This is my opinion, I really hope it will be useful for you.

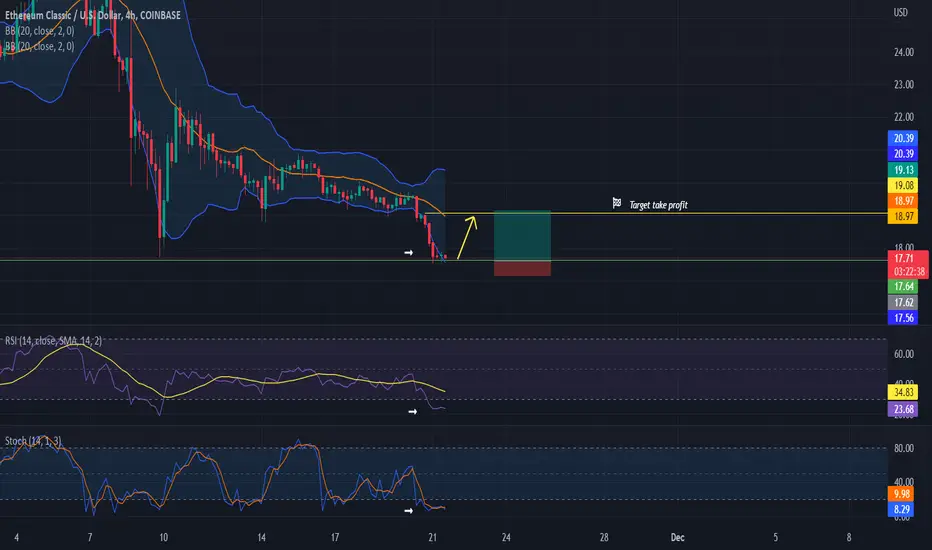
ETCUSD - Long - Small bounceOn the chart we can see the price is currently in oversold condition. As we can see all the three indicator are suggesting the oversold condition. So this can be an shortt-erm oppurtunity to get approximately 7% profit if this plays out.
The indicators used are Bollinger Bands, RSI and Stochastics.
See further details on the chart.
Goodluck!
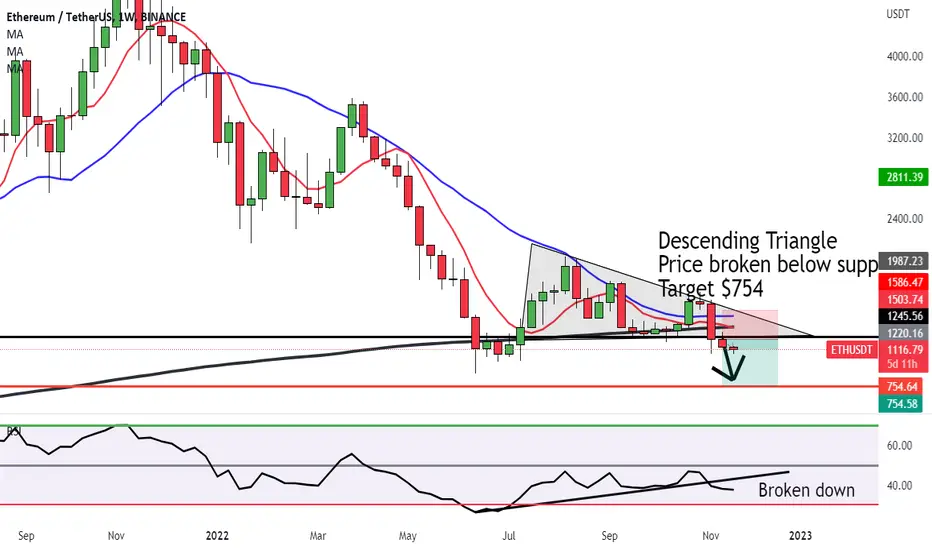
Ethereum price target still heading to $754 which sucksWe did this analysis last month and the price is still coming down based on the Descending Triangle.
First target is $754. This actually is sad because I am a big supporter of Ethereum and what it stands for with future technology with smart contracts.
But right now, it can't beat the Crypto Season of snow and will continue down...
I will wait for Ethereum to hit about $2,000 before I buy a couple of them for long term investments.
Until then, this winter can last a few years before the aftereffects from FTX, BTC, Luna and Crypto.com (soon) resolve.