Ethereum has crossed up the long term resistance levelsHi, friends hope you are well and welcome to the new update on Ethereum coin. As we have already seen that on the long-term weekly chart the Ethereum was moving in a descending triangle and now finally the price action has crossed up the resistance of this triangle. The current weekly candlestick was started on 27 July. Once the candlestick will be completely closed above this resistance then we will be confirmed that finally the price action has broken out the resistance successfully.
And if we watch the different indicators then Moving average convergence divergence (MACD) indicator was turning bearish but now it is turned strong bullish. The stochastic gave bear cross after entering in the overbought zone and finally we also have received a bullish signals by the stochastic as well. In the meanwhile the momentum indicator was ignoring the bearish signals of MACD and stochastic and it was continuously bullish. Finally the stochastic and MACD followed the bullish signals of momentum and again turned bullish.
The channel has been broken out:
On the daily chart the priceline of Ethereum was moving in an up channel and finally it has successfully broken out the resistance of the channel. I've also placed the moon phases indicator on this chart and can be easily noticed that the new full moon is appeared at high altitude above the resistance. That was clear indication that the price action can move up to this level. The new dark moon was appeared below the support but it was higher than the previous dark moon that was another bullish indication.
If we watch the MACD indicator then it was strong bullish but now it is turning bearish. The stochastic is also giving bear cross. But the momentum is still bullish so we can expect that now the price action might re-test the previous resistance of the channel as a support and from there it will start the next rally.
Support and resistance levels:
If we take a look at the 4 day chart then different support and resistance levels can be easily seen. In the month of March 2020 the price action has the support at $115 and from there it started the bullish move and broke out the next resistance of $150. Then price action broke out the $225 resistance and re-tested the previous resistance as support. Now price action is breaking out the $280 resistance and a strong resistance block that starts from $310 and ends at $325. This is very strong resistance block that is not broken out since September 2018. Once the price action will be able to break out this resistance block then we will have the next resistance at $310.
The SMAs have formed opened alligator mouth:
If we watch the different simple moving averages on the daily chart with the time period of 25 50 100 and 200. Then it can be easily observed that the price action was re-testing the 25 and 50 simple moving averages as support. And after successful re-test it has started the next bullish rally. In the meanwhile the 25 simple moving average was and moving sideways with 50 simple moving average and crossed 50SMA little bit down. Now it is also moving up and now a complete opened alligator mouth is formed by the simple moving averages because we have the smallest time period moving average 25 above all then we have 50 then 100 and then 200 below all other SMAs. Now the simple moving averages can lift the priceline of Ethereum in a parabolic way.
The bearish cloud is broken out:
If we again switch to the long term weekly chart and place the Ichimoku cloud. Then we can see that the lagging span of Ichimoku cloud has crossed up to priceline and the cloud as well. We have received a powerful bull cross by the conversion and the baseline just below the price action of Ethereum. Now the candlestick has crossed up the bearish cloud as well. Once we will have a complete closing of this candlestick above Ichimoku bearish cloud then we will be confirmed that the price line of Ethereum has broken out this strong resistance of cloud successfully. We can also observe that the Ichimoku cloud has also turned bullish. After this big breakout a new era of bull run will be started that can continue for years. Because before this breakout we have already seen that this cloud was working as a strong resistance and once this resistance will be broken out then it will be working as a strong support.
Conclusion:
Even though all signals and patterns are bullish but there is also a possibility that while re-testing the previous resistance levels as support the price action can move down in case the re-testing will be failed. If it would be happened then the price action can re-entered the channel that was formed on daily chart. Therefore we should use the support of the previous channel as stop loss.
Ethereumdollar

ETH/USDT: The Only Chart You Will Ever Need 1H (Jul.25)X Force Global Analysis:
If you find our analyses to be helpful, make sure to support us by dropping a ‘like’
In this analysis, we explore Ethereum's hourly chart on its Tether (USDT) pair. We recommend that traders approach this setup from the perspective of the volatility breakout strategy, popularized by the legendary trader Larry Williams.
Analysis
- The first thing we can spot is that Ethereum has been in a steady yet steep uptrend within an ascending parallel channel
- Prices continue to form higher highs and lower highs, as the Exponential Moving Average (EMA) Ribbon acts as strong support below price levels
- We can also spot the Ichimoku cloud acting as strong support for the current trend
What We Believe
Given such strong indicators of support, it's important that traders look for opportunities in short term uptrends, and sell when Ethereum starts losing momentum, or provides confirmation of a bearish trend by breaking and closing below the three significant indicators of support mentioned above.
Let us know what you think in the comment section below
Trade Safe.

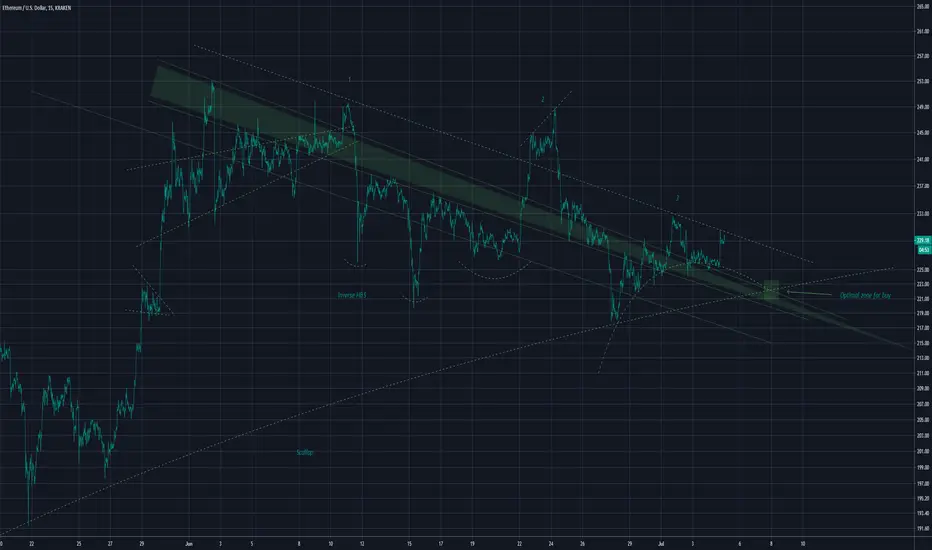
ETH/USDT: Short Term Elliott Wave Count Analysis 15m (Jul. 27)X Force Global Analysis:
If you find our analyses to be helpful, make sure to support us by dropping a ‘like’
In this analysis, we look at Ethereum's 15 minute chart on its Tether (USDT) pair to assess its next potential move.
Analysis
- Firstly, we can see that Ethereum is trading within an ascending parallel channel, a sign of bullish momentum
- Unfortunately, however, prices are creating higher highs, while the Relative Strength Index (RSI) creates lower highs
- Based on our Elliott Wave count, after seeing a corrective wave in play (ABC), we are currently in the midst of an impulse wave count (12345)
- With the Moving Average Convergence Divergence (MACD), we could potentially expect a bullish move to play out to the channel resistance
- This would validate the current bearish divergence of prices forming higher highs while the RSI forms lower highs
- Ethereum has been trading above the 100 Simple Moving Average (SMA) for an extended period of time, and a break and close below this moving average could provide further confirmation of a trend change.
What We Believe
While Ethereum has had a nice rally, based on Elliott wave counts, we expect Ethereum to reach higher highs within the ascending parallel channel for the immediate term.
Let us know what you think in the comment section below
Trade Safe.


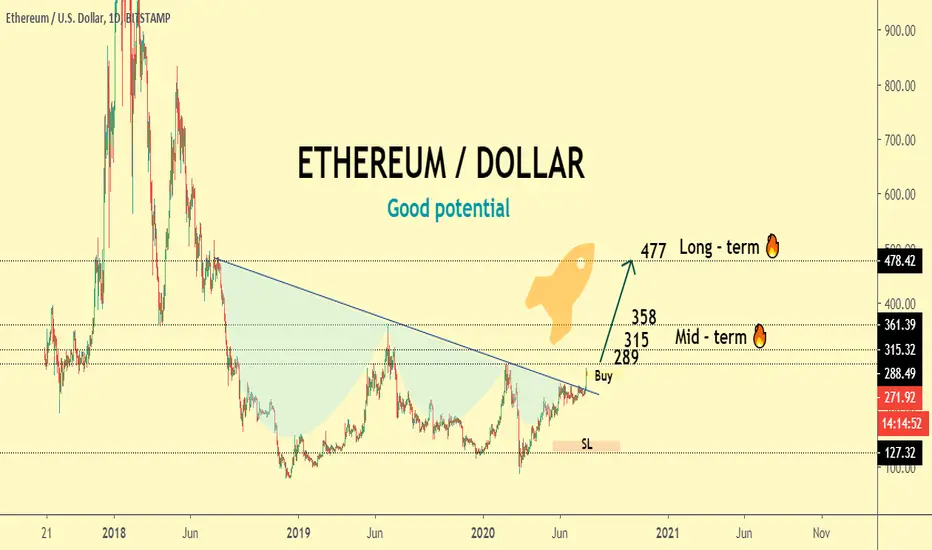
Ethereum 🔥Hello, dear! 🧡
I'm thinking of buying Ethereum for a long - term. Looks too tempting🔥🔥🔥
Continue my hashtag #rocketbombquickidea for you🔥🔥
If you like such format of my quick analyzes, support idea with like. I'll try to find more opportunities for making 💰
Always in touch with you🧡
Sincerely Your Rocket Bomb 🚀💣
PS Many alts just give wonderful profits.🔥🔥🔥
My previous work👇🏻👇🏻👇🏻
ETHUSD this dump in an invitation to a powerful pumpFailed in breaking out the resistance:
Hi guys and gals hope you are well, welcome to the new update on Ethereum, the Ethereum was going very good and after crossing the $224 resistance it was expected that it will use this resistance as support and move up to hit the next resistance level but the price action has failed to retest the resistance of $224 and dropped down at previous resistance level at $149 and even now hitting at the next support level at $122. Before breaking down the $244 the support the price action went very close to $310 resistance $290.
Simple moving averages are broken down:
On daily chart the priceline of Ethereum was moving above 100 and 200 simple moving averages and it was expected that these moving averages will work as strong support for the priceline but the bearish move was very strong and now we can see that the candlesticks has broken down the both simple moving averages on daily.
Ichimoku cloud:
In my previous article we have discussed that the priceline was likely to cross the ichimoku bullish cloud and conversion line had formed bull cross with the baseline just below the priceline of ethereum and Ethereum achieved highest price by moving up 12933% bullish move. This time the price line of Ethereum was moving below this cloud since July 2018 and the current during current bull rally it was expected that candle sticks will cross up the bullish cloud. Unfortunately this time the priceline of Ethereum did not cross the bullish cloud and dropped down. Once the priceline will be successful in crossing up the bullish cloud then we can expect a really very big bullish move like it has taken in 2017. No one can say anything that this time the priceline of Ethereum will produce 12933% or more or less profit but it can make really very big bullish move.
Harmonic move:
If we see on monthly chart then the strong bearish move has completed the final and last leg of bullish Gartley pattern which was being formed. It was started on December 2018 and the first leg was completed on June 2019 then the price action retraced upto 0.786 level here I have ignored some extra spike. From here the price action was suppose to be projected between the projection area of A to B leg from 0.382 to 0.886 Fibonacci level and after being projected in this area the Ethereum was suppose to be retraced between 0.618 to 0.786 Fibonacci level. After this retracement now the price action is suppose to be projected between 0.382 to 0.786 Fibonacci level and this is the projection of A to D leg.
Now we can see the priceline of Ethereum even has hit the spike even beyond the potential reversal zone of this big bullish Gartley pattern but unless the candle sticks will be not closed below the potential reversal zone it cannot be considered that this PRZ level has been broken down.
Now from this potential reversal zone the candlesticks are suppose are to be projected between the projection area of A to D legand this bullish divergence can also lead the price action of Ethereum to breakout the ichimoku cloud as well and we have discussed earlier once the pipeline will cross up to cloud on weekly chart then it can turn more bullish to produce very big profit gains.
The range of potential reversal zone and Fibonacci projection area:
And as per bullish Gartley the potential reversal zone of this pattern starts from $188 and ends at $141. And the Fibonacci projection starts from $225 and ends up to $315 this is the level where we also have key level resistance of Ethereum $310.
Stop loss:
Maximum extent of potential reversal on should be used as stop loss point in case if the candle sticks will be closed below this area because once the priceline will break down this PRZ level then the price action may go for bullish Butterfly and can retrace more down between 1.27 upto 1.618 Fibonacci level.

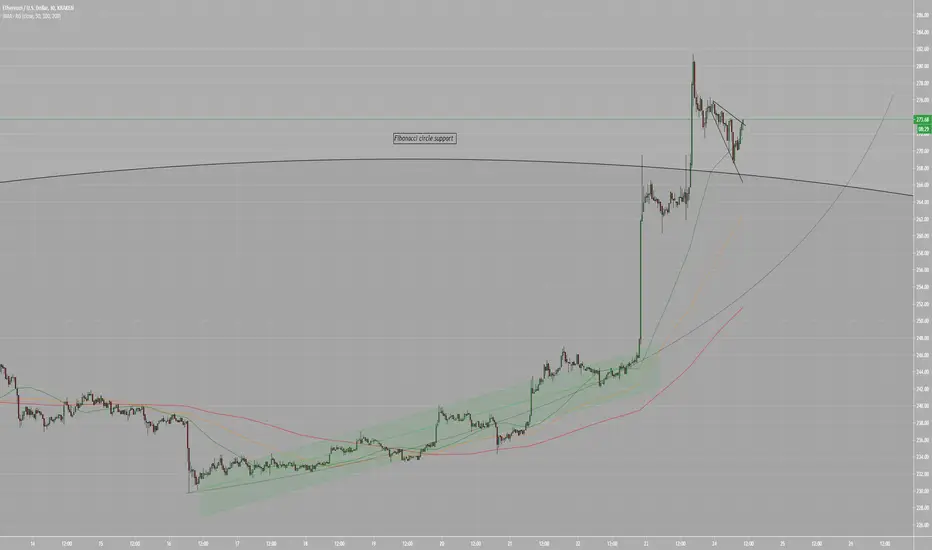
Ethereum Gaussian Channel AnalysisBig buy signal
Chart explains
Inbox me if you would like a link to the Gaussian channel indicator :))

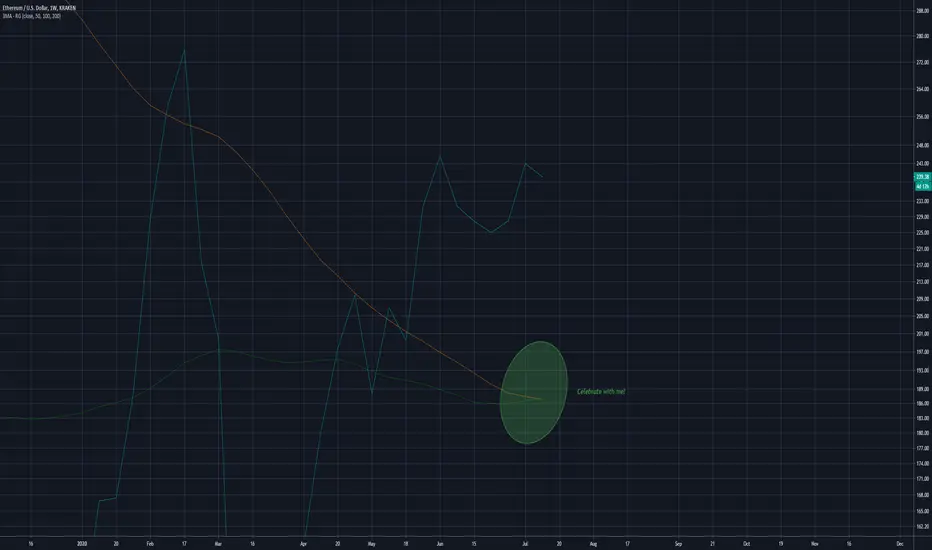
Ethereum's first ever WEEKLY golden crossHappy days for ETH holders
Should lead to some bullish results
Altcoin intraday outlook - EthereumFalling wedges can be seen
Also a possible bullflag on ETH
Best of luck with trades, i hope for some volatility soon
Bix

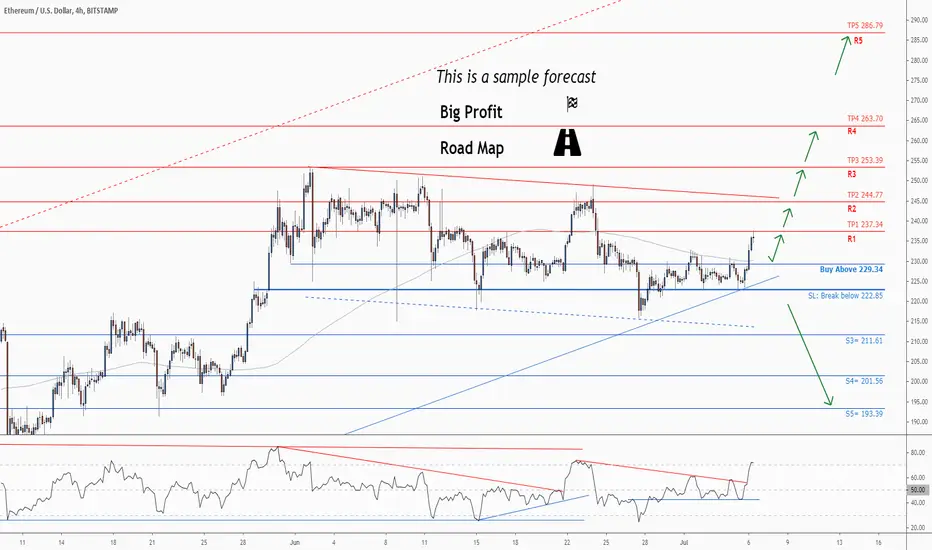
Don't miss the great buy opportunity in ETHUSDTrading suggestion:
. There is a possibility of temporary retracement to suggested support line (229.34). if so, traders can set orders based on Price Action and expect to reach short-term targets.
Technical analysis:
. ETHUSD is in a range bound and the beginning of uptrend is expected.
. The price is above the 21-Day WEMA which acts as a dynamic support.
. The RSI is at 73.
Take Profits:
TP1= @ 229.34
TP2= @ 222.85
TP3= @ 211.61
TP4= @ 201.56
TP5= @ 193.39
SL= Break below S2
❤️ If you find this helpful and want more FREE forecasts in TradingView
. . . . . Please show your support back,
. . . . . . . . Hit the 👍 LIKE button,
. . . . . . . . . . . Drop some feedback below in the comment!
❤️ Your Support is very much 🙏 appreciated! ❤️
💎 Want us to help you become a better Forex trader ?
Now, It's your turn !
Be sure to leave a comment let us know how do you see this opportunity and forecast.
Trade well, ❤️
ForecastCity English Support Team ❤️

ETH 15minMight be forming a rounded bottom,
I wouldn't wait to go long however as this is the fourth test of the upper band and generally it takes 3 tests i have noticed before a breakout occurs.
Broken out from a falling wedge
Some chart patterns for Ethereum
ETHEREUM TO $450. THE JOURNEY HAS STARTED.Sometimes a simple chart is the best one. Strong cluster of resistance at $325-375, past that the fun starts. #DeFi is blowing up. We will chart ETH consistently along with the sector. Have fun, be smart. Weary of any leveraged positions at the moment. Once we establish $350-400 as support...then we break out the leveraged contracts and protect our downsides with hedges. More on that soon!!

Is Ethereum trading in a Descending Channel.Notice a potential Ascending Triangle pattern drawn in blue.
A breakout to the upside of the Descending Channel would mean there is a possible shift from a bearish sentiment to bullish.
This strategy will have you buying the break above the channel.
It’s recommended that buying into this break should occur after multiple tests of the upper channel line. Reason being breakouts early on in the channel often lead to traps as shorts push the price of the stock back down to the lower end of the channel.

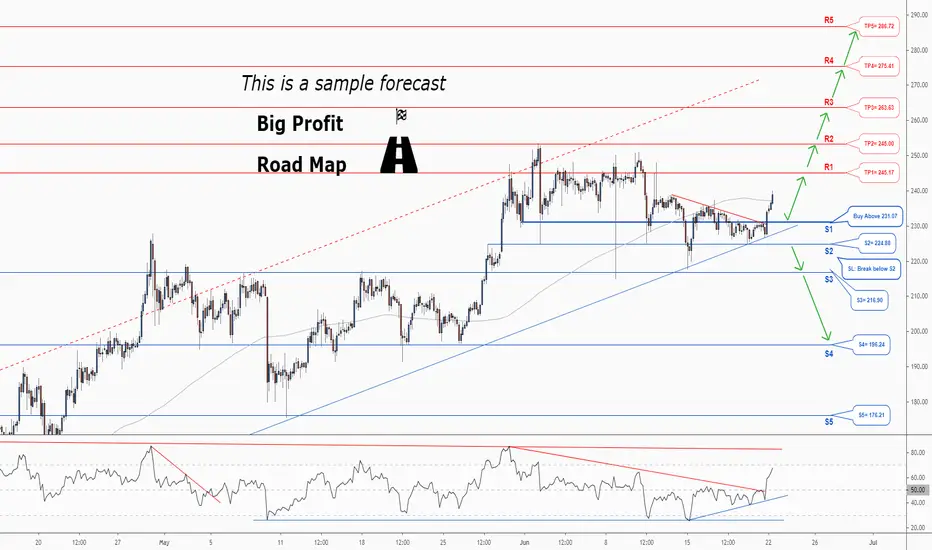
Don't miss the great buy opportunity in ETHUSD Trading suggestion:
. There is a possibility of temporary retracement to suggested support line (231.07). if so, traders can set orders based on Price Action and expect to reach short-term targets.
Technical analysis:
. ETHUSD is in a range bound and the beginning of uptrend is expected.
. The price is above the 21-Day WEMA which acts as a dynamic support.
. The RSI is at 41.
Take Profits:
TP1= @ 245.17
TP2= @ 253.39
TP3= @ 263.63
TP4= @ 275.41
TP5= @ 286.72
SL= Break below S2
❤️ If you find this helpful and want more FREE forecasts in TradingView
. . . . . Please show your support back,
. . . . . . . . Hit the 👍 LIKE button,
. . . . . . . . . . Drop some feedback below in the comment!
❤️ Your Support is very much 🙏 appreciated! ❤️
💎 Want us to help you become a better Forex trader ?
Now, It's your turn !
Be sure to leave a comment let us know how do you see this opportunity and forecast.
Trade well, ❤️
ForecastCity English Support Team ❤️
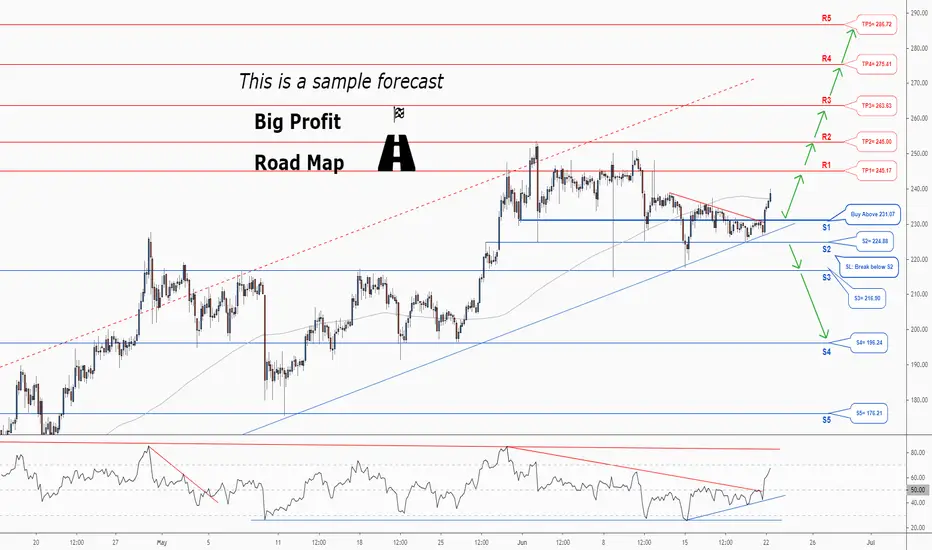
Micro Bull Flag inside of a Macro Ascending Triangle?It appears as though Ethereum is reaching a point of no return, only time will tell.
Bullish flag formations are found in stocks with strong uptrends. They are called bull flags because the pattern resembles a flag on a pole. The pole is the result of a vertical rise in a stock and the flag results from a period of consolidation. The flag can be a horizontal rectangle, but is also often angled down away from the prevailing trend. Another variant is called a bullish pennant, in which the consolidation takes the form of a symmetrical triangle. The shape of the flag is not as important as the underlying psychology behind the pattern. Basically, despite a strong vertical rally, the stock refuses to drop appreciably, as bulls snap up any shares they can get. The breakout from a flag often results in a powerful move higher, measuring the length of the prior flag pole. It is important to note that these patterns work the same in reverse and are known as bear flags and pennants.
An ascending triangle is a chart pattern used in technical analysis. It is created by price moves that allow for a horizontal line to be drawn along the swing highs, and a rising trendline to be drawn along the swing lows. The two lines form a triangle. Traders often watch for breakouts from triangle patterns. The breakout can occur to the upside or downside. Ascending triangles are often called continuation patterns since the price will typically breakout in the same direction as the trend that was in place just prior to the triangle forming.
Notice a divergence on the RSI?

ETH big move - Linear chartBull flag right below long term trend line
Looks good
Using linear instead of log

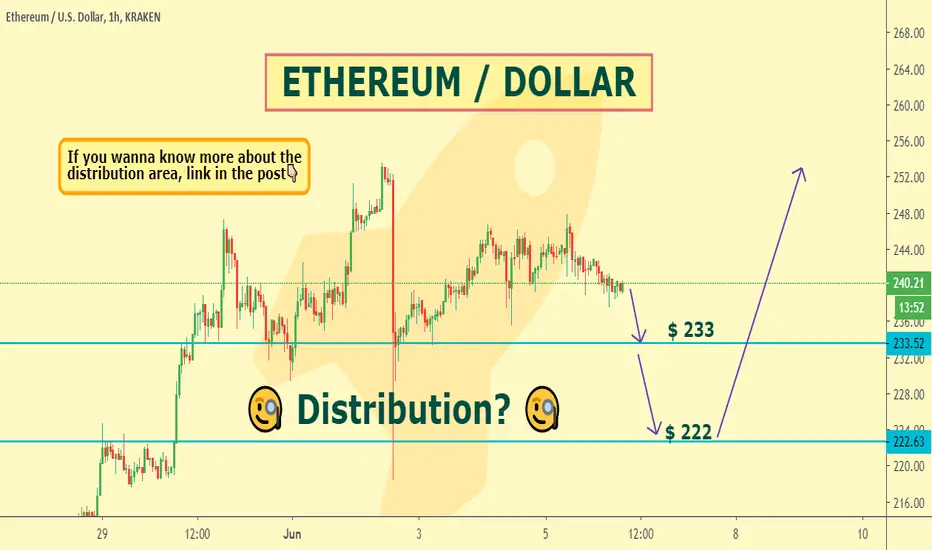
Ethereum🍰Hello, my friends, I wanna share with you the idea of Ethereum.💡 So many asked me to show my vision.🧐
It seems to me, that we're in the distribution zone, is that true? Only time will tell us.⏳
In the meantime, who does not know, what distribution is or has forgotten a little, here’s my training post👇🏻
☝🏻That's the example of Bitcoin's chart, so the price movement is very arbitrary.
Thank you for staying with me.💓
PS. friends, eat a piece of cake for me, today I have Birthday and I'll be very happy if you think of me 🍰
Stay with me💋
Your Rocket Bomb 🚀💣
ETH similaritiesSimilarities to previous take off point
Bored sketch
Labelled in (1)
The bars pattern is of course highly speculative.

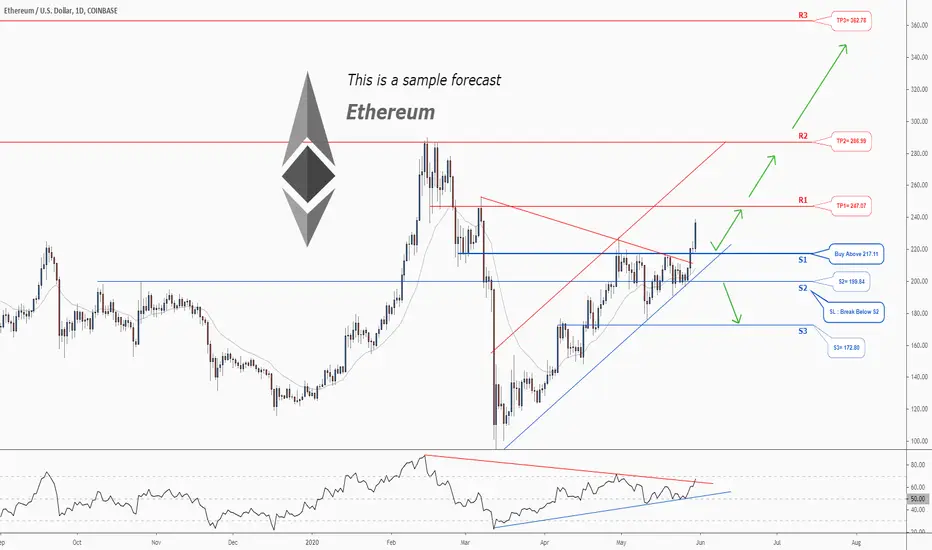
There is a possibility for the beginning of an uptrend in ETHUSDTrading suggestion:
. There is a possibility of temporary retracement to suggested support line (217.11). if so, traders can set orders based on Price Action and expect to reach short-term targets.
Technical analysis:
. ETHUSD is in a range bound and the beginning of uptrend is expected.
.The price is above the 21-Day WEMA which acts as a dynamic support.
. The RSI is at 68.
Take Profits:
TP1= @ 247.07
TP2= @ 286.99
TP3= @ 362.78
SL= Break below S2