Ethereum price potential to $3,000 becomes apparent
Ethereum holds firmly onto support at the 50 SMA on the 4-hour chart.
ETH begins the uptrend afresh, targeting levels above $1,500.
A possible double-top pattern could jeopardize the rally to $3,000 and perhaps lead to more losses.
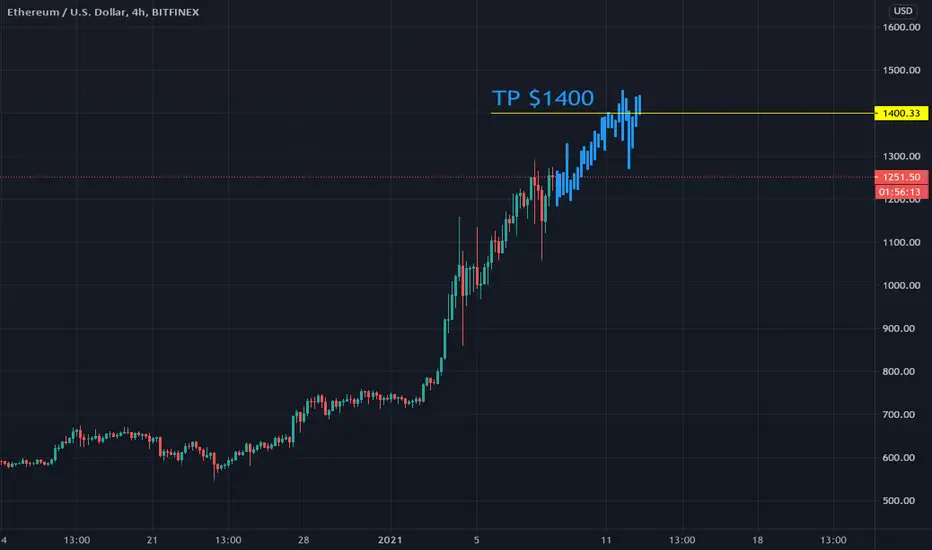
Ethereum has been adamant to follow in Bitcoin’s footsteps over the last couple of weeks. The flagship altcoin executed its own rally even after BTC ran out of steam. The rise to a new all-time high was particularly encouraging to the investors, whose confidence in recovery to levels around $3,000 has increased greatly.
Ethereum seeks higher support before resuming the rally
The recent spike from the support slightly above $1,100 elevated Ethereum to highs around $1,481 (on Coinbase). It was clear that buyers eyed an upswing past $1,500 but Ether lost momentum, leading to a reversal.
The 50 Simple Moving Average on the 4-hour chart has provided support for Ethereum at $1,300. ETH is trading at $1,365 as bulls push for a return to price levels beyond $1,400. The Moving Average Convergence Divergence or MACD suggests that Ethereum is gradually falling back into the hands of the bulls, evidenced by the move into the positive territory.
Trading above $1,400 will add credibility to the expected move past $1,500. Moreover, a move of this magnitude could trigger the fear of missing out (FOMO) as investors rush to take advantage of another rally targeting $3,000. According to the Chief Technology Officer at Bitfinex, Paolo Ardoino:
"The Ethereum price has pierced another all-time high. The potential of ether is becoming more and more apparent as it demonstrates a formidable capacity to support many projects. Ethereum is a key platform for building blockchain projects and is an integral part of launching decentralized applications. With DeFi protocols exceeding $19B in TVL and showing no signs of decelerating, we may see the price of ether grow alongside its use."
Looking at the other side of the fence
It is worth noting that Ethereum may slow down the uptrend if the double-top pattern on the 4-hour chart confirms. This will likely increase the selling pressure in the market, hence delaying the breakout. Moreover, losses may come into play that may retest support at the 50 SMA, 100 SMA, and 200 SMA.
Ethereumdollar

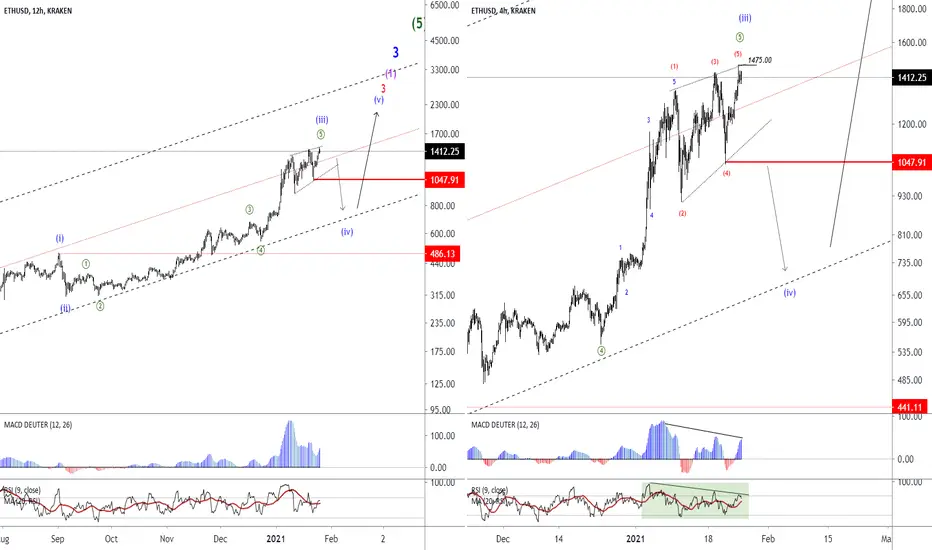
ETH: Diagonal pattern for the target of $ 800 The 12-hour chart indicates, how to count waves, where the wave iii from sub-wave 3 has ended, to get the confirmation the price needs to pass the $ 1047 range. In case this level is crossed, the pattern will be confirmed, and again we can expect the targets of $ 800- $ 900 for this currency.
In the 240-minute chart, the Divergence is also quite evident.
Ethereum on the road to usd2000? Ethereum is still bullish on all timeframes despite the Btc selloff, and has the chance to outperform Bitcoin this year!
Please leave me a message if you want to test the buy and sell indicators that i am using.

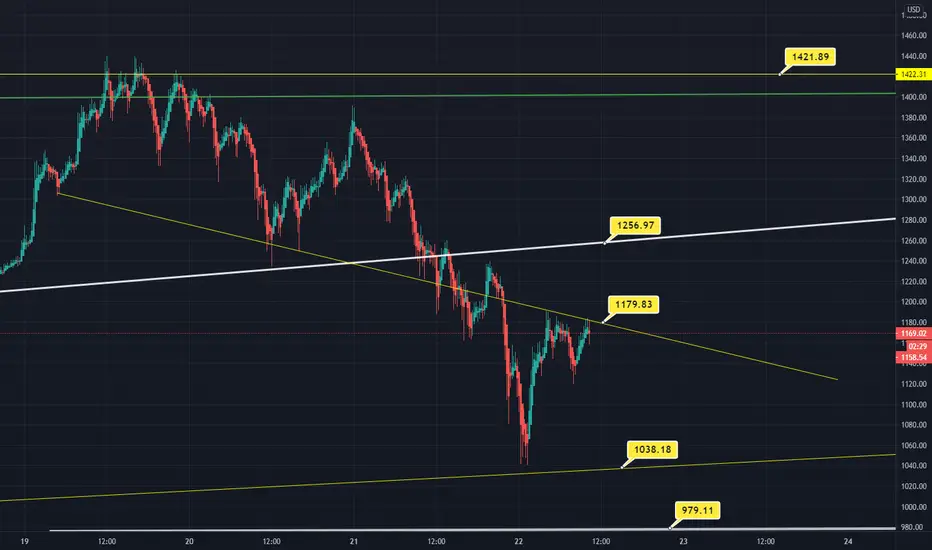
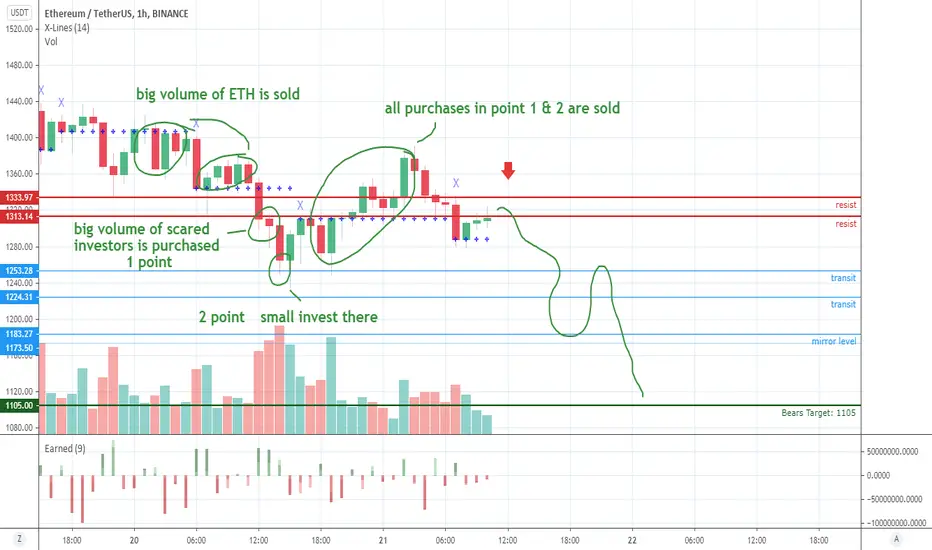
ETHUSDT, short to 1105 in near future.Hi friends. Let's Look at ETHUSDT chart window. I mark all interesting levels and market prices on the chart. Like you can see we have big solds upper and also every purchase from 1250 to 1350 is sold do my opinion its short to strong support level 1105. Levels thanks to X-Lines script.
Follow me.
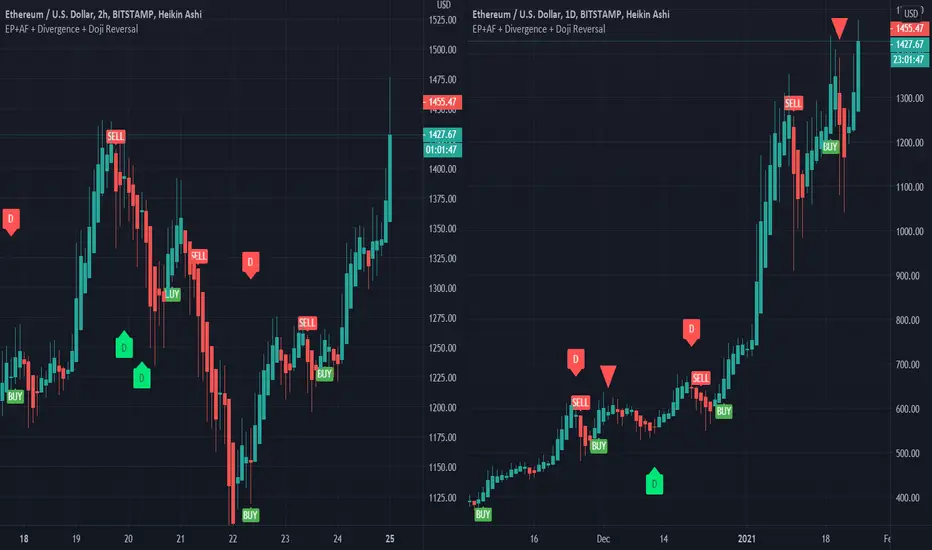
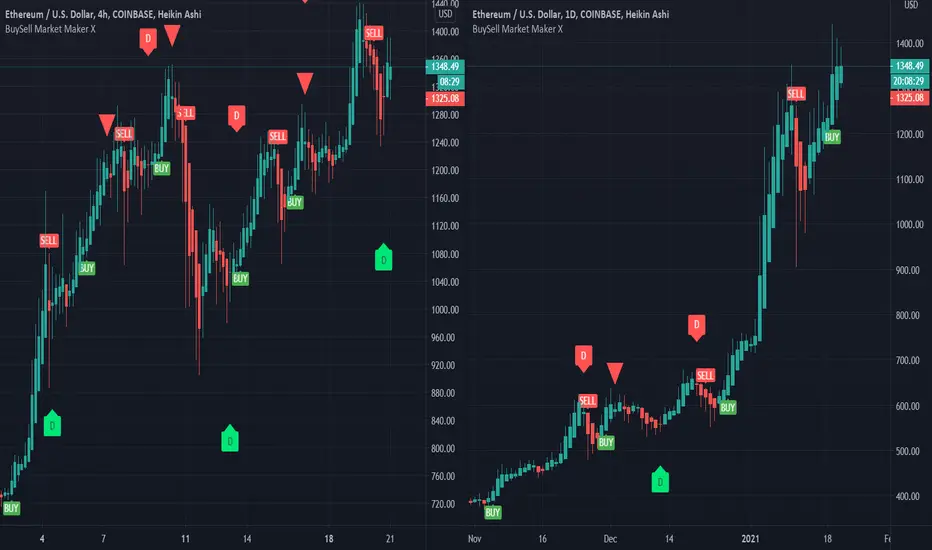
Ethereum 4 hours vs 1 Day timeframeEthereum receives a sell signal on the 4 hours timeframe, but still a buy on the daily.
Please leave me a message if you want to test the buy and sell indicators that i am using.
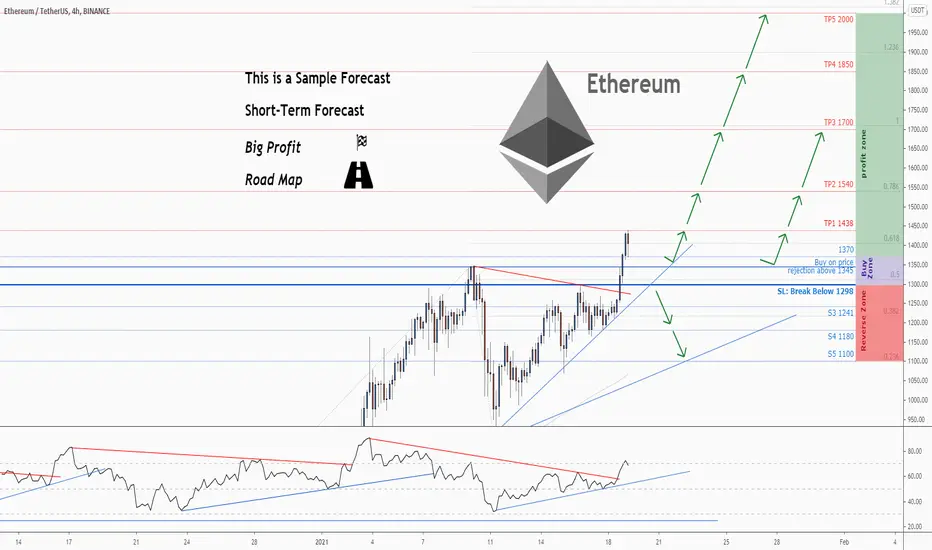
💡Don't miss the great buy opportunity in ETHUSDTTrading suggestion:
". There is a possibility of temporary retracement to suggested support line (1345).
. if so, traders can set orders based on Price Action and expect to reach short-term targets."
Technical analysis:
. Ethereum/TetherUS is in a uptrend and the continuation of uptrend is expected.
. The price is above the 21-Day WEMA which acts as a dynamic support.
. The RSI is at 68.
Take Profits:
TP1= @ 1438
TP2= @ 1540
TP3= @ 1700
TP4= @ 1850
TP5= @ 2000
SL= Break below S2
❤️ If you find this helpful and want more FREE forecasts in TradingView
. . . . . Please show your support back,
. . . . . . . . Hit the 👍 LIKE button,
. . . . . . . . . . Drop some feedback below in the comment!
❤️ Your Support is very much 🙏 appreciated! ❤️
💎 Want us to help you become a better Forex trader ?
Now, It's your turn !
Be sure to leave a comment let us know how you see this opportunity and forecast.
Trade well, ❤️
ForecastCity English Support Team ❤️

💡Don't miss the great buy opportunity in ETHUSDTTrading suggestion:
". There is a possibility of temporary retracement to suggested support line (1345).
. if so, traders can set orders based on Price Action and expect to reach short-term targets."
Technical analysis:
. Ethereum/Tether is in a uptrend and the continuation of uptrend is expected.
. The price is above the 21-Day WEMA which acts as a dynamic support.
. The RSI is at 68.
Take Profits:
TP1= @ 1438
TP2= @ 1540
TP3= @ 1700
TP4= @ 1850
TP5= @ 2000
SL= Break below S2
❤️ If you find this helpful and want more FREE forecasts in TradingView
. . . . . Please show your support back,
. . . . . . . . Hit the 👍 LIKE button,
. . . . . . . . . . Drop some feedback below in the comment!
❤️ Your Support is very much 🙏 appreciated! ❤️
💎 Want us to help you become a better Forex trader ?
Now, It's your turn !
Be sure to leave a comment let us know how you see this opportunity and forecast.
Trade well, ❤️
ForecastCity English Support Team ❤️
ETHEREUM - New ATH before shorting big on February 8th? Why?
Because CME Group to Launch Ether Futures on February 8, 2021
Will share more with you all before time. Maybe find the hint on this previous video about Bitcoin, the city of Chicago, the bears and bulls. (from 0:45 to 4:00 mins you will find the hint, it's loud and clear)

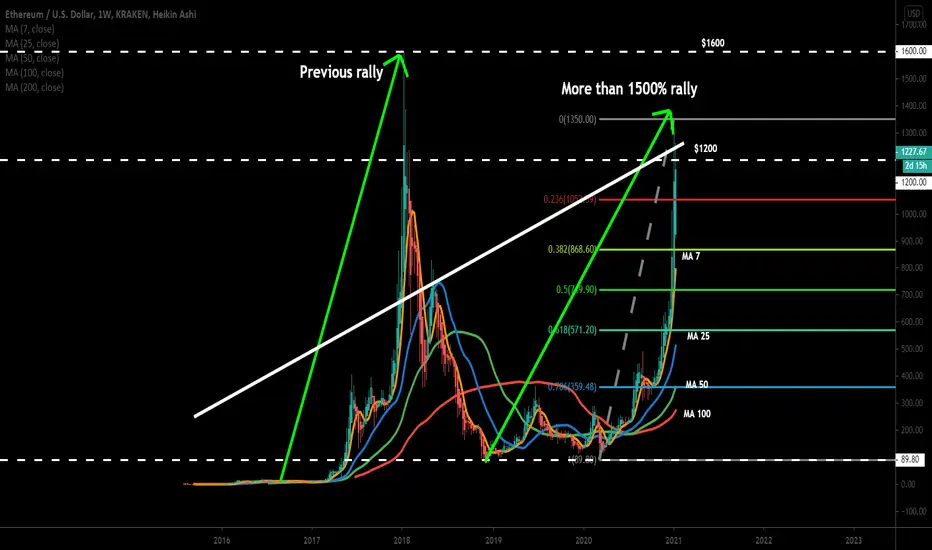
ETH completing another setup to turn more bullish in long termThe importance of SMA 7 and 25:
The previous rally of 2017 ended when on the weekly chart, the simple moving average 7 crossed down the SMA 25. This time sofar the price action is retesting, again and again, the SMA 7 and did not break down it sofar.
Critical resistance and Cup & Handle Formation:
On the long-term weekly chart, the price action is in a critical resistance zone which starts from $1200 and ends at $1600. Here the price action has found the resistance of Cup and Handle pattern at $1200. And retraced almost up to 0.382 Fibonacci level to complete the handle of Cup.
Attempting breakout resistance in the Bitcoin market:
On the Ethereum with Bitcoin pair’s weekly chart, the price action of Ethereum has formed a strong uptrend line support. And now trying to break out the 25 simple moving average resistance.
Conclusion:
If the price action will break out the 25 simple moving average resistance in the Bitcoin market. Then it can turn more bullish against Bitcoin and a very strong bull run can be seen in the US Dollar market as well.
For harmonic trading signals join:
www.patreon.com
ETH entry levels LONG ETH/USDETH is going lower. It looks like a new possibility to enter LONG positions.
ENTRY LEVELS LONG:
$1118
$1066
$996

ETH price TARGET revision + where to GET INEthereum is going down like crazy. Yeah, it was overbought, and yes, the previous rise was massive, but I understand that many buyers just wanted to be IN. So if you bought it higher, and now you need to dilute your position, I can show you some levels to enter into ETH.
Despite this massive fall, we are still bullish, but... It does not mean that we can't go lower. If you are prepared to BUY, save some cash for lover levels.
Here you have levels for LONG positions:
$939
$905
$853
$831
$805

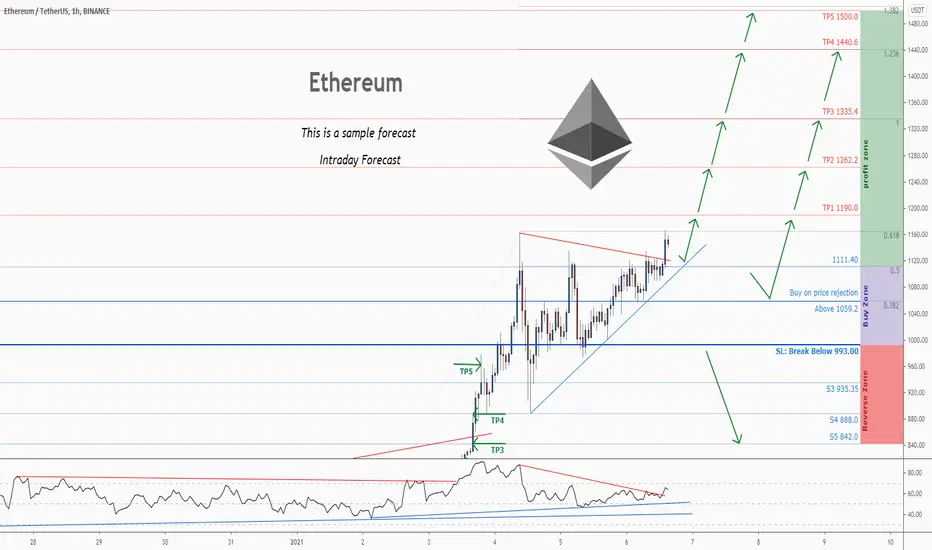
💡 Don't miss the great buy opportunity in Ethereum/TetherUSTrading suggestion:
. There is a possibility of temporary retracement to suggested support line (1059.2). if so, traders can set orders based on Price Action and expect to reach short-term targets.
Technical analysis:
. Ethereum/TetherUS ETHUSDT is in a range bound and the beginning of uptrend is expected.
.The price is above the 21-Day WEMA which acts as a dynamic support.
. The RSI is at 65.
Take Profits:
TP1= @ 1190.0
TP2= @ 1262.2
TP3= @ 1335.4
TP4= @ 1440.6
TP5= @ 1500.0
SL= Break below S2
❤️ If you find this helpful and want more FREE forecasts in TradingView
. . . . . Please show your support back,
. . . . . . . . Hit the 👍 LIKE button,
. . . . . . . . . . . Drop some feedback below in the comment!
❤️ Your Support is very much 🙏 appreciated! ❤️
💎 Want us to help you become a better Forex trader ?
Now, It's your turn !
Be sure to leave a comment let us know how do you see this opportunity and forecast.
Trade well, ❤️
ForecastCity English Support Team ❤️
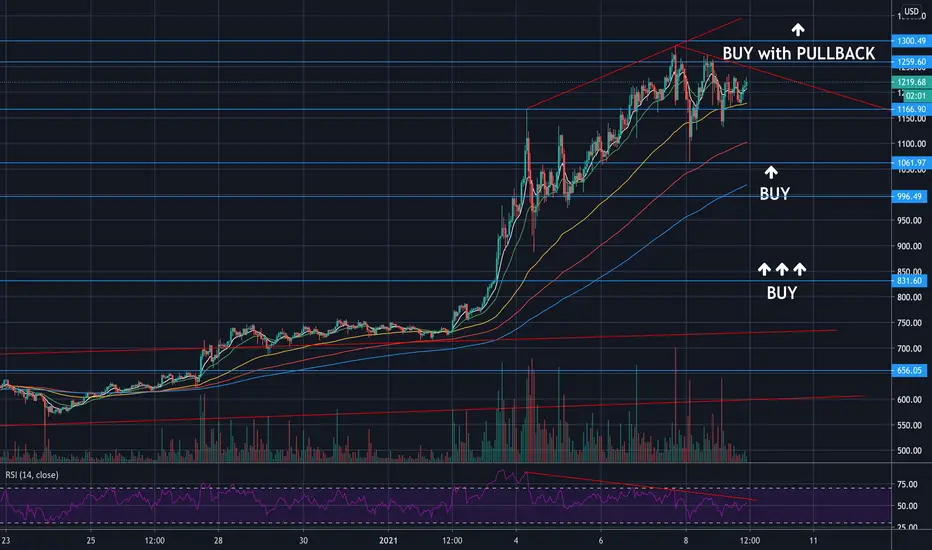
Ethereum - Bearish Divergence on ETH/USDEthereum hit the resistance around $1250 - $1300, and at least for now, this level was rejected. Volumes are higher, and the buyer's appetite seems to be still strong compared to Bitcoin.
But we have a big bearish divergence on the chart according to RSI. I hope we are going a little bit lower, and we can BUY more ETH at a better price.
I closed 2/3 of my ETH position at $1 269. I am keeping a small part just for the case of another bull run.
If we break the market price of $1 300, I will BUY ETH with a pullback.
I am heading to a new entry-level to jump in for another ride to the MOON.
D1 chart candles signal another BULL RUN, but I am aware of RSI bearish divergence that I have mentioned.
Here you have Ethereum entry levels for LONG positions:
$1 166
$1 077
$996
$837
Ethereum on the verge of Parabolic moveBITFINEX:ETHUSD
Ethereum and the rest of the Altcoin market is on the verge of a 2017 like parabolic move. The purple fractal that is overlaid is the 1W BTC/USD chart, and as you can see Ethereum has always mimic'd the moves of big brother bitcoin, so i expect a move similar to the blue fractal on the chart to play out in the coming weeks. This would reflect the recent parabolic move Bitcoin has just about completed, setting up a altseason rally in tandom with the fractal to support my analysis.
In addition, this channel should trade well and shows that PA is at the very bottom near support, putting a test of the channel top at about $2250 in the future.
- PennyBags

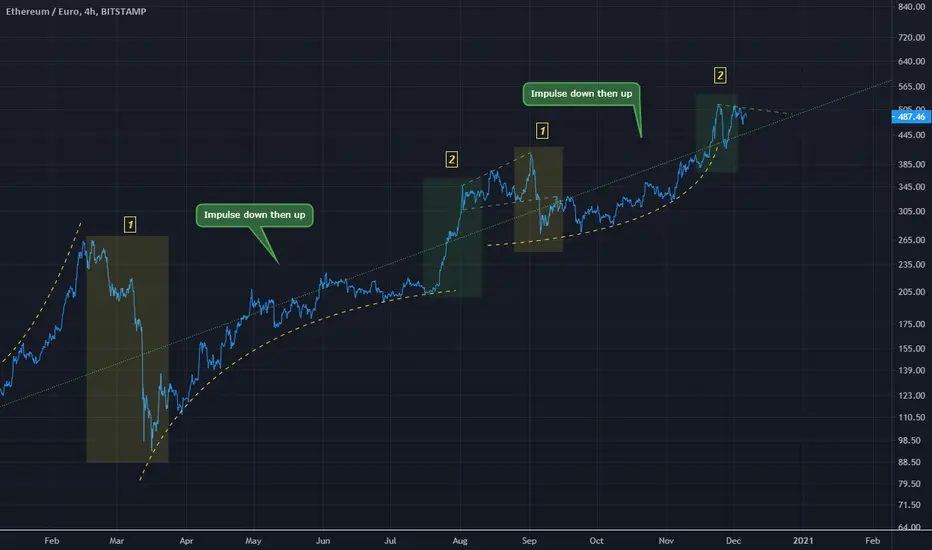
ETHEUR Impulse observation(2) up
(1) down
Pair of scallops.
This is not a forecast just an observation.
Right now I am concerned about the disconnect crypto seems to have from SPX and others.
Everything seems to be bullish in the crypto world (well, mostly)
Its hard to call what this disconnect will lead to.
However im just expressing my thoughts, of course.

At KEY resistance level can it break through this time?*DISCLAIMER: I am not a financial advisor and this is not financial advice as these are purely my opinions and speculations. I may also own or trade any of the symbols and cryptocurrencies mentioned in this video so do not make your trading or investing decisions based on this video. I do not guarantee any results nor am I responsible for your actions. You should always do your own due diligence before trading or investing in this market as it is extremely risky. Affiliate links are also included in this same video description section here and if you decide to support me by using any of them, I may receive a referral bonus or commission.
*Follow me for the latest cryptocurrency analyses on my watchlist
*Thank you to those who donated, I very much appreciate it.
*Let me know in the comment section if you agree or disagree, would love to hear your ideas too.

ETH bullish bounce & next resistance levels to watch for*DISCLAIMER: I am not a financial advisor and this is not financial advice as these are purely my opinions and speculations. I may also own or trade any of the symbols and cryptocurrencies mentioned in this video so do not make your trading or investing decisions based on this video. I do not guarantee any results nor am I responsible for your actions. You should always do your own due diligence before trading or investing in this market as it is extremely risky. Affiliate links are also included in this same video description section here and if you decide to support me by using any of them, I may receive a referral bonus or commission.
*Follow me for the latest cryptocurrency analyses on my watchlist
*Thank you to those who donated, I very much appreciate it.
*Let me know in the comment section if you agree or disagree, would love to hear your ideas too.

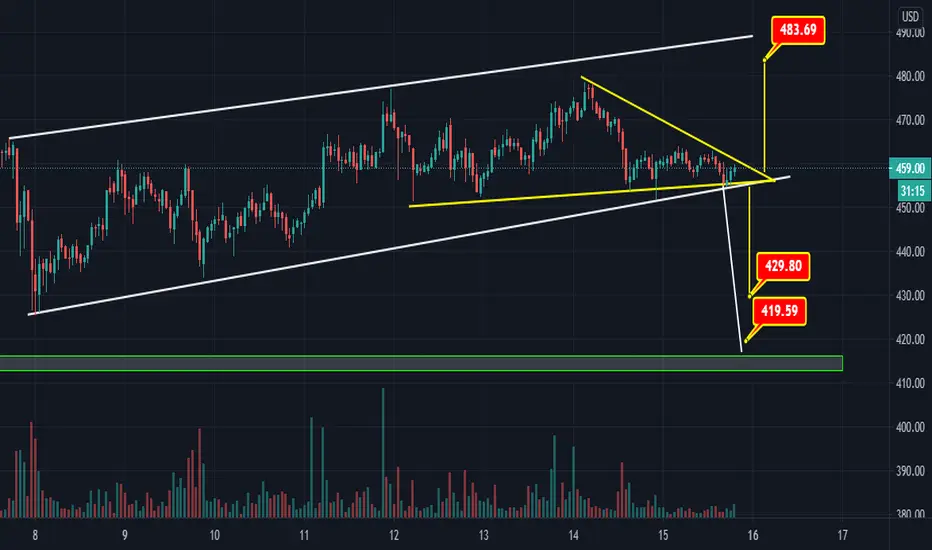
Ethereum Break Out / Break down is very nearEthereum Break Out / Break down is very near if break this triangle than 429, 419 and if break out than 484. Lets wait and watch in both conditions volume should be High. :point_up_2: