Ethereum - The moment of truth!🔬Ethereum ( CRYPTO:ETHUSD ) trades at a key breakout level:
🔎Analysis summary:
Ethereum - after consolidating for the past four years - is once again retesting the previous all time high. And before we will witness another bearish rejection, Ethereum has the chance to finally break out of the long term triangle pattern. It's time for us to start praying.
📝Levels to watch:
$4.000
SwingTraderPhil
SwingTrading.Simplified. | Investing.Simplified. | #LONGTERMVISION
Ethereumlong

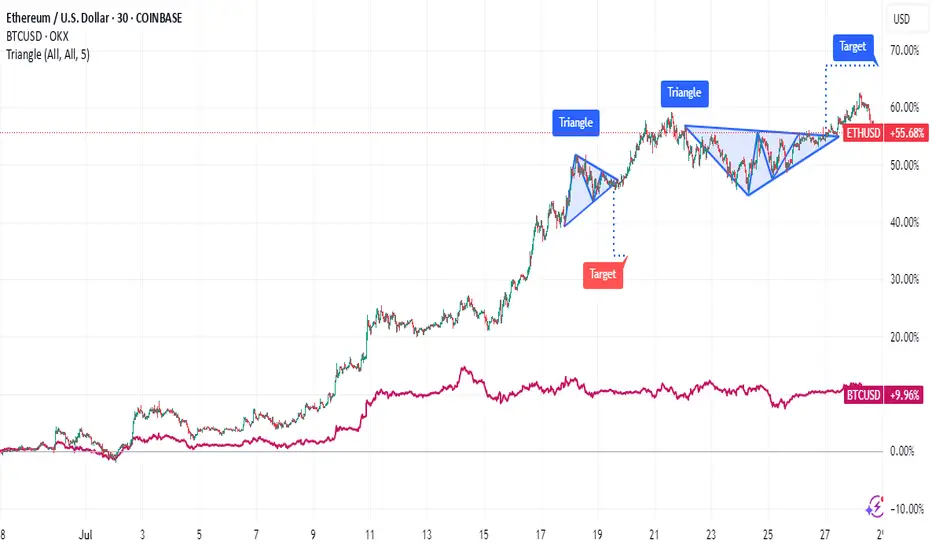
3 Key Catalysts Driving the Next ETH Bull Run
A remarkable confluence of powerful market forces is brewing in the Ethereum ecosystem, fueling increasingly bold outlooks for its future valuation. A potent combination of historical price patterns, dramatic supply dynamics, soaring institutional interest, and resilient price action is painting a picture of a digital asset potentially on the verge of a historic expansion. While a target of $20,000 may seem audacious, a granular look at the underlying mechanics reveals a compelling, multi-faceted argument for a significant upward repricing of Ethereum (ETH).
This deep dive will explore the four key pillars supporting this optimistic outlook: a striking historical price pattern that mirrors Bitcoin’s monumental 2021 surge, a critical supply shock evidenced by a mass exodus of ETH from exchanges, record-breaking institutional engagement in the futures market, and a tenacious price strength holding firm at key technical levels.
Chapter 1: The Bitcoin Fractal: Is History Rhyming?
In financial markets, history rarely repeats itself exactly, but its patterns often rhyme. Market analysts are increasingly pointing to a "fractal"—a recurring geometric pattern in price action—that suggests Ethereum's current market structure is eerily echoing that of Bitcoin's in late 2020, just before its parabolic surge in 2021.
This analysis highlights that Ethereum's chart is displaying a nearly identical pattern of accumulation, re-accumulation, and price compression that Bitcoin exhibited before its own historic breakout. During that period, Bitcoin experienced a multi-fold increase in value, shattering previous records. The parallel suggests that, much like Bitcoin did, Ethereum has emerged from a prolonged consolidation phase and is now pressing against a long-term downtrend resistance line that has defined its market structure for several years.
Should this fractal play out as it did for Bitcoin, a decisive breakout above this critical resistance could trigger a rapid, exponential move upwards. The potential for such a climb is being fueled by a perfect storm of institutional adoption and favorable market shifts.
A critical catalyst underpinning this parallel is the recent launch and explosive growth of spot Ethereum Exchange-Traded Funds (ETFs). The 2021 Bitcoin bull run was significantly propelled by growing institutional legitimacy and new, regulated investment vehicles. Similarly, Ethereum ETFs are now providing a secure and accessible gateway for a fresh wave of institutional capital. These funds have already seen staggering net inflows, with major asset management firms accumulating billions in assets, signaling deep conviction from the titans of traditional finance. This institutional stamp of approval is a powerful parallel to the forces that drove Bitcoin's last major cycle, providing the foundational capital flows needed for a sustained rally.
Chapter 2: The Great Supply Squeeze: A Mass ETH Exodus from Exchanges
One of the most compelling bullish arguments for Ethereum is rooted in fundamental on-chain economics: a dramatic and accelerating supply squeeze. The "Exchange Reserve," a metric that tracks the total amount of ETH held in the wallets of centralized exchanges, has plummeted at an astonishing rate.
In a recent one-month period alone, well over one million ETH were withdrawn from these platforms. This mass exodus of coins is a profoundly bullish indicator. When investors move their assets off exchanges, it typically signals an intention to hold for the long term in self-custodial wallets, rather than keeping them liquid and ready for a quick sale. This behavior drastically reduces the immediately available supply on the open market. Consequently, even a steady level of demand can exert significant upward pressure on the price.
This trend has pushed the total supply of Ethereum on exchanges down to its lowest level in nearly a decade. The drivers behind these massive withdrawals are multifaceted and all point toward a tightening market:
• Long-Term Conviction and Staking: A growing number of investors are locking up their ETH in staking contracts to help secure the network and earn passive yield. Others are simply moving their holdings to secure "cold storage" with a long-term investment horizon, effectively taking them off the market for the foreseeable future.
• DeFi Integration: A significant and growing portion of ETH is used as the primary form of collateral within the sprawling Decentralized Finance (DeFi) ecosystem, where it is locked into smart contracts for lending, borrowing, and other financial applications.
• ETF Accumulation: The newly launched spot ETFs are required to purchase and hold real ETH to back their shares. This direct accumulation removes vast quantities of ETH from the circulating supply that would otherwise be available to retail and institutional buyers.
This fundamental imbalance between a shrinking available supply and growing demand is creating the perfect conditions for a potential "supply shock." The sustained decline in exchange reserves, even as prices have rallied, reinforces the idea that current holders are not rushing to take profits. This indicates a strong belief in future price appreciation and adds a powerful layer of underlying support to Ethereum's macro bullish structure.
Chapter 3: The Wall of Institutional Money: Futures and Open Interest Soar
The derivatives market, often seen as the playground for more sophisticated and institutional investors, is flashing its own set of glaringly bullish signals. Open Interest (OI) in Ethereum futures—representing the total value of all outstanding futures contracts that have not been settled—has surged to unprecedented levels.
On major regulated exchanges favored by institutional investors, Ethereum futures Open Interest has recently shattered all-time highs. This represents a massive and undeniable increase in institutional participation, as asset managers, hedge funds, and other large-scale players use these regulated products to gain exposure to ETH's potential upside and to manage their risk. This is not an isolated phenomenon; across the global landscape of exchanges, the total Open Interest for Ethereum futures has climbed to record-breaking heights.
Rising Open Interest that occurs in tandem with a rising price is a classic technical confirmation of a strong and healthy trend. It demonstrates that new money is actively flowing into the market, with participants expressing confidence in future price appreciation. This influx of capital adds significant fuel to the ongoing rally. The surge in derivatives activity highlights a maturation of the market, where both institutional and retail investors are increasingly using sophisticated financial instruments to speculate on Ethereum's price trajectory.
While the high levels of leverage inherent in futures trading can introduce volatility and the risk of cascading liquidations, the primary signal is one of immense and growing institutional conviction in Ethereum's medium-to-long-term outlook. The influx of capital into both spot ETFs and the futures market creates a powerful, self-reinforcing feedback loop, enhancing liquidity, legitimizing the asset class, and attracting even more conservative capital off the sidelines.
Chapter 4: The Immediate Battleground: Price Action Shows Resilient Strength
Zooming in from the macro-outlook to the short-term technical picture, Ethereum's price action has demonstrated notable resilience, reinforcing the broader bullish thesis. After a strong rally, the price has been consolidating its gains, establishing critical support zones that traders and algorithms are watching with keen interest.
Recent price action shows Ethereum starting a fresh increase above the $3,820 and $3,880 levels. The price is trading near the crucial $3,800 mark and the 100-hourly Simple Moving Average, an indicator that often acts as a dynamic line of support during uptrends. Although there was a brief break below a key bullish trend line that had formed with support at $3,800 on the hourly chart, the ability of the price to remain supported above the broader $3,720 zone is considered vital for a bullish continuation. Should the pair remain supported above this zone in the near term, it could start a fresh increase.
The price has recently faced resistance near the $3,900 and $3,920 levels. The psychological $4,000 barrier remains the next major target. A decisive and sustained break above the $4,000 mark could open the door for a rapid advance, as it would clear the last major resistance area before a potential retest of previous all-time highs.
Technical indicators on higher timeframes remain robust. The price is in a clear long-term uptrend, trading well above its key daily moving averages. While short-term indicators may show temporary overbought conditions or moments of waning momentum, the overall market structure remains decisively bullish as long as critical support levels continue to hold.
Conclusion: A Compelling Case for a New Era of Price Discovery
The prospect of Ethereum reaching a valuation of $20,000 is a monumental forecast, but it is one built on a solid and multi-faceted foundation. The convergence of a compelling historical fractal mirroring Bitcoin's most famous bull run, a verifiable and intensifying supply shock, unprecedented institutional adoption via both spot ETFs and futures markets, and a resilient technical posture creates a powerful case for a sustained bullish continuation.
Each pillar of this argument reinforces the others. Institutional inflows from ETFs directly contribute to the supply squeeze on exchanges. The resulting upward price pressure attracts more speculative interest in the futures market, and the resilient technical picture provides the stable base from which a larger market move can be launched. While no outcome in financial markets is ever guaranteed, and the risks of volatility and sharp corrections remain ever-present, the confluence of these potent factors suggests that Ethereum may not just be knocking on the door of its old all-time high, but preparing to smash through it and enter a new and explosive era of price discovery.

Ethereum Price to Reach $4,000, but Market Top Suggests DelayBINANCE:ETHUSDT current price stands at $3,872, holding above its local support level of $3,742. While ETH is approaching the $4,000 mark , it has not yet managed to breach it. This resistance could continue to hold, limiting Ethereum's immediate potential for further gains.
Currently, 96% of BINANCE:ETHUSDT total supply is in profit. Historically, when the profitable supply surpasses 95%, it signals a market top . This has been followed by price corrections as investors begin to secure profits.
If the market top triggers a reversal, BINANCE:ETHUSDT price could drop to $3,530 or lower . A sharp decline to $3,131 is also a possibility, erasing much of the recent gains made in the past month.
On the other hand, if the influx of new addresses continues and strengthens, BINANCE:ETHUSDT may finally break through the $4,000 resistance. Should this happen, ETH could rise towards $4,425, with a renewed surge in price. This would invalidate the bearish thesis and push Ethereum into a new bullish phase.

Ethereum - Finally new all time highs!🔬Ethereum ( CRYPTO:ETHUSD ) will break out now:
🔎Analysis summary:
For more than four years, Ethereum has overall been moving sideways. However now Ethereum is once again retesting previous all time highs and preparing a bullish breakout. Multiple retests are generally considered bullish so the breakout is very likely to happen any time soon.
📝Levels to watch:
$4.000
🙏🏻#LONGTERMVISION
SwingTraderPhil

Ethereum Price Eyes $5K as Frenzy Fuels Supply ShockEthereum's Ascent: A Perfect Storm of Institutional Frenzy, Dwindling Supply, and Shifting Market Dominance
A palpable sense of anticipation is building in the cryptocurrency market, and its focal point is increasingly not on the reigning king, Bitcoin, but on its heir apparent, Ethereum. A confluence of powerful forces—ranging from bullish proclamations by Wall Street titans and an unprecedented institutional buying spree to compelling on-chain metrics and a shifting market structure—is painting a picture of a potential paradigm shift. The world's second-largest cryptocurrency is not just rallying; it appears to be on the precipice of a significant breakout, with some analysts eyeing targets that would shatter its previous all-time highs. This is not merely a story of price appreciation but a narrative of a "quiet takeover," where Ethereum's fundamental strengths and evolving role in the digital asset economy are finally being recognized by the world's largest financial players.
The chorus of bullish voices has grown louder in recent months, led by influential figures like billionaire investor and Galaxy Digital CEO, Mike Novogratz. A long-time crypto proponent, Novogratz has become increasingly vocal about his conviction that Ethereum is poised to outperform Bitcoin in the near future. He has repeatedly stated that Ethereum has a "really powerful narrative" and that market conditions are aligning for a significant upward move. Novogratz's thesis is built on a simple yet potent economic principle: a demand shock colliding with an already constrained supply. He predicts that Ethereum could outperform Bitcoin in the next three to six months, a bold statement given Bitcoin's own impressive performance.
The catalyst for this potential outperformance, according to Novogratz, is the flood of institutional capital now targeting Ethereum. This isn't just speculative interest; it's a strategic shift by major companies to hold ETH as a treasury reserve asset. This trend, he argues, is creating a supply crunch that will inevitably drive prices higher. The billionaire has identified the $4,000 mark as a critical psychological and technical level. In his view, a decisive break above this price point would launch Ethereum into a phase of "price discovery," where past resistance levels become irrelevant and the asset's value is determined by the sheer force of market demand. Novogratz believes Ethereum is "destined" to repeatedly challenge this $4,000 ceiling, suggesting that a breakout is a matter of when, not if.
This bullish sentiment from one of crypto's most respected voices is not occurring in a vacuum. It is underpinned by a dramatic and sustained price rally that has seen Ethereum's value surge by an astonishing 75% since late June. This powerful uptrend is not fueled by retail FOMO alone; rather, it is the result of a verifiable and accelerating wave of institutional adoption.
The primary engine behind this rally has been the launch and subsequent success of spot Ethereum Exchange-Traded Funds (ETFs). These regulated financial products have opened the floodgates for institutional investors to gain exposure to ETH without the complexities of direct custody. The inflows have been nothing short of staggering. In one remarkable instance on July 25th, Ethereum ETFs registered a net inflow of $452.8 million in a single day, with BlackRock's ETHA fund accounting for the lion's share at $440.1 million. This figure represents a dramatic escalation from the sub-$100 million daily inflows seen in early July, indicating a multifold jump in institutional buying pressure. In a single week, these ETFs absorbed a massive $2.18 billion, showcasing the voracious appetite of big money for a piece of the Ethereum network.
The impact of these ETF inflows is being magnified by a phenomenon known as a "supply shock." Analysts have noted that in a three-week period, ETFs purchased an amount of ETH equivalent to what the network would issue over 18 months. This aggressive absorption of the available supply from the open market, at a time when supply is already constrained due to staking and other factors, creates a powerful upward pressure on price.
The institutional frenzy is not limited to passive ETF investments. A new and significant trend has emerged: the rise of the "Ethereum treasury company." Mirroring the strategy pioneered by MicroStrategy with Bitcoin, corporations are now beginning to add substantial amounts of ETH to their balance sheets, viewing it as a strategic asset and a yield-bearing investment through staking.
Leading this charge is SharpLink Gaming, an online technology company that has made headlines with its aggressive accumulation of Ether. The company recently purchased an additional 77,210 ETH, worth approximately $295 million, in a single transaction. This purchase alone was more than the total net issuance of new Ether over the preceding 30 days. Following this acquisition, SharpLink's total holdings soared to over 438,000 ETH, valued at more than $1.69 billion. This makes SharpLink one of the largest corporate holders of Ethereum, second only to Bitmine Immersion Tech.
SharpLink's strategy is clear and ambitious. The company has filed to increase its stock sale from $1 billion to $6 billion, with the majority of the proceeds earmarked for further ETH purchases. The appointment of Joseph Chalom, a 20-year veteran of the world's largest asset manager, BlackRock, as its new co-CEO, lends further institutional credibility to its crypto-centric strategy. The company has also been vocal about its belief in the Ethereum network, with a recent social media post declaring, "Banks close on weekends. Ethereum runs 24/7." This sentiment captures the essence of why institutions are drawn to the programmable, always-on nature of the Ethereum blockchain.
Other companies, such as BitMine Immersion Technologies and the upcoming Ether Machine, which plans to list on Nasdaq, are also amassing significant ETH treasuries. BitMine has reported holdings of over 566,000 ETH, worth more than $2 billion. Collectively, these corporate players are creating a significant and sustained source of demand, locking up large portions of the circulating supply. This corporate buying spree is a powerful vote of confidence in Ethereum's long-term value proposition, extending far beyond its utility as a digital currency.
The torrent of institutional capital and corporate accumulation is vividly reflected in Ethereum's on-chain data. The network is buzzing with activity, providing a transparent window into the scale of the current buying pressure. One of the most telling metrics has been the explosion in on-chain volume. Over a recent three-week period, on-chain ETH volume surged by an incredible 288%, reaching a staggering $10.38 billion. This indicates a deep and liquid market with robust participation.
Even more compelling is the activity of large holders, colloquially known as "whales." Analysis of blockchain data reveals a sharp increase in the number of "mega whale" addresses—those holding 10,000 ETH or more. Since early July, over 170 new mega whale addresses have appeared on the network. This trend strongly suggests that the massive inflows from ETFs are not just being held by custodians but are being translated into direct, long-term accumulation by large, well-capitalized entities. These are typically "strong hands" that are less likely to sell in response to short-term market fluctuations, providing a stable base of support for the price.
Furthermore, the weekly volume of large transactions, defined as those exceeding $100,000, has hit its highest level since the peak of the 2021 bull run, totaling more than $100 billion in a single week. This explosion in whale activity, coinciding with Ethereum's price breakout into the high $3,000s, confirms that "smart money" is actively and aggressively positioning itself in the market. This is not the speculative froth of a retail-driven rally but the calculated maneuvering of institutional players.
Adding another layer to Ethereum's bullish case is a significant shift in the broader cryptocurrency market landscape: the steady decline of Bitcoin's dominance. Bitcoin dominance, which measures BTC's market capitalization as a percentage of the total crypto market cap, has been trending downwards. This indicates that capital is beginning to flow out of Bitcoin and into alternative cryptocurrencies, or "altcoins," with Ethereum being the primary beneficiary.
This phenomenon, often referred to as a "quiet takeover," signals growing confidence in Ethereum's relative strength. While Bitcoin has already set new all-time highs in the current cycle, Ethereum has yet to surpass its 2021 peak, suggesting it has more room to run. Analysts note that as Bitcoin's momentum has somewhat stalled, investors seeking higher returns are rotating into Ethereum, which offers a compelling combination of a strong narrative, institutional adoption, and significant upside potential.
The outperformance is stark when looking at recent returns. In the last 30 days, while Bitcoin posted respectable gains of around 11%, Ethereum surged by over 61%. This divergence is a classic sign of a market beginning to favor altcoins, a period often dubbed "altcoin season." Ethereum, as the leader of the altcoin pack, typically paves the way for broader rallies across the ecosystem. A rising Ethereum price and declining Bitcoin dominance create a fertile ground for other altcoins to flourish, with some analysts predicting double-digit returns for many smaller projects if Ethereum can successfully break the $4,000 barrier.
From a technical perspective, Ethereum's price chart is flashing multiple bullish signals, suggesting that the recent rally could be the start of a much larger move. Analysts are closely watching several key formations that have been developing over a long period. One of the most significant is a massive consolidation pattern. After a prolonged period of trading within a range, a breakout from such a pattern often leads to a powerful and sustained trend. Some analysts believe a breakout is imminent, with initial price targets set between $4,800 and $5,000.
Even more compelling is the challenge to a 3.7-year descending trendline. This long-term resistance has capped Ethereum's upward movements for years. A decisive weekly close above this trendline would be a major technical victory for the bulls, invalidating the long-term bearish structure and opening the door for a parabolic advance. Technical analysts often view the breach of such a long-standing trendline as a powerful signal of a major trend reversal and the beginning of a new bull market phase.
Should Ethereum successfully break out of its current consolidation and clear the $4,000 to $4,200 resistance zone, chart analysis suggests there is very little historical resistance until the $4,800 to $5,000 range. Some of the more bullish forecasts, looking at the ETH/BTC trading pair and other long-term models, even project potential targets between $7,300 and $10,000 in this market cycle.
Despite the overwhelmingly bullish picture, the path to new all-time highs is unlikely to be a straight line. The $4,000 level has proven to be a formidable barrier. Recently, Ethereum's price was firmly rejected near this psychological milestone, leading to a period of cooling volatility and raising concerns about a potential short-term selloff. The failure to break through has caused some buying pressure to weaken, and on-chain data has shown a temporary decrease in large whale transactions following the rejection.
This price action highlights the classic tug-of-war between buyers and sellers at a key resistance level. Some traders who have enjoyed the 75% run-up may be tempted to take profits, creating selling pressure. The Relative Strength Index (RSI), a momentum indicator, has also shown signs of being "overheated," suggesting that a period of consolidation or a minor correction could be healthy and necessary before the next leg up.
However, a key positive sign is that despite the rejection, buyers have not given up much ground. The price has continued to consolidate just below the resistance area, indicating that dips are being bought and that underlying demand remains strong. This type of price action, where an asset persistently hovers near a major resistance level without a significant pullback, is often a precursor to an eventual breakout.
Crucially, while retail sentiment and short-term trading metrics might show some hesitation, the institutional tide shows no sign of ebbing. Spot ETF inflows have remained consistently positive, providing a steady stream of buying pressure that counteracts short-term selling. This suggests that while there may be some turbulence in the immediate future, the larger, more powerful trend is being driven by long-term institutional accumulators who are less concerned with short-term price swings.
In conclusion, Ethereum finds itself at a historic crossroads, propelled by a perfect storm of fundamental and technical tailwinds. The narrative is no longer just about its technological promise as a world computer but about its emergence as a mature, institutional-grade asset. The vocal support of financial titans like Mike Novogratz, the verifiable flood of institutional capital through ETFs, and the strategic shift by corporations to hold ETH in their treasuries are creating a demand shock of unprecedented scale.
This is being met with a supply that is increasingly constrained, thanks to staking and the aggressive accumulation by these new, large players. On-chain data confirms this story, with volumes and whale activity reaching levels not seen since the last bull market peak. As Bitcoin's dominance wanes, Ethereum is stepping into the spotlight, ready to lead the next phase of the market cycle.
While the $4,000 resistance remains a key hurdle to overcome, and short-term volatility is to be expected, the underlying forces at play suggest a powerful current pulling Ethereum towards new horizons. The "quiet takeover" is becoming louder by the day. A breakout above $4,000 could unleash a wave of price discovery, potentially pushing Ethereum to $5,000 and beyond, and in the process, reshaping the very landscape of the digital asset ecosystem. The stage is set for Ethereum's ascent, and the world is watching.
Ethereum’s $4,000 Target Alive as Historic Rally Signs EmergeBINANCE:ETHUSDT is currently trading at $3,680, just 9% away from the critical $4,000 resistance that many investors have been waiting for over the past seven months. The altcoin is expected to continue its upward momentum despite the recent consolidation, with the potential to breach the $4,000 mark soon.
Looking at broader technical indicators, the NUPL (Net Unrealized Profit/Loss) suggests that BINANCE:ETHUSDT is poised for a significant rally . The NUPL indicator, when reaching a threshold of 0.5, traditionally signals a pause in the uptrend, followed by a sharp rally.
$ BINANCE:ETHUSDT is currently nearing this threshold , which, in the past, has marked the beginning of powerful upward price action.
As long as BINANCE:ETHUSDT remains above its key support levels, the price is likely to surge toward $4,000 . If Ethereum can maintain its momentum, a breach of $4,000 could act as a catalyst for further gains.
However, should unforeseen selling pressure arise, $BINANCE:ETHUSDTprice could slip below the $3,530 support level. In such a scenario, Ethereum may fall to $3,131, invalidating the current bullish outlook. The key will be maintaining support and capitalizing on the retail-driven surge.

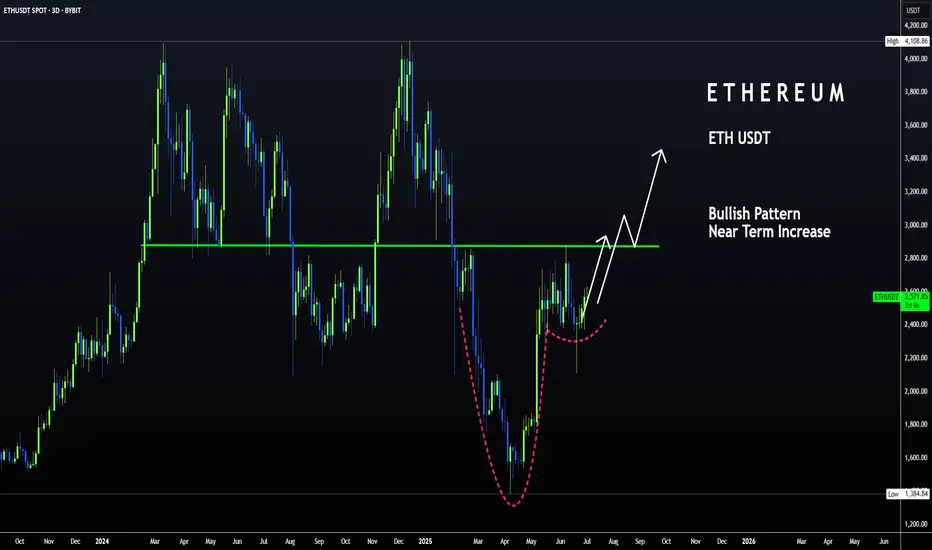
ETH | Bullish Pattern - Cup and Handle +15%A Bullish pattern is appearing on the Ethereum chart.
From a Cup and Handle pattern, we can easily expect atleast a 15% increase. This is true for the near term. A +15% would put us here:
Just under $3K we may see heavy resistance. This is also the neckline resistance, as it was the previous support for the breakout that ultimately led to a new ETH ATH.
_______________________________
BYBIT:ETHUSDT
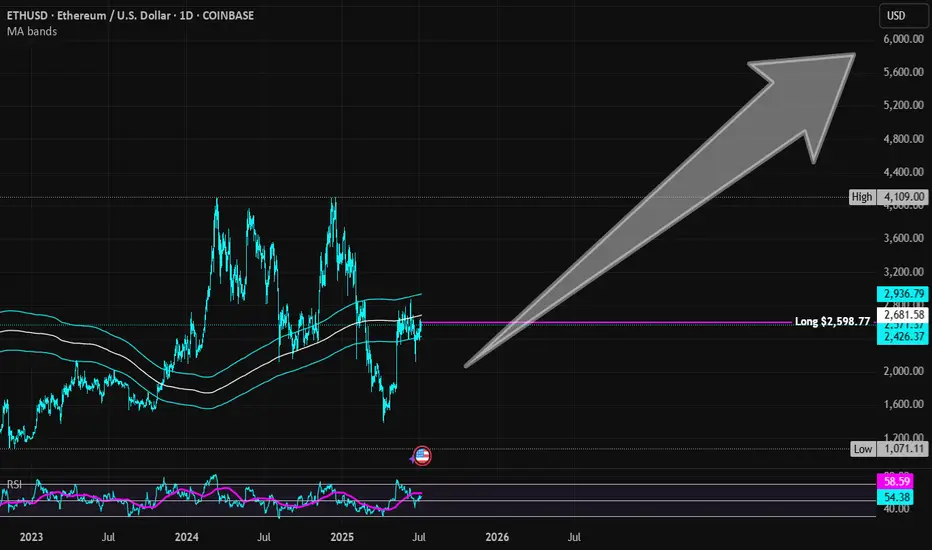
Ethereum | ETH | Long at $2,598.77Currently within my historical simple moving average area and consolidating. I suspect a move up is imminent, but 100% speculation. Crypto "bros" know more than I do.
Targets into 2028:
$4,000 (+53.9%)
$5,500 (+111.6%)
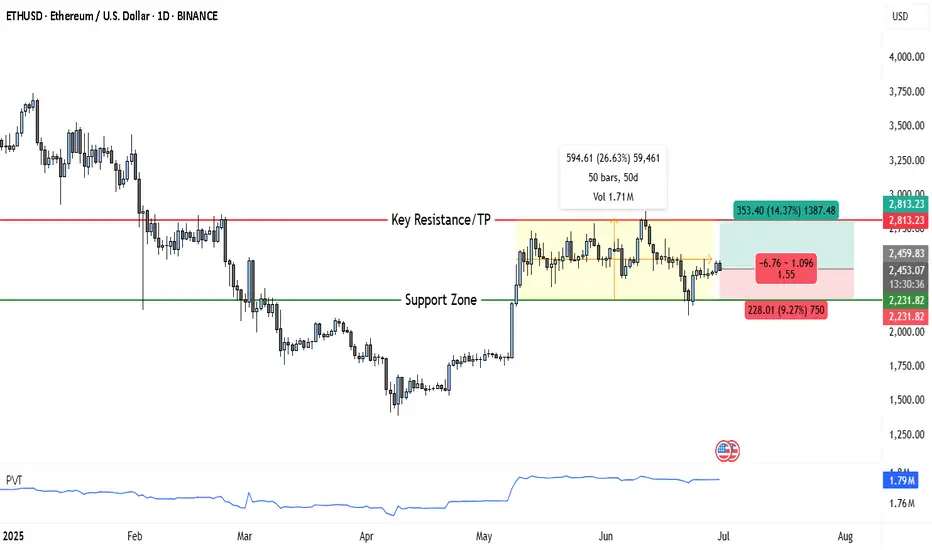
ETH Ready for Lift-Off: Traders Eye +14% Surge Toward $2,813Ethereum has been consolidating in a large sideways range after recovering from a steep decline earlier this year. The chart clearly shows a defined support zone and key resistance area, with price currently trading just above mid-range and attempting to reclaim bullish momentum.
Chart Structure Highlights
• Support Zone: Around $2,231 – $2,232, which has been tested multiple times and held firmly, confirming strong demand here.
• Key Resistance / Take Profit Area: Near $2,813, a major level where price was repeatedly rejected in the past.
• Consolidation Box: A ~50-day range between support and resistance, suggesting accumulation.
• Recent Price Action: ETH is attempting to break out of the upper side of this consolidation, with buyers gradually stepping in.
Trade Setup
✅ Entry Zone: $2,450–$2,460
ETH is currently near this area, which represents a conservative breakout attempt from the range. Traders may look for confirmation candles closing above $2,460 for added conviction.
✅ Stop Loss: $2,231
Placed just below the lower edge of the support zone to protect against a failed breakout and renewed selling.
✅ Take Profit Target: $2,813
This is the key resistance level marked on the chart, offering approximately +14% upside from the entry.
Reward-to-Risk Profile
• Potential Reward: ~$353 (+14.3%)
• Potential Risk: ~$228 (-9.2%)
• Reward:Risk Ratio: ~1.55:1
Summary of the Setup
Ethereum has spent nearly 50 days consolidating between $2,230 and $2,813, and is now threatening a breakout to the upside. This creates a favorable swing trade scenario with a clear invalidation level below the strong support zone. A sustained move above the consolidation could target the $2,813 resistance in the coming weeks.
Ethereum’s 19-Day ETF Inflow Streak: What Really HappenedEthereum’s 19-Day ETF Inflow Streak: What Really Happened to Price, Structure, and Sentiment
Table of Contents
1. Executive Summary
2. ETF Backdrop: How the 19-Day Inflow Wave Took Shape
3. Chronology of Price: Day-by-Day Performance
4. Weekly Chart Anatomy: The “Pre-Tower Top” Signal Explained
5. Intraday Technicals: From $2,450 Low to the $2,620 Hurdle
6. On-Chain & Derivatives Lens: Funding, OI, CEX Balances
7. Fundamental Undercurrents: Dencun Afterglow, L2 Fees, Staking Yields
8. Risks & Catalysts: ETH vs. Macro, vs. BTC Dominance, vs. SEC Noise
9. Playbooks for Traders and Long-Term Allocators
10. Conclusion: A Pause, Not a Peak—If Key Levels Hold
________________________________________
1. Executive Summary
• Ethereum received 19 consecutive days of net inflows into spot-linked exchange-traded products (ETPs) totaling $1.37 billion, the longest positive streak since the 2021 bull-run.
• Over the same period ETH/USD rose 18.4 %, printing a local high at $2,750, but has since pulled back to $2,575 amid broad crypto risk-off and Middle-East tensions.
• The latest weekly candle morphs into a “pre-tower top” pattern—two tall green candles followed by a small-bodied doji—often a harbinger of heavy distribution if confirmed by another red week.
• Short-term structure improved Monday: price pierced a contracting-triangle ceiling at $2,550, reclaimed the 100-hour SMA, and now eyes $2,620 as the gatekeeper to renewed upside.
• Funding rates flipped neutral, exchange reserves hit a 7-year low, and staking deposits outpace withdrawals 1.7 : 1—on-chain signs that the sell-off is more leverage shakeout than top formation.
________________________________________
2. ETF Backdrop: How the 19-Day Inflow Wave Took Shape
2.1. The Players
Unlike Bitcoin’s mammoth U.S. spot ETFs, Ethereum’s inflow streak drew from Europe and Canada, where physically backed ETPs have traded since 2021. The three biggest contributors:
Product Country 19-Day Net Flow AUM Growth
21Shares Ethereum ETP (AETH) Switzerland +$502 m +38 %
CI Galaxy Ethereum ETF (ETHX) Canada +$458 m +29 %
WisdomTree Physical Ethereum EU +$227 m +24 %
Rumors of an SEC approval window “after the U.S. election” sparked pre-positioning; asset managers figured it was cheaper to accumulate now than chase later once liquidity explodes on Wall Street.
2.2. Flow Mechanics
When an ETP issues new shares, it must buy spot ETH or tap an AP that can supply coins—direct demand unmatched by equivalent selling pressure. Over the 19-day window, the net 396 k ETH of creation equaled 57 % of all new issuance from block rewards post-Dencun, creating a measurable supply squeeze.
2.3. Historical Context
The only longer stretch was January–February 2021 (27 days), which culminated in ETH exploding from $1,400 to $2,000. The key difference today: market cap is six times larger, so identical inflows exert a milder percentage impact, explaining why price “only” added ~18 %.
________________________________________
3. Chronology of Price: Day-by-Day Performance
Day Date ETF Net Flow Price Close % Δ vs. Prior Day
1 Mar 18 +$58 m $2,110 —
5 Mar 22 +$73 m $2,265 +7.3 %
10 Mar 27 +$94 m $2,430 +2.4 %
15 Apr 1 +$125 m $2,690 +3.8 %
19 Apr 5 +$81 m $2,750 +0.9 %
Across the stretch, realized volatility rose from 32 % to 46 %, but skew stayed positive, showing call demand outpaced puts until the very end, when geopolitical headlines flipped sentiment.
________________________________________
4. Weekly Chart Anatomy: The “Pre-Tower Top” Signal Explained
4.1. What Is a Tower Top?
In candlestick lore, a tower top comprises:
1. A tall green candle (strong breakout)
2. Another tall green candle (exhaustion)
3. A narrow doji or spinning top (equilibrium)
4. A large red candle (breakdown confirmation)
We currently have the first three pieces: the last two weeks of March delivered back-to-back 10 % advances; the first week of April closed as a +0.6 % doji. The pattern is not confirmed until a decisive red week engulfs the doji body (< $2,540).
4.2. Indicators
• RSI (weekly): 59 → ticking down from 68 high; still shy of overbought.
• MACD histogram: Positive but flattening.
• Bollinger bands: Price mid-point of upper band, room for one more expansion.
Conclusion: the candle warns of fatigue, but momentum hasn’t rolled over—yet.
________________________________________
5. Intraday Technicals: From $2,450 Low to the $2,620 Hurdle
5.1. Hourly Chart (Kraken Feed)
• Triangle Breakout: Price sliced through descending trend-line at $2,550, tagging $2,590.
• Moving Averages: ETH trades marginally above the 100-hour SMA ($2,575) but below the 200-hour ($2,610).
• Fibonacci Zones: $2,620 aligns with 0.5 retrace of the $2,750→$2,450 fall—classic reversal pivot.
A clean hourly close >$2,620 opens the door to $2,680 (0.618 Fib) and psychological $2,700. Failure rejects to $2,520 support cluster.
5.2. Order-Book Heat Map
Coinbase Pro data shows 1,300 ETH ask wall at $2,620 and a thinner 890 ETH bid at $2,520. Liquidity skew favors dip-buying, but bulls need market orders >1 k ETH to smash the ask block.
________________________________________
6. On-Chain & Derivatives Lens
6.1. Exchange Reserves
Centralized exchanges now hold 12.9 million ETH, lowest since July 2017. The 19-day ETF harvest accelerated an already extant down-trend of roughly 60 k ETH/week outflows, mostly into staking contracts and L2 bridges.
6.2. Staking Flows
• Beacon deposit contract: +188 k in April’s first week.
• Withdrawal queue: 11 k ETH—tiny relative to deposits.
• Effective deposit APR after Dencun: 3.2 %, still beating U.S. 2-year T-notes post-tax for many investors.
6.3. Perpetual Funding & OI
• Funding normalized to 0.007 %/8 h (≈ 3.2 % APR), down from 9 % at March highs—spec longs flushed.
• Open Interest shed $420 m in the two-day dip—liquidations, not fresh shorts, drove the wash-out.
6.4. Options Skew
• 25-delta risk reversal (1-month): flipped to –4 % (puts pricier than calls) for first time since January—hedging demand but nowhere near panic-level (–12 % in 2022 bear).
________________________________________
7. Fundamental Undercurrents
7.1. Dencun Afterglow & L2 Fees
Proto-danksharding (EIP-4844) slashed L2 data costs by 85 %, pushing average Arbitrum and Optimism transaction fees under $0.02. Cheaper blockspace fuels on-chain activity:
Metric Pre-Dencun Post-Dencun Δ
Daily L2 Txns 2.4 m 4.1 m +71 %
Bridged ETH to L2s 6.8 m 7.9 m +16 %
More usage → more gas burned → structural tailwind to ETH as a fee-burn asset.
7.2. DeFi TVL
Total value locked rebounded to $61 billion, led by EigenLayer and restaking hype. ETH comprises 68 % of TVL collateral—every lending loop pins additional demand.
7.3. Competing Narratives
• Solana season siphoned retail mind-share; SOL/ETH ratio popped 42 % YTD.
• Bitcoin L2s (Stacks, Rootstock) attempt to mirror Ethereum’s smart-contract moat, but dev tooling remains nascent.
•
Net: Ethereum retains developer supremacy (70 % of new GitHub commits among smart-contract chains) and therefore garners institutional comfort.
________________________________________
8. Risks & Catalysts
Factor Bearish Angle Bullish Rebuttal
Macro Sticky U.S. CPI halts Fed cuts → higher real yields weigh on non-yielders ETH staking yield + MEV is real cash-flow; Dencun lowers L2 costs → adoption offset
SEC Spot ETF Delay past Jan 2026 or outright denial kills U.S. inflow dream 19-day streak proves ex-U.S. capital is hungry; approval >0 is all it takes for supply shock
BTC Dominance Halving FOMO may keep Bitcoin’s share >55 %, starve ETH rotation Historical pattern: ETH rips 6-10 weeks post-halving as beta plays catch-up
Tower-Top Pattern Weekly confirmation could spark drop to $2,200 support Pattern fails if bulls recapture $2,750 quickly, turning doji into bullish flag
________________________________________
9. Playbooks for Traders and Long-Term Allocators
9.1. Short-Term Momentum (0–7 days)
• Bias: Range-trade $2,520–$2,620 until breakout.
• Instruments: ETH-perp on Bybit/Deribit, 3× leveraged tokens for reduced funding bleed.
• Trigger: 15-minute candle above $2,620 with ≥ $50 m aggregated CVD buys.
• Stop: $2,560 (triangle retest).
• Target: $2,680 then $2,700.
9.2. Swing (1–8 weeks)
• Bias: Accumulate dips as long as weekly stays >$2,350 (0.382 Fib of Oct→Mar leg).
• Tools: 1-month $2,500-$2,800 call spreads; spot with 25 % collar protection.
• Catalysts: SEC commentary May 23, FOMC June 18.
9.3. Position (6–18 months)
• Bias: Dollar-cost average into staking nodes; carry 4 % ETH on portfolio NAV.
• Thesis: EIP-4844 usage boom + probable U.S. ETF = $4–5 k fair value by 2026.
• Risk Control: Hedge 25 % notional via BTC-perp short if BTC.D >58 %.
________________________________________
10. Conclusion: A Pause, Not a Peak—If Key Levels Hold
The 19-day ETF inflow streak proves that institutional demand for Ethereum exists even without a U.S. spot vehicle. Price responded vigorously but not parabolically, reflecting the asset’s growing market-cap gravity. The nascent “pre-tower-top” weekly candle warns of exhaustion; confirmation, however, requires another bearish week that cracks $2,540 support.
Short-term order-flow shows willing dip buyers, staking metrics scream supply sink, and the macro backdrop—while shaky—fails to dent ETH’s relative value proposition versus fiat yields. Translation: Ethereum is vulnerable to headline-driven squalls but structurally sound.
If bulls recapture $2,620, the path to retest $2,750 and ultimately $3,000 reopens. Lose $2,450 and the tower top will complete, sending ETH toward $2,200 where ETF inflow buyers likely reload. For now, the balance of evidence favors consolidation with an upward skew—tower construction, perhaps, but no wrecking ball yet.
ETH Price Prediction June: Don't Ignore Ethereum's Path to $3KEthereum, the second-largest cryptocurrency by market capitalization, is once again commanding significant attention across the digital asset landscape. As the broader market navigates periods of uncertainty and consolidation, Ethereum appears to be carving out a distinct path, demonstrating remarkable resilience and attracting substantial capital inflows. A confluence of factors, including a new all-time high in a critical on-chain metric, robust institutional interest, and a building technical momentum, suggests that ignoring Ethereum at this juncture would be a misstep for any serious investor. The current market dynamics are painting a compelling picture for Ether's trajectory, particularly as June unfolds, with analysts eyeing significant price levels.
The Unignorable Signal: A New All-Time High in a Major Metric
The digital asset space is often characterized by its volatility and rapid shifts in sentiment. Yet, beneath the surface of daily price fluctuations, fundamental indicators often provide the most profound insights into the health and growth of a blockchain network. For Ethereum, a recent development has sent a clear signal that cannot be overlooked: a major network metric has reached an unprecedented all-time high. While the specific metric can vary, such milestones typically point to an underlying surge in network utility, user adoption, or developer activity.
Consider, for instance, metrics like the total value locked (TVL) in decentralized finance (DeFi) protocols built on Ethereum, the number of active addresses engaging with the network, or the aggregate gas consumption, which reflects overall network demand. A new peak in any of these areas signifies a robust and expanding ecosystem. If the all-time high is in TVL, it suggests that more capital is flowing into and being utilized within Ethereum’s DeFi applications, indicating growing trust and utility in its financial primitives. An increase in active addresses points to a wider user base interacting with the network for various purposes, from transacting to engaging with decentralized applications (dApps). Similarly, sustained high gas consumption, even if it leads to higher transaction fees, underscores the immense demand for block space on the Ethereum blockchain, a testament to its indispensable role in the decentralized internet.
This surge in a key metric is not merely a statistical anomaly; it represents a fundamental validation of Ethereum's long-term vision and its ongoing evolution. It suggests that despite market corrections or periods of sideways trading, the underlying utility and adoption of the Ethereum network continue to grow unabated. This organic growth, driven by real-world use cases and an ever-expanding developer community, forms a strong bedrock for future price appreciation. Pundits are right to highlight this signal, as it separates Ethereum from purely speculative assets and firmly places it in the category of a foundational technology with increasing real-world relevance. It implies that the network's value proposition is strengthening, attracting more users, developers, and capital, thereby reinforcing its position as the leading smart contract platform.
Institutional Endorsement: $296 Million Inflows and a Historical Week
Perhaps one of the most compelling narratives surrounding Ethereum's current strength is the undeniable surge in institutional interest. In a market environment often described as a "slowdown," Ether investment products witnessed an astonishing $296 million in inflows last week. This figure is not just significant in absolute terms; it marks the best week for Ether crypto funds since the election of former US President Donald Trump, a period that dates back several years and encompasses numerous market cycles
.
This monumental inflow of capital from institutional players is a powerful vote of confidence in Ethereum. It signifies that large-scale investors, including hedge funds, asset managers, and family offices, are increasingly allocating significant portions of their portfolios to Ether. Such inflows are particularly noteworthy during a "market slowdown," as they suggest a strategic long-term positioning rather than speculative short-term trading. While retail investors might be more susceptible to market sentiment swings, institutional investors typically conduct extensive due diligence and operate with a longer investment horizon. Their willingness to deploy hundreds of millions of dollars into Ether products indicates a conviction that Ethereum represents a valuable asset with substantial growth potential, capable of delivering strong returns over time.
The context of these inflows is also crucial. Investors are currently awaiting clarity from the US Federal Reserve's June rate decision, a macroeconomic event that often casts a shadow of uncertainty over risk assets. Despite this prevailing caution, institutional money continued to flow into Ethereum, underscoring a belief in its intrinsic value and its ability to perform independently of, or even as a hedge against, traditional market volatility. This behavior suggests that institutions view Ethereum not just as a speculative digital currency, but as a critical piece of the emerging digital economy, akin to a technology stock with immense disruptive potential. The steady accumulation by these sophisticated players provides a strong floor for Ether's price and signals a maturation of the asset class, moving beyond the fringes into mainstream financial portfolios. This institutional embrace is a critical catalyst, providing liquidity, stability, and legitimacy to the Ethereum ecosystem.
Consolidation and Momentum: Setting the Stage for June's Price Action
From a technical analysis perspective, Ethereum's price action has recently been characterized by a period of consolidation. Consolidation, in market terms, refers to a phase where an asset's price trades within a relatively narrow range, often after a significant price movement. This period is typically seen as a time for the market to digest previous gains or losses, allowing for accumulation or distribution before the next major move. For Ethereum, this consolidation is occurring while momentum is visibly building.
The concept of "momentum building" implies that underlying buying pressure is gradually increasing, even if the price isn't making dramatic upward moves on a daily basis. This can manifest through higher lows, decreasing selling pressure at key support levels, and a gradual increase in trading volume during upward movements. This type of price action is often considered healthy, as it allows the market to establish a strong base from which to launch its next leg up. Rather than a parabolic and unsustainable surge, a period of consolidation followed by building momentum suggests a more organic and sustainable growth trajectory. It allows early investors to take profits, new investors to enter, and the market to find a new equilibrium before breaking out.
Ethereum June Price Prediction: Key Levels to Watch
Given the current market dynamics, including the new all-time high in a major metric, the significant institutional inflows, and the building technical momentum, analysts are increasingly bullish on Ethereum's prospects for June. A prominent analyst has explicitly stated that a target of $3,000 is "in sight" for the month. This specific price target is not arbitrary; it likely stems from a combination of technical indicators, such as Fibonacci extensions, previous resistance levels, and psychological price points, combined with the strong fundamental and institutional tailwinds.
To reach and sustain the $3,000 level, Ethereum will need to navigate several key price points. Currently, the immediate resistance levels might be found around recent local highs, perhaps in the range of $2,500 to $2,700. Breaking through these levels with conviction, ideally on increased volume, would confirm the building momentum and pave the way for further upward movement. The psychological barrier of $3,000 itself is significant; once breached, it can often act as a new support level, attracting further buying interest and reinforcing bullish sentiment.
On the downside, key support levels would be crucial to watch. These might lie around the lower bounds of the recent consolidation range, potentially in the $2,200 to $2,300 area. A strong bounce from these levels, should the price retest them, would confirm the underlying strength and the presence of buyers willing to defend these price points. A more significant support could be found around the $2,000 mark, a major psychological and technical level that has historically proven to be a strong area of interest. Maintaining above these critical support zones would be essential to keep the bullish narrative intact and to validate the analyst's $3,000 target.
Factors that could influence this trajectory include the aforementioned US Fed rate decision, which could either provide clarity and boost risk appetite or introduce further caution. Additionally, ongoing developments within the Ethereum ecosystem, such as progress on scalability solutions (Layer 2 networks) and the continued growth of its dApp ecosystem, will play a role. Any major news regarding regulatory clarity or institutional product launches could also act as significant catalysts. However, the current confluence of strong on-chain fundamentals and institutional demand provides a robust foundation for the projected price appreciation.
Ethereum's Enduring Significance and Future Outlook
Beyond the immediate price predictions and market movements, it is crucial to remember Ethereum's enduring significance in the broader cryptocurrency and blockchain landscape. Ethereum is not merely a digital currency; it is the foundational layer for the vast majority of decentralized applications, non-fungible tokens (NFTs), and the burgeoning decentralized finance (DeFi) sector. Its smart contract capabilities have enabled an explosion of innovation, creating an entirely new digital economy that continues to expand at an exponential rate.
The ongoing advancements within the Ethereum ecosystem, particularly the continuous development of its scalability solutions and the transition towards a more energy-efficient consensus mechanism, are critical for its long-term viability and growth. These technical improvements aim to address network congestion and high transaction fees, making Ethereum more accessible and efficient for a global user base. As these solutions mature and become more widely adopted, Ethereum's capacity to host and process an ever-increasing volume of transactions will only strengthen, further solidifying its position as the backbone of the decentralized web.
The "do not ignore" message resonates deeply with Ethereum's fundamental value proposition. It is a network that is constantly evolving, attracting the brightest minds in technology, and demonstrating real-world utility that extends far beyond speculative trading. The combination of a thriving developer community, a vibrant ecosystem of dApps, growing institutional acceptance, and a clear roadmap for future improvements positions Ethereum as a cornerstone of the digital future. The current market signals, from the new all-time high in a key metric to the unprecedented institutional inflows, are not just fleeting trends but indicators of a profound shift in how the financial world and broader society view and utilize this revolutionary technology.
In conclusion, Ethereum stands at a pivotal moment. The convergence of strong on-chain fundamentals, evidenced by a new all-time high in a major network metric, and a significant influx of institutional capital underscores its growing maturity and undeniable importance. Despite broader market uncertainties, Ether investment products have seen historical inflows, signaling deep-seated confidence from sophisticated investors. Technically, the asset is consolidating, building momentum that analysts believe could propel it towards the $3,000 mark in June. For those observing the digital asset space, the message is clear: Ethereum is not just surviving a market slowdown; it is thriving, evolving, and cementing its role as an indispensable pillar of the decentralized economy. Ignoring its current trajectory would be to miss a significant chapter in the ongoing digital revolution.
Ethereum - Expecting Bullish Continuation In The Short TermH1 - We have a clean bullish trend with the price creating a series of higher highs, higher lows structure.
This strong bullish momentum is followed by a pullback.
No opposite signs.
Until the two Fibonacci support zones hold I expect the price to move higher further.
If you enjoy this idea, don’t forget to LIKE 👍, FOLLOW ✅, SHARE 🙌, and COMMENT ✍! Drop your thoughts and charts below to keep the discussion going. Your support helps keep this content free and reach more people! 🚀
--------------------------------------------------------------------------------------------------------------------
Disclosure: I am part of Trade Nation's Influencer program and receive a monthly fee for using their TradingView charts in my analysis.

ETH/USDT At A Premium — What’s Next? Smart Entry Strategy!I'm currently analyzing ETH/USDT 🧠💹 — Ethereum has been in a strong bullish trend, recently pushing into all-time highs 🚀🔝. While the momentum remains intact, price is now trading at a premium 🏷️, and I’m cautious about entering long at these elevated levels ⚠️.
In the video, we break down the trend, market structure, and price action with precision 📊🧱. I also explore potential entry scenarios that align with low-risk, high-probability setups 🎯🔍 — ideal for those waiting for the right moment to engage without chasing the move.
You'll also get a deep dive into my Trend Continuation Strategy 🔄📈 — a powerful framework for identifying smart entries in trending markets.
🛑 This is not financial advice

$ETH - Ethereum enters buy zoneHey traders!
How is your portfolio doing? Trump is shaking us!
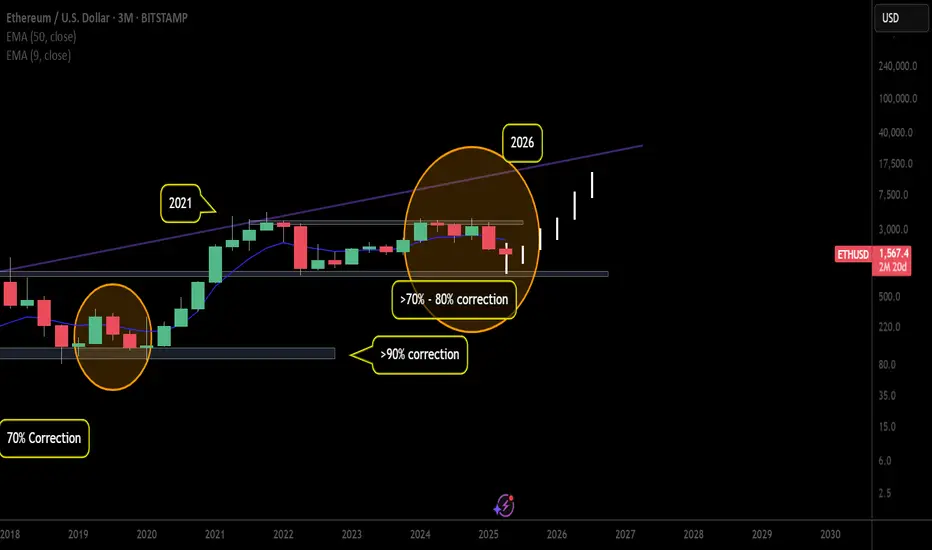
After all these months in 2025 I've tried to project a new scenario (bullish/bearish) that clarifies our next outlook.
Not an easy job. As you see day by day, markets are in high volatility due to trade war and (not trying to be pesimistic) could be worse.
However, In my opinion Ethereum (and altcoin markets) are entering into a golden opportunity. that has to be taken 100%. Don't know where is the bottom for CRYPTOCAP:ETH on a short scenario. But, what I can certainly say is that won't fall as a stone for too long.
Ranges between 1400 - 2000 USD are gold prices to make progressives buys. Although it could fall even more ( 900 - 1200 USD) I think this is a high Risk reward buy.
But, timing is not on time. Shouldn't I sell, expecting a bear market( you know Halving and Posthalving ideas). Times have changed as the macro scenario has not been the same as the previous bullruns.
So, it's time to accumulate and expect a possible expansion cycle in 2026.. That could lead Ethereum to prices never seen before. Yes, the range between 8.000 - 15.000 USD.
As I always say. Just my opinion. Stay safe!
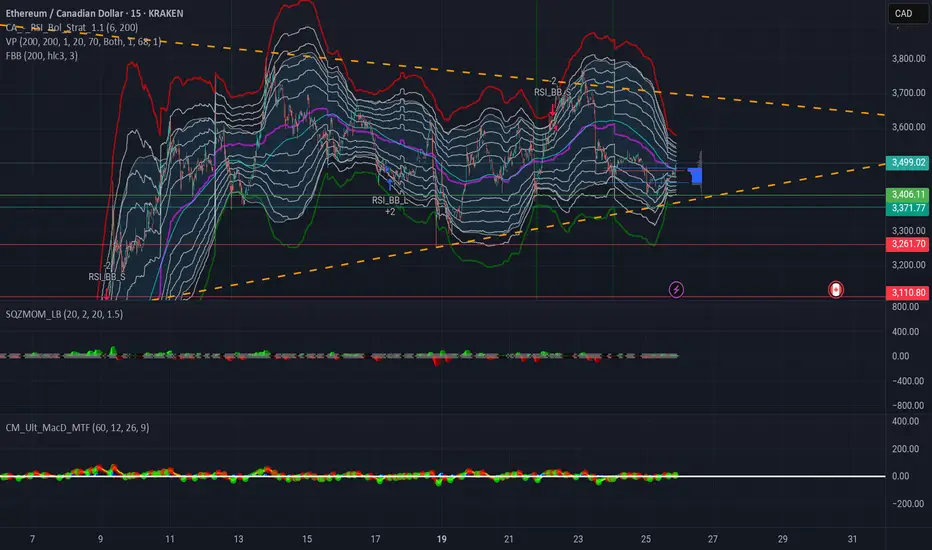
Eth to test 3800/4000 cadThis looks too good!
Coiling nicely buying momentum increasing at 3400/3500
Working perfectly for a breakout. I'm bullish to see 4500 right quick
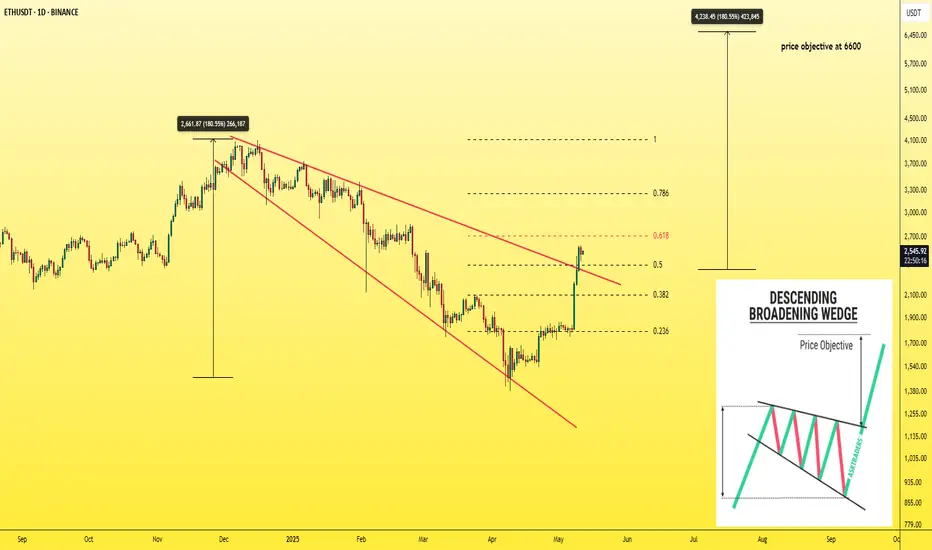
Ethereum ... Don't miss this train!The Ethereum season has arrived, and in the coming days, we'll be focusing on Ethereum and the tokens built on its network.
The chart shows a descending broadening wedge pattern, which has been broken on the daily timeframe.
Don’t wait for a retest or any major corrections—this train won’t wait for you.
The target for this pattern is $6,600.
Best regards Ceciliones🎯
ETHUSDT – Eyes on the Green Line!ETHUSDT – Eyes on the Green Line!
“Momentum is building, and all signs point to the next key level—the green line is in play!”
🔥 Key Insights:
✅ Trend Remains Strong – No reason to fade the move.
✅ Green Line = Next Target – That’s where liquidity & reactions will matter.
✅ Pullbacks = Buying Opportunities – No FOMO, we wait for strategic entries.
💡 The Smart Plan:
Look for Dips to Load Up – Volume & CDV should confirm strength.
LTF Breakouts = Strong Entry Signals – Follow structure, not emotions.
Green Line = First Major Resistance – Expect reactions, manage risk accordingly.
“If momentum holds, Ethereum is headed straight for the green line—watch closely!” 🚀🔥
A tiny part of my runners;
💼 STMXUSDT: 2 Buying Areas
🐢 TURBOUSDT: Buy Zones and Buyer Presence
🌍 ICPUSDT.P: Massive Upside Potential | Check the Trade Update For Seeing Results
🟠 IDEXUSDT: Spot Buy Area | %26 Profit if You Trade with MSB
📌 USUALUSDT: Buyers Are Active + %70 Profit in Total
🌟 FORTHUSDT: Sniper Entry +%26 Reaction
🐳 QKCUSDT: Sniper Entry +%57 Reaction

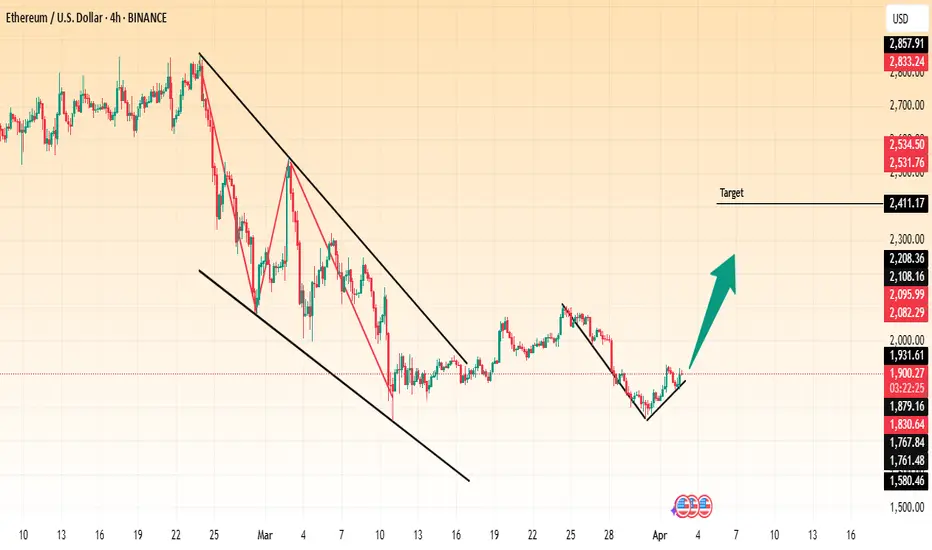
(ETH/USD) Breakout from Falling Wedge – Bullish Momentum Ahead?Ethereum (ETH/USD) Breakout from Falling Wedge – Bullish Momentum Ahead?
This 4-hour Ethereum chart shows a breakout from a falling wedge pattern, a bullish reversal formation. The price has started forming higher lows, signaling potential upside movement. The projected target is around $2,411, indicating a significant recovery.
A successful retest of the breakout level could confirm further upward momentum. Traders may consider long positions while monitoring resistance levels.
📌 Key Levels:
Support: ~$1,879
Target: ~$2,411
Resistance Zones: $2,100 - $2,200
Would you like me to refine this further? 🚀
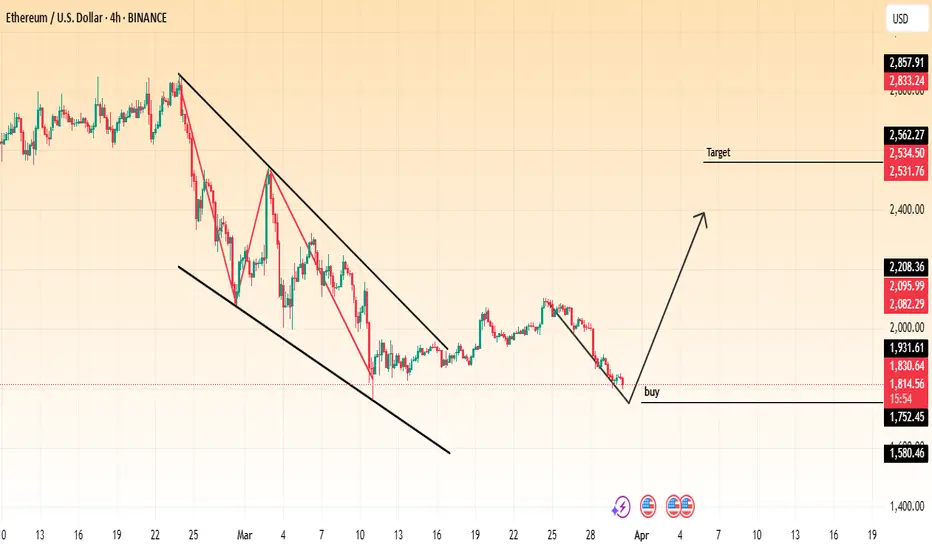
"ETH/USD: Breakout Incoming? Buy Signal from Falling Wedge!"It illustrates a downward trend with a falling wedge pattern, which is a bullish reversal pattern.
Key Observations:
Falling Wedge Pattern:
The price has been trading within a downward-sloping channel.
The wedge pattern suggests a potential breakout to the upside.
Breakout Opportunity:
The price is currently near the lower boundary of the wedge, suggesting a potential buying opportunity.
A buy signal is indicated at a key support level.
Target Price:
The chart has a target zone around $2,531 – $2,562, which suggests an expected upward move.
Technical Indicators:
The price is currently around $1,815, indicating a possible bottom formation.
A bullish move from this level is expected.
Trading Idea:
Entry: Buy near the current price ($1,815).
Target: $2,531 – $2,562.
Stop-Loss: Below $1,723 for risk management.
This analysis suggests a bullish reversal with a potential breakout from the falling wedge. However, traders should confirm with volume and other indicators before entering a trade.
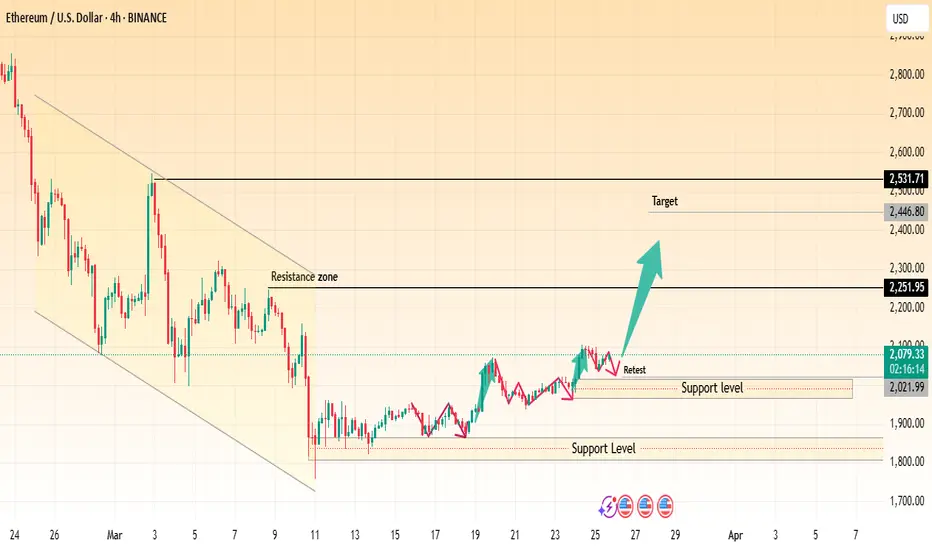
Ethereum (ETH/USD) Bullish Breakout – Eyes on $2,500+ Target 📈 Chart Overview:
Timeframe: 4H (Ethereum/USDT)
Trend Reversal: Ethereum has broken out of a falling wedge pattern, indicating a shift from bearish to bullish momentum.
Support Level: Around $1,800 - $1,900, where price previously found strong buying interest.
Retest Confirmation: ETH successfully retested the breakout level (~$2,020), confirming a potential bullish continuation.
Resistance Zone: The next key resistance area is around $2,250, followed by a potential move towards the $2,530 - $2,550 target zone.
📊 Trade Setup:
Bullish Bias: Price action suggests an upward move towards $2,250 and potentially $2,530.
Risk Management: A stop-loss can be set below $2,020 to minimize downside risk.
🔥 Conclusion: If Ethereum maintains momentum above the retest zone, it could see a strong rally in the coming days! 🚀
ETH/USD Breakout – Long Position Activated!Hi Traders ! Ethereum on the 1H chart has been trading within a descending channel and is now testing the upper boundary. I’ve placed a long entry expecting a breakout, targeting the $2,061 - $2,070 zone. Stop-loss set in case of a false breakout. RSI is showing signs of recovery. Let’s see how it plays out! 🔥👀
Disclaimer: This is not financial advice. Trade at your own risk. 🚨

ETH Breakout Setup: Eyeing $2,550 Target!"Key Observations:
Strong Support Level: ETH has bounced from a strong support zone around $1,792 - $1,905.
Retest & Buy Zone: Price has broken above a key level and is now retesting it, indicating a potential buy opportunity.
Resistance Zone: A key resistance zone is marked near $2,557.71.
Target Levels: The first target is set at $2,557.71, with a possible further extension to $2,854.38.
Bullish Confirmation: If ETH maintains support above $1,981, the uptrend towards the target is likely.
Trading Idea:
Entry: Buy on successful retest.
Stop Loss: Below the strong level at $1,905 - $1,792.
Take Profit: First target at $2,557.71, extended target at $2,854.38.
This setup follows a classic breakout and retest strategy, suggesting bullish momentum if Ethereum sustains above key levels.

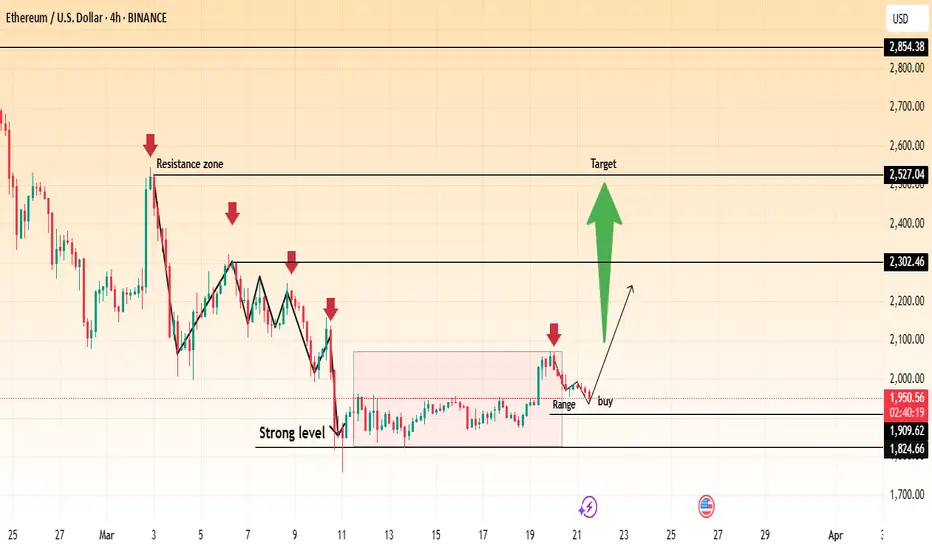
Ethereum (ETH/USD) – Potential Breakout from Range Towards $2,50📊 Chart Insights:
ETH/USD is currently ranging near the $1,950 zone, following a consolidation phase.
A strong resistance zone is visible between $2,302 - $2,527, which has historically acted as a rejection point.
Support levels are established around $1,824 - $1,909, forming a strong base for price action.
A breakout above the current range could signal a bullish move toward the $2,302 resistance level, with a further target at $2,527.
📈 Trading Plan:
✅ Entry: Buy above $1,966 on confirmation of breakout.
🎯 Targets: $2,302 and $2,527 for profit-taking.
❌ Stop Loss: Below $1,909 to manage risk.
📉 Bearish Scenario: If ETH fails to hold $1,909, a retest of $1,824 is possible.
🔥 Ethereum could see a strong rally if momentum builds above resistance! Are you ready?