ETHUSD Intraday Bullflag1H chart, nice trade entry for margin / leverage traders. Easy profits to be taken at 200MA level. Enjoy.
Ethereumprice
Three White Soldiers PatternThree white soldiers is a bullish candlestick pattern, a reversal pattern. This pattern suggests a strong change in market sentiment. The opposite of the 'three white soldiers' pattern is the 'three black crows' pattern.


Ethereum : Double Bottom pattern.Ethereum : Double Bottom pattern.
Note: This is only for Educational purposes; this is not investment advice.
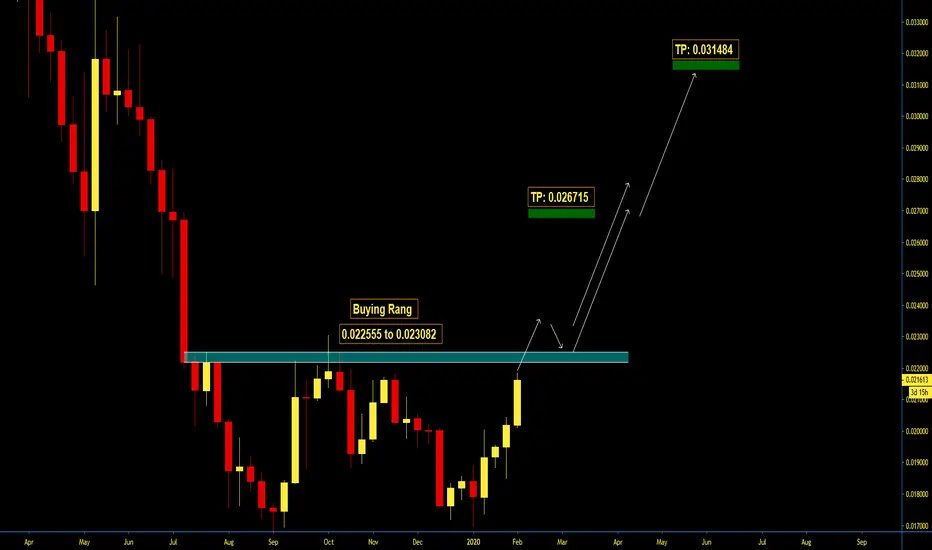
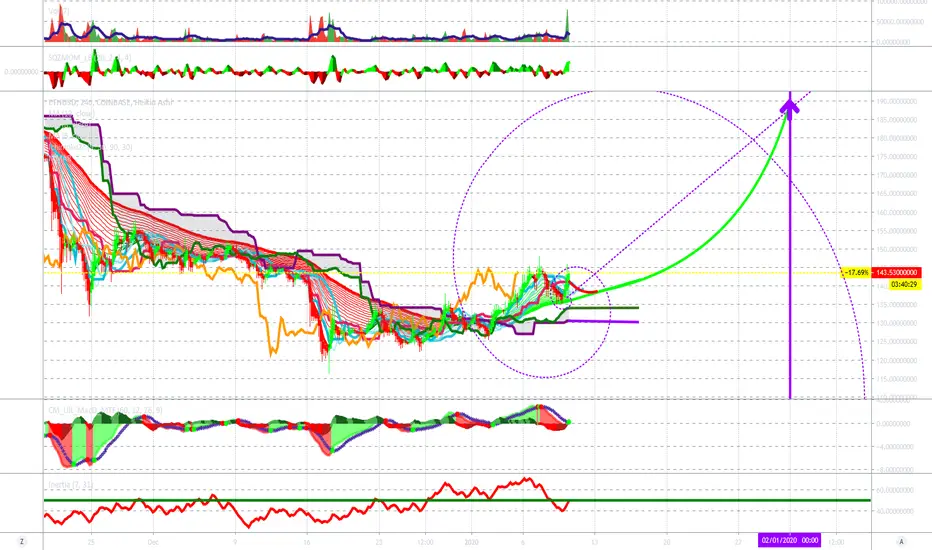
ETHEREUM 1/20 MOON TARGET DATEHello personal traders,
This is no secret.
Ethereum is on the rise.
Check ETH/BTC if you need reference, as well as market caps.
My logic is shown clearly on the graph with my indicators.
Buy and Hold Ethereum is my final call.
Thank you,
-dysonring2050
#whatwhalesdon'twantyoutoknow

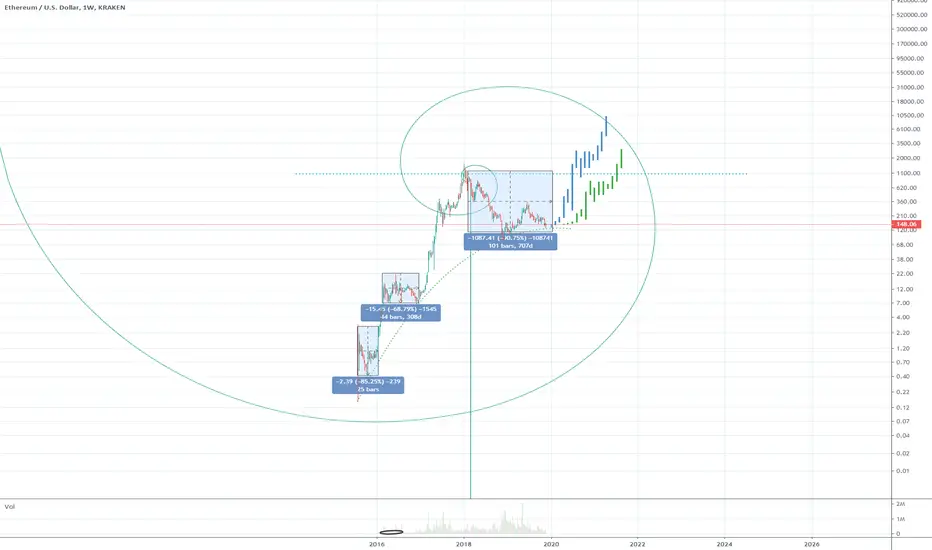
My first ever fractalConstructive criticism encouraged! I'm new to fractals and they seem to be a great and very exciting tool for trading, long term Ethereum chart.
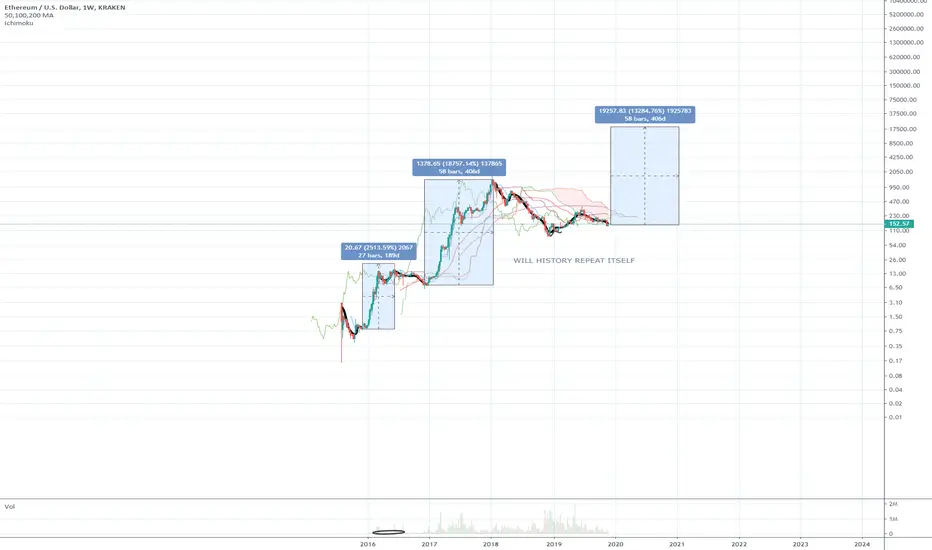
HistoryWill ETH repeat history and start a massive new bull run? Imo ETH has just been in a dip for a year, and we will see BIG movement in the years to come, with a moonshot comparable to Bitcoins 2017 run. Exciting times.
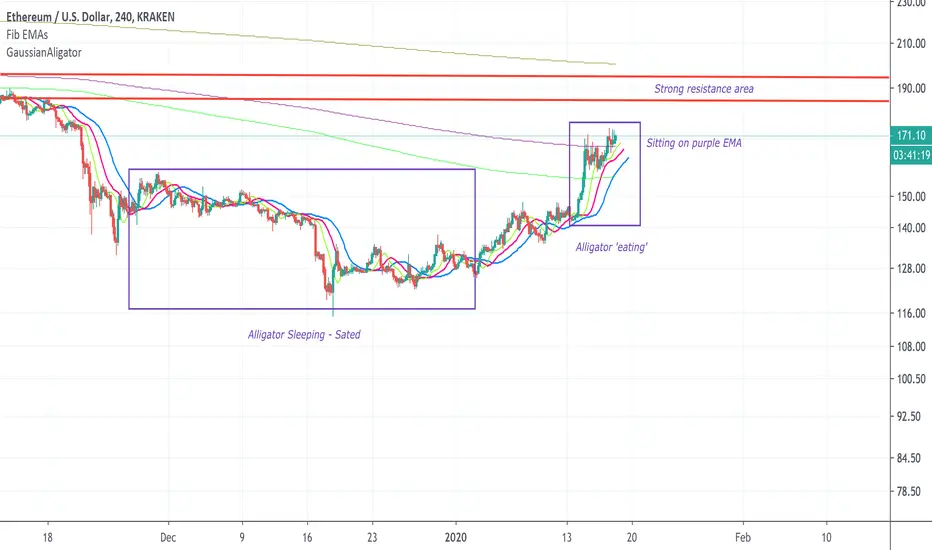
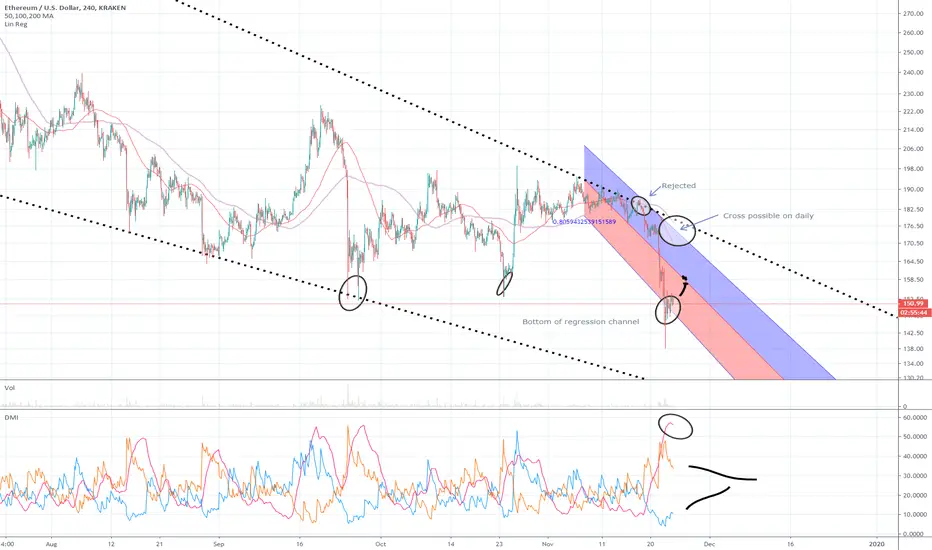
Ethereum holding 150?Bottom of regression channel on 4hr looking for a move upward, DMI shows extended bearish action, hopefully holding the parabolic curve seen in the weekly chart.
Ethereum (ETH) analysis 18.11.2019We were not expecting big moves in the green zone for the coin unless a proper consolidation was in place to trigger an escape from the $180-$190 area.
This was even more obvious on Thursday, November 14 as the Ethereum token continued to slide and retreated to $184. We witnessed another sharp drop in price on the last day of the workweek. The coin closed at $179,7 with a 2.7 percent decrease or one step below the support zone.
On Saturday, November 16, the ETH/USD pair initiated a recovery and jumped to $182. It continued to rise on Sunday, November 17 and closed at $183.9 with 2.9 percent of a weekly loss.
The chart remains unchanged due to the unchanged conditions in ETH trading during the last 4 days. ETH is still ranging in the $190 -$180 zone since October 26. It was again rejected at $190 on
November 14 and moved down to the lower end of the trading area.

Ethereum Cryptocurrency Bullish Long Term Forecast. Parabola?No one knows what is going on with Ethereum. So I stick to charts. This is not financial advice, but look at what you see.
- 5KYL085T3R

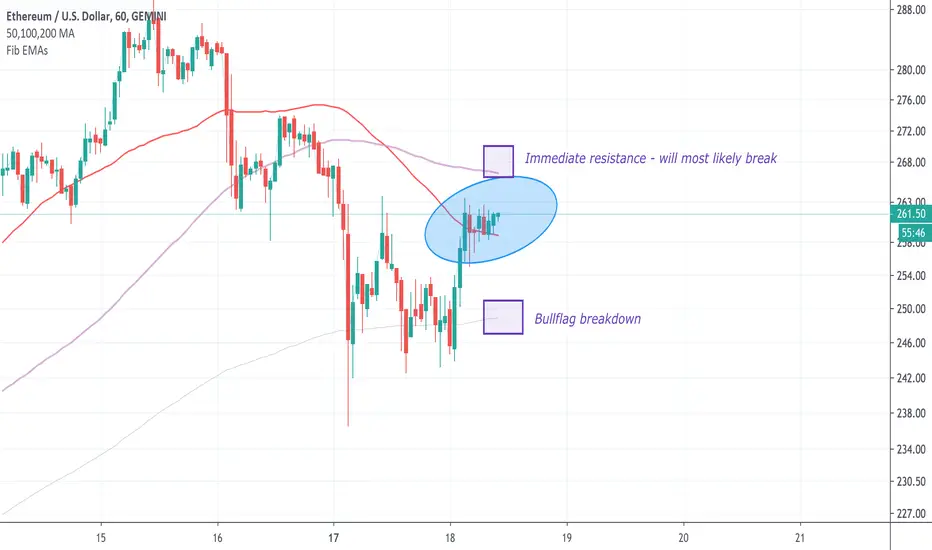
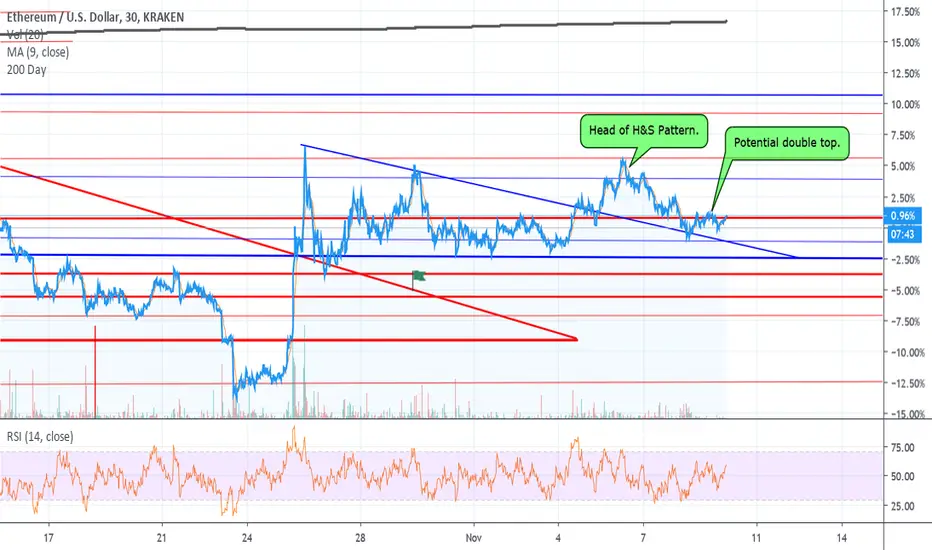
Bull Flag confirmed, but now what?Ethereum had a nice parabolic move to the upside along with Bitcoin on Oct 24th & 25th, and since then traded in a bull flag that recently broke to the upside.
Since the bull flag has played out however, we've seen a H&S play out, and now what appears to be a double top forming into another potential H&S pattern..
Since Bitcoin broke to the downside yesterday from a descending triangle Eth hasn't reacted much, interesting.
ETH/USD LogPotential for massive returns, 7000% seems far-fetched however based on the previous bull run, that is what we have seen.
Hopefully we see some upward movement with the release of ETH 2.0.


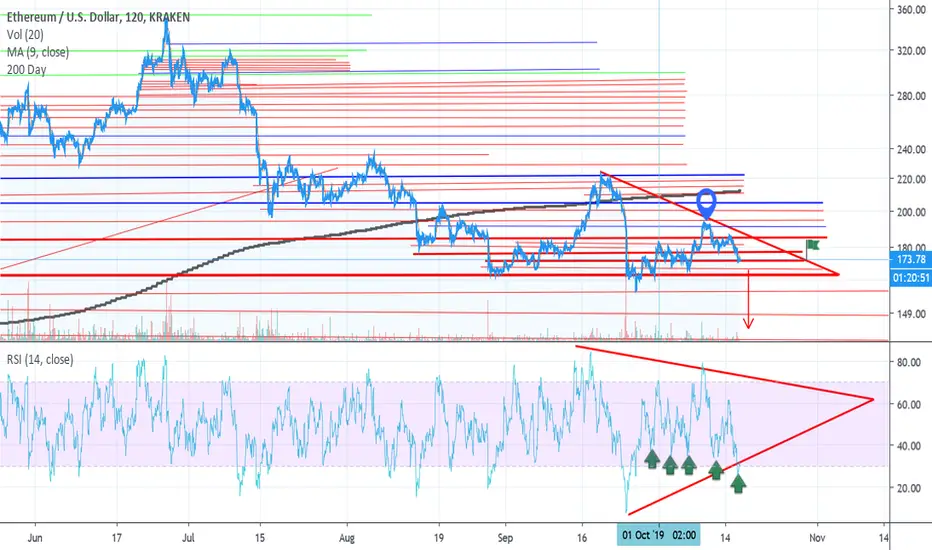
Is Ethereum trading in a descending triangle.Since trading in a large ascending triangle starting in early February this year, breaking out in mid May, we've seen a blow off top down into a descending triangle.
Now it appears as though this could play out as a bull flag & negate the descending triangle... It's possible we see a rally, because Bitcoin is clearly trading in a bull flag or descending triangle as well. ETH likes to trade in correlation with BTC, so we'll see I guess...
The 200 Day MA isn't far away, roughly 17% to the upside, and the rsi is roughly neutral. Interesting.
Time will tell per usual.


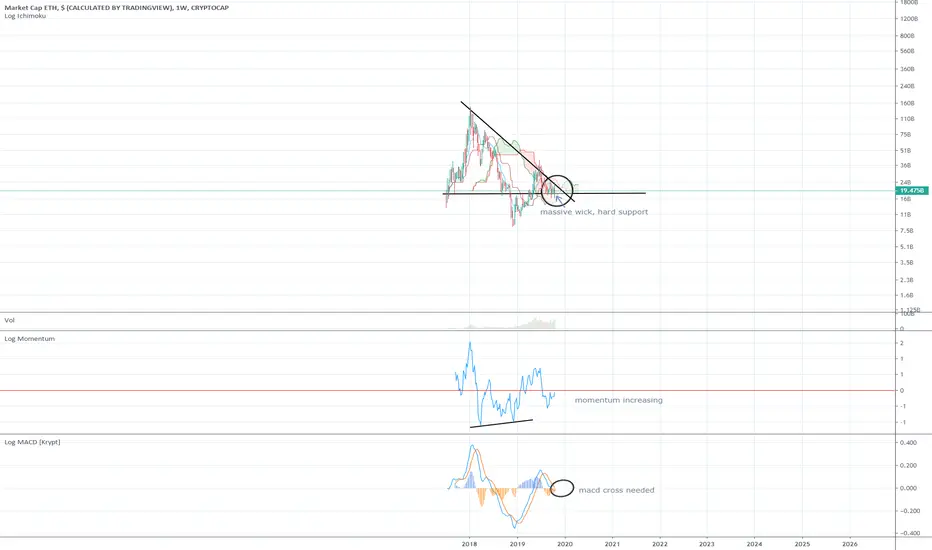
Ethereum Market CapMy reasons for Holding Ethereum, setting up for a ichimoku cross inside the cloud, possibly could get very bullish above the psychological resistance of 200B
Thanks!
Where all my hodlers at?
ETHEREUM need some retrace? Vitalik, do something...ETHBTC divergence on 4hrs
Waiting for pullback before speculate to any more long.
Green triangle the target zone.
Between FIB 0.38-0.5 somewhere.
I'm not shorting this, only waiting for good long entry.

Ethereum - What is Ether up to these days?Ethereum finds itself at the beginning of a death cross, what this means is that if BTC decides to keep going down further (which it will) Ethereum will go down harder and stay under the 50MA for most of the times with maybe a spike above it once in a while. I guess that most high performing alts will try to stage a double bottom which will put Ethereum around the $80 - $100 range. But let's look at something interesting below.
In the chart below -- which is the total market cap of crypto -- you can see that money has been flowing in during the weekend (14 billion dollars) so far. A good portion has gone to Ethereum, which means that someone is finding it very valuable.
In the chart below you can see that BTC has lost dominance which reinforces that the money that came into this asset class did not go to BTC directly.
It is little hints like the ones I give you here that will keep you safe and ahead of the curve.
NOW, THE LEGEND;
Support trendlines are green
Resistance trendlines are Red
Horizontal support lines are white, the thicker the stronger the support
50 Moving Average is yellow
200 Moving Average is white
THE TREND: Safe to buy a little of ETH and more on the dips
THE OUTLOOK: ETH will go up fast once the bottom is in
Be safe and follow me to make money and stay ahead of the curve.
Xena Exchange Resident xena.exchange

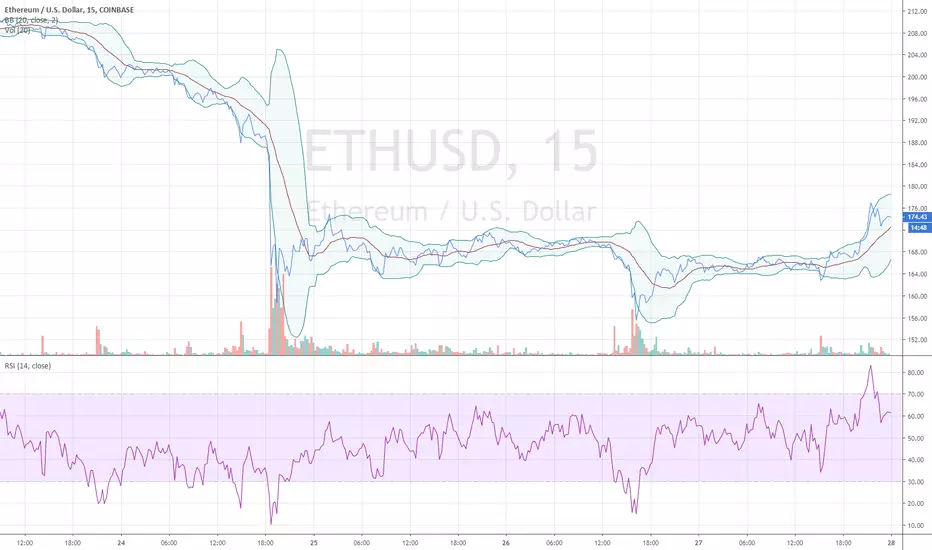
Ethereum Price Analysis and Prediction - Bulls Coming in HOTTTT
Relative Strength Index: The RSI is currently at a relatively high 60 points, meaning the market is somewhat overbought and we should expect a slight correction downards.
Bollinger Bands: The price is within the BB range, yet it's still above the MA. This also means a slight retracement in the next few hours is likely.
Volume: There is moderate to low amount of volume, which signals that the market can move a few percent in either direction and is not out of fuel.
Ethereum Price Prediction
In my previous Ethereum price prediction, I predicted that:
“ETH will stabilize around $170 and trade sideways for the next few hours.”
While Ethereum did have it’s dips and peaks, it looks like the $170 level is a favorite position for ETH. As such, I will continue with my prediction that ETH will once again dip to the $170 support level, before moving upwards to try and test the $180 support. If ETH can successfully hold $180, $190 will follow shortly after as ETH doesn’t like to trade sideways at the $180 level.
Read Full Ethereum Price Analysis and Prediction: NullTX