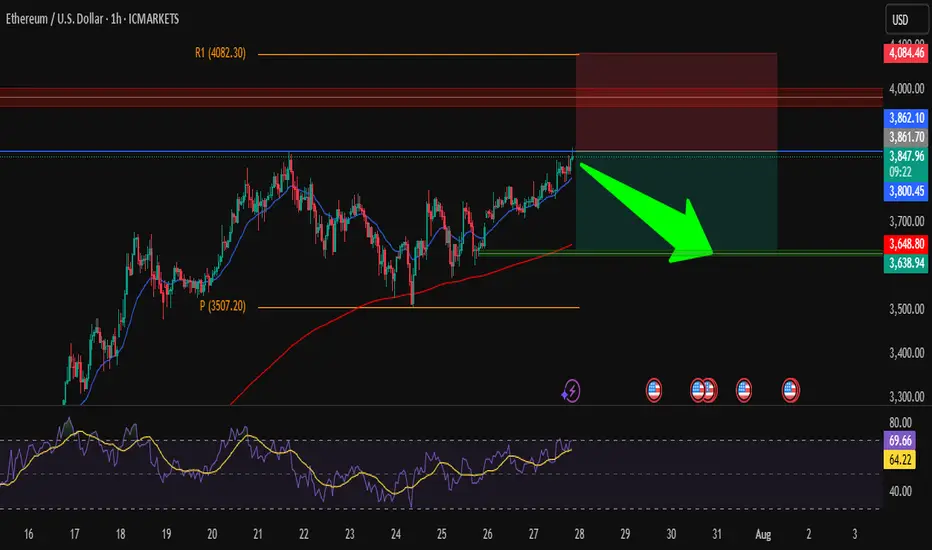
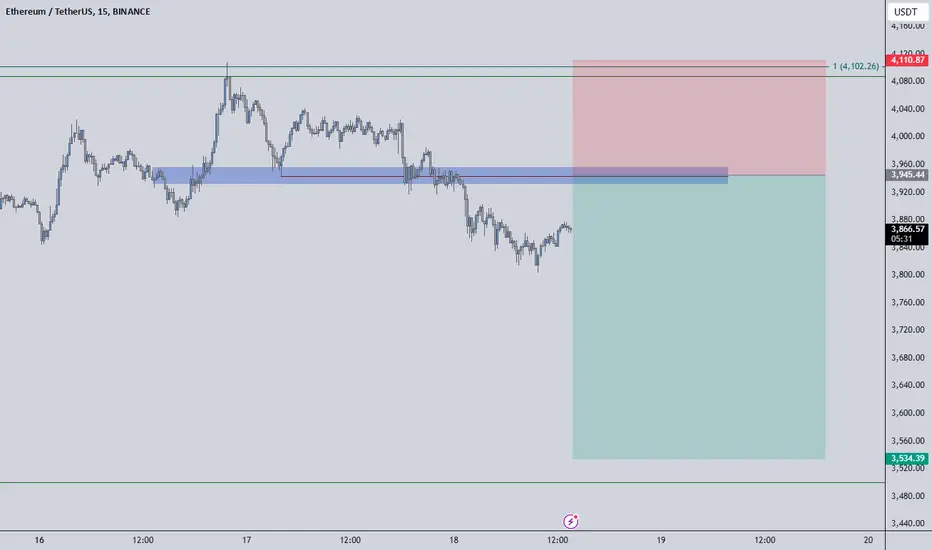
ETH/USD – Short from ResistanceHi traders ! , I opened a short position on ETH/USD as price is hitting a strong resistance zone.
Entry: 3850
SL: 4084.46
TP: 3638.94
📌 Why I took this trade:
Price is testing a strong resistance zone around 3860, RSI is overbought, and we could see a pullback toward the support area around 3640.
Nice risk/reward setup, keeping it simple.
This is just my analysis, not financial advice.
What’s your view — drop or breakout?
Ethereumshort
Ethereum (ETH) to U.S. Dollar (USD) 4-Hour Chart - Binance4-hour candlestick chart from Binance displays the price movement of Ethereum (ETH) against the U.S. Dollar (USD) from late June to early July 2025. The current price is $2,608.76, reflecting a +$65.53 (+2.58%) change. The chart includes buy and sell indicators at $2,608.76, with a highlighted resistance zone around $2,700-$2,760 and a support zone around $2,540-$2,600. The chart also shows a recent upward trend with fluctuating volatility.

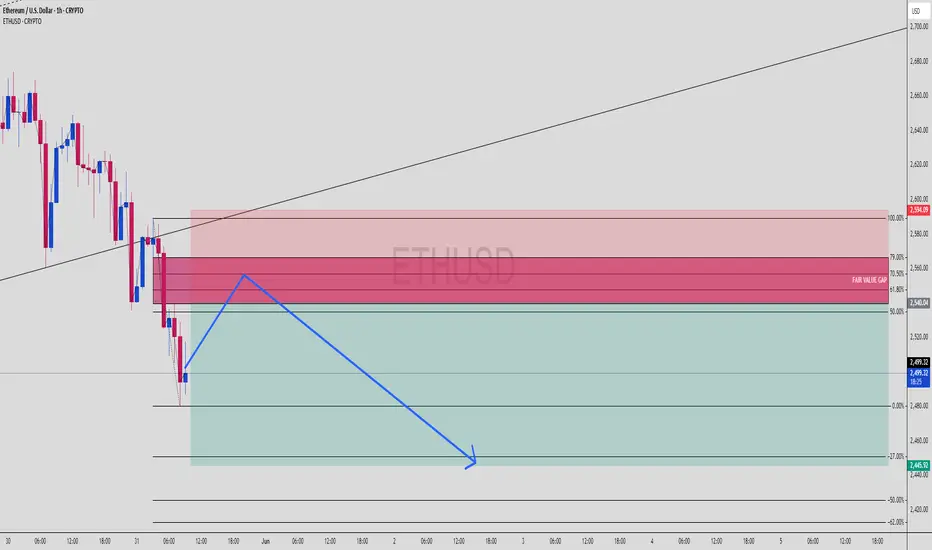
ETHUSD Bearish FVG Play | Premium Rejection Loading?Ethereum (ETHUSD) 1H Smart Money Bearish Setup | FVG + Fib Confluence
Textbook short scenario lining up on ETHUSD as it retraces into a premium zone filled with imbalance. Let’s unpack the key ingredients of this setup for the squad.
🔍 1. Trade Idea Summary
Price dumped sharply, leaving a clean Fair Value Gap
Retracement into premium (Fib 61.8%–79%) zone
Confluence of:
✅ FVG Supply
✅ Fib retracement zone
✅ Internal structure breaker
Targeting sell-side liquidity near 2,445 for a smooth RR 1:3+ setup.
📊 2. Key Zones on Chart
Entry Zone: 2,540 – 2,590 (FVG + 61.8%–79% Fib)
Strong High for Sweep (if needed): 2,594
TP Zone (Sell Side Liquidity): 2,445
SL: Above 2,600
🧩 3. Smart Money Concept Breakdown
Market made a lower low ➝ bias shifts bearish
Now retracing into the last up candle before the dump (FVG zone)
Expecting:
Premium rejection
Lower time frame CHoCH
Push to sell-side liquidity
⚙️ 4. Execution Plan
Let price enter FVG zone
Wait for M5 or M15 bearish break of structure
Confirm with:
OB rejection
Entry confirmation candle
Ride it down to TP or trail SL at midpoint
💡 5. Trader Tips:
Watch volume drop as price enters FVG — sign of weak buyers
Don’t force entry — let structure confirm
⚔️ Comment "ETH Breakdown 🔪" if you're eyeing this short
📈 Save this setup & follow @ChartNinjas88 for real-time sniper breakdowns
🎯 DM “TRADE” for access to my sniper SMC playbook
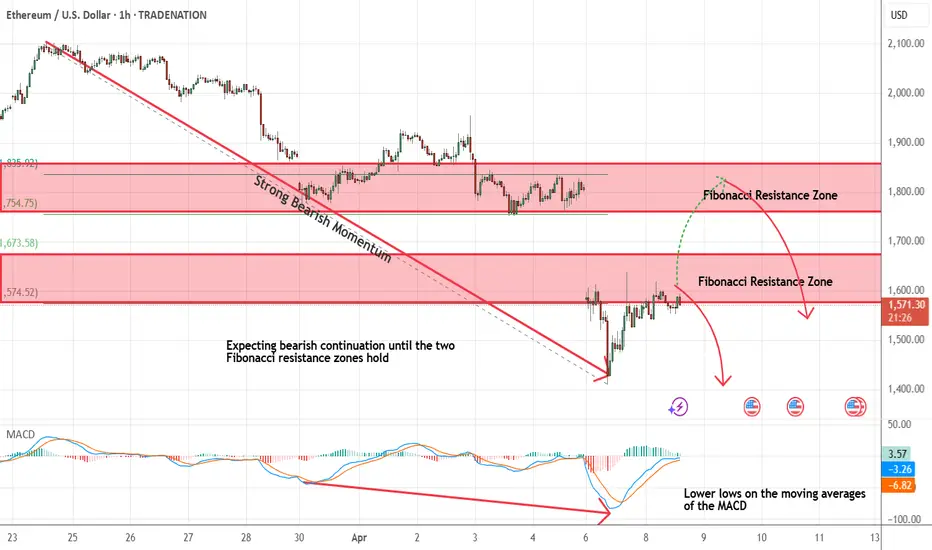
Ethereum - Short Term Sell Trade Update!!!Hi Traders, on April 8th I shared this idea "Ethereum - Expecting Retraces Before Prior Continuation Lower"
I expected retraces and further continuation lower until the two Fibonacci resistance zones hold. You can read the full post using the link above.
The bearish move delivered, as expected!!!
If you enjoy this idea, don’t forget to LIKE 👍, FOLLOW ✅, SHARE 🙌, and COMMENT ✍! Drop your thoughts and charts below to keep the discussion going. Your support helps keep this content free and reach more people! 🚀
-------------------------------------------------------------------------------------------------------------------
Disclosure: I am part of Trade Nation's Influencer program and receive a monthly fee for using their TradingView charts in my analysis.
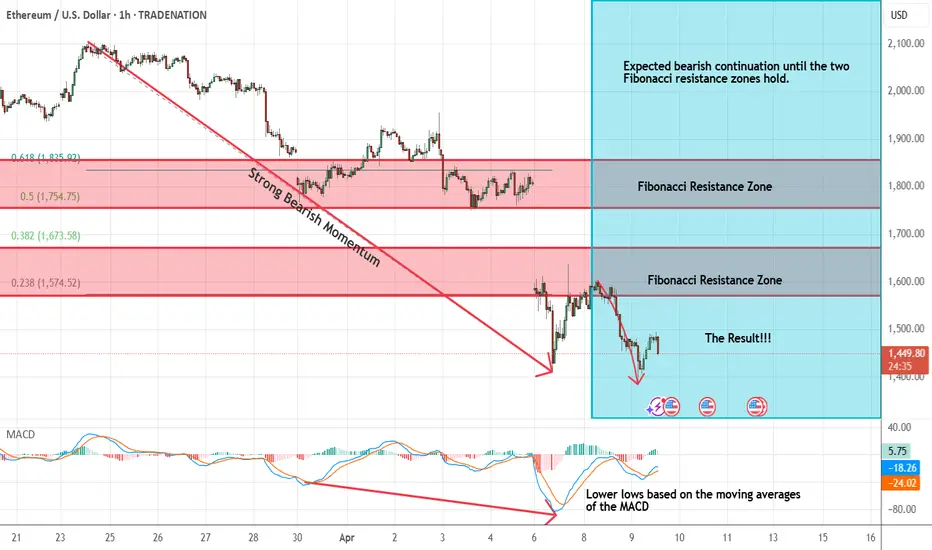
Ethereum - Expecting Retraces Before Prior Continuation LowerH1 - Bearish trend pattern in the form of lower highs, lower lows structure.
Strong bearish momentum
Lower lows on the moving averages of the MACD indicator.
Expecting retraces and further continuation lower until the two Fibonacci resistance zones hold.
If you enjoy this idea, don’t forget to LIKE 👍, FOLLOW ✅, SHARE 🙌, and COMMENT ✍! Drop your thoughts and charts below to keep the discussion going. Your support helps keep this content free and reach more people! 🚀
--------------------------------------------------------------------------------------------------------------------
Disclosure: I am part of Trade Nation's Influencer program and receive a monthly fee for using their TradingView charts in my analysis.
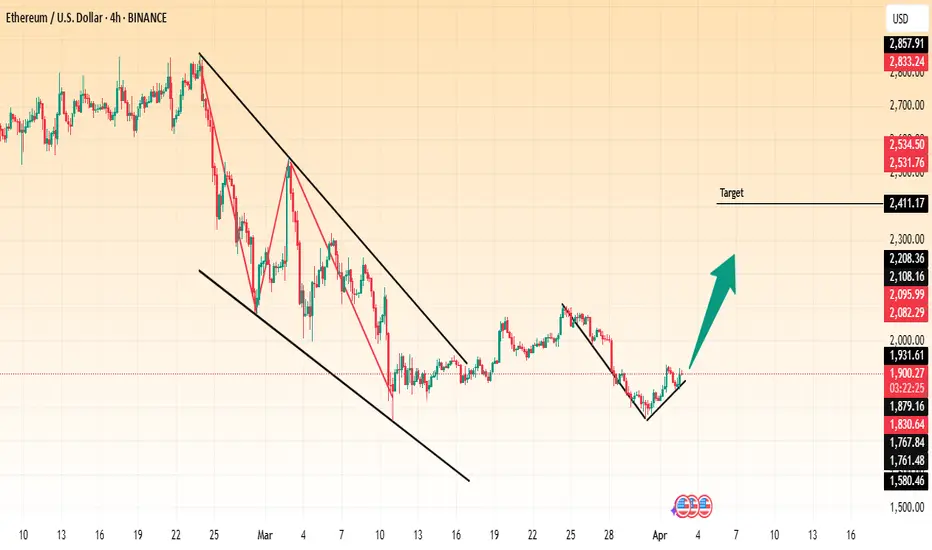
(ETH/USD) Breakout from Falling Wedge – Bullish Momentum Ahead?Ethereum (ETH/USD) Breakout from Falling Wedge – Bullish Momentum Ahead?
This 4-hour Ethereum chart shows a breakout from a falling wedge pattern, a bullish reversal formation. The price has started forming higher lows, signaling potential upside movement. The projected target is around $2,411, indicating a significant recovery.
A successful retest of the breakout level could confirm further upward momentum. Traders may consider long positions while monitoring resistance levels.
📌 Key Levels:
Support: ~$1,879
Target: ~$2,411
Resistance Zones: $2,100 - $2,200
Would you like me to refine this further? 🚀
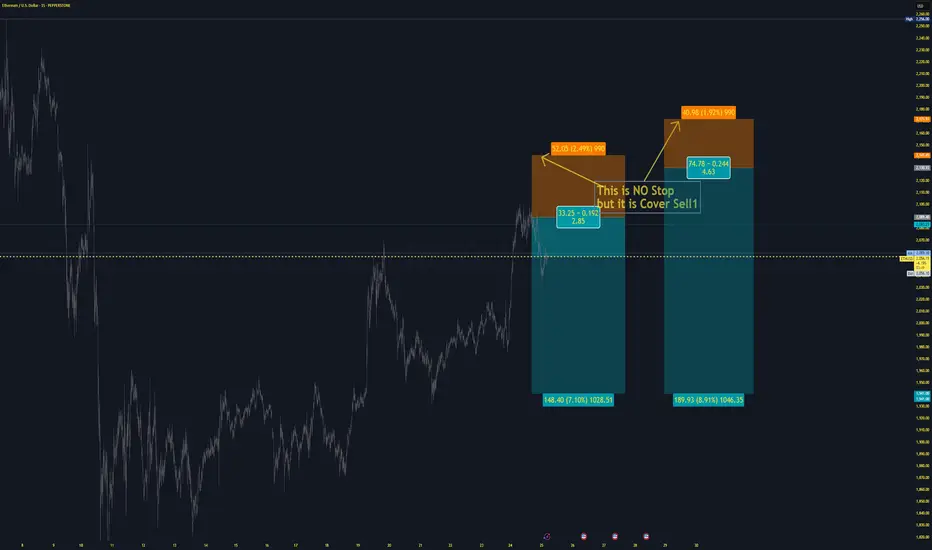
ETH USD ShortTrumps hope rally doesnt change in real fundamentals.
ETHUSD definitley a MUST-Short to me.
I cover the sells there where hype is the biggest: Others buy breakouts,or set their stops and take profits,I sell exactly those levels.
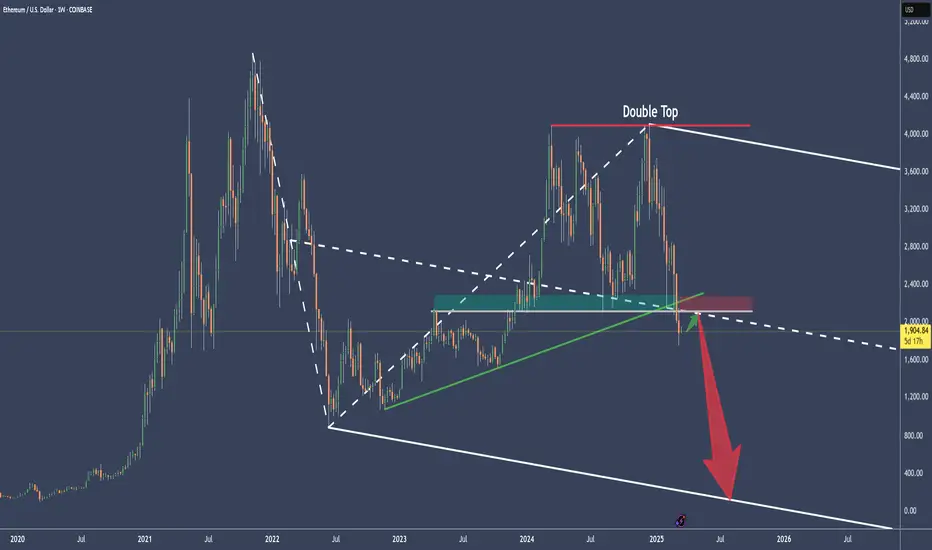
ETHUSD Cracked the longterm supportFirst there was the Double-Top.
Then there was no higher close above the last 2 highs, pressing ETHUSD brutally down to fullfill the Medianlines Rule to reach the Center-Line over 80% of times.
Then price not only reached the Center-Line by breaking through the slanted green support, but also cracked through the weekly horizontal Base (grey) which acted as the last support Bastion.
There are two scenarios possible.
a) a pullback, jump above the CL and we will see a moonshot.
or
b) price is retracing the Center-Line as it does most of the time after it's break, and then continues to the downside. Target would be the Lower-Medianline-Parallel.
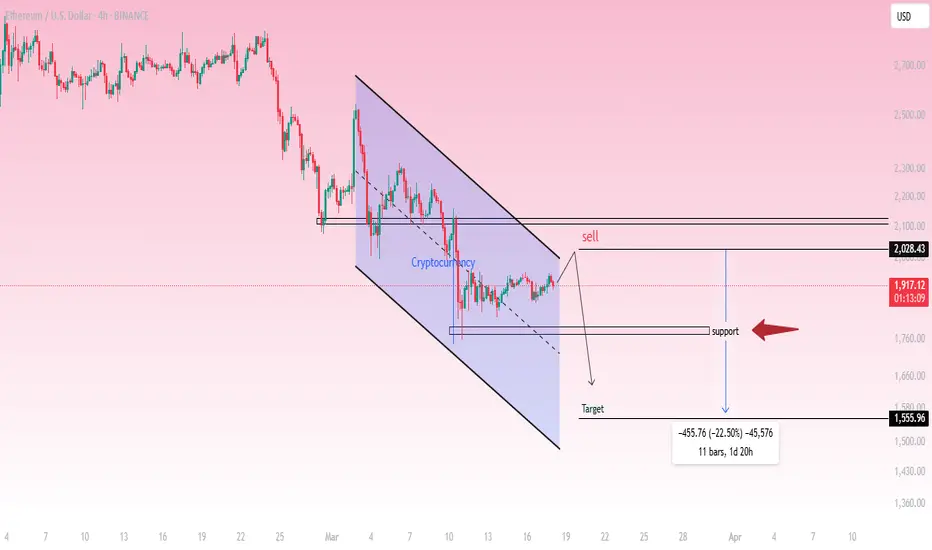
Ethereum (ETH/USD) - 4H Analysis & Trade Setup
Market Overview:
ETH/USD is in a downtrend, forming a descending channel.
Price is currently trading around $1,915.23, showing signs of consolidation near resistance.
Technical Analysis:
Trend: Bearish
Resistance Level: $2,028.43
Support Level: $1,760
Target: $1,555.96
Pattern: Descending Channel
Trade Idea (Short Setup):
🔴 Sell Zone: Around $2,028.43 (Resistance)
✅ Target: $1,555.96 (-22.50%)
⛔ Invalidation: A breakout above $2,028
Conclusion:
Ethereum is respecting the downward channel structure.
A rejection from resistance at $2,028 could confirm further downside.
Traders may consider short positions targeting $1,555.96, provided the trend remains bearish.
📉 Bearish bias remains intact unless price breaks above resistance.
Ethereum Analysis Ethereum Analysis
Ethereum is currently exhibiting a pattern similar to the one observed in Shiba Inu, with a clear downtrend that has led to the breakdown of a key support level. As of now, it seems to be retesting this broken support, though confirmation will only be possible once the current candle closes.
In my opinion, patience is critical in this scenario, and it would be wise to wait for the candle to close before considering any short positions. The broader trend still appears to be bearish, suggesting that Ethereum may not have exhausted its downward momentum just yet. However, market dynamics can shift rapidly, and it is important to remain vigilant and adapt to new information as it unfolds.
I would appreciate your thoughts on Ethereum's current price action and whether you agree with the assessment of a potential continuation of the downtrend. As always, thorough analysis, risk management, and due diligence are essential before making any trading decisions.
Cheers!

ETHEREUMUSDT | Risky Hedge ShortIn our previous ETHUSDT analysis, we mentioned the importance of the $4102 level and the possibility that our rapid entry into the range with its manipulation could lead to bad possibilities.
The price has entered the range again and continues to fall, but it is not nice that the liquidity remaining above is very open. Still, taking a short hedge is not a bad trade by taking the possibility of a losing 1R from here.
I keep my charts clean and simple because I believe clarity leads to better decisions.
My approach is built on years of experience and a solid track record. I don’t claim to know it all, but I’m confident in my ability to spot high-probability setups.
My Previous Analysis
🐶 DOGEUSDT.P: Next Move
🎨 RENDERUSDT.P: Opportunity of the Month
💎 ETHUSDT.P: Where to Retrace
🟢 BNBUSDT.P: Potential Surge
📊 BTC Dominance: Reaction Zone
🌊 WAVESUSDT.P: Demand Zone Potential
🟣 UNIUSDT.P: Long-Term Trade
🔵 XRPUSDT.P: Entry Zones
🔗 LINKUSDT.P: Follow The River
📈 BTCUSDT.P: Two Key Demand Zones
🟩 POLUSDT: Bullish Momentum
🌟 PENDLEUSDT.P: Where Opportunity Meets Precision
🔥 BTCUSDT.P: Liquidation of Highly Leveraged Longs
🌊 SOLUSDT.P: SOL's Dip - Your Opportunity
🐸 1000PEPEUSDT.P: Prime Bounce Zone Unlocked
🚀 ETHUSDT.P: Set to Explode - Don't Miss This Game Changer
🤖 IQUSDT: Smart Plan
⚡️ PONDUSDT: A Trade Not Taken Is Better Than a Losing One
💼 STMXUSDT: 2 Buying Areas
🐢 TURBOUSDT: Buy Zones and Buyer Presence
🌍 ICPUSDT.P: Massive Upside Potential | Check the Trade Update For Seeing Results
🟠 IDEXUSDT: Spot Buy Area | %26 Profit if You Trade with MSB
📌 USUALUSDT: Buyers Are Active
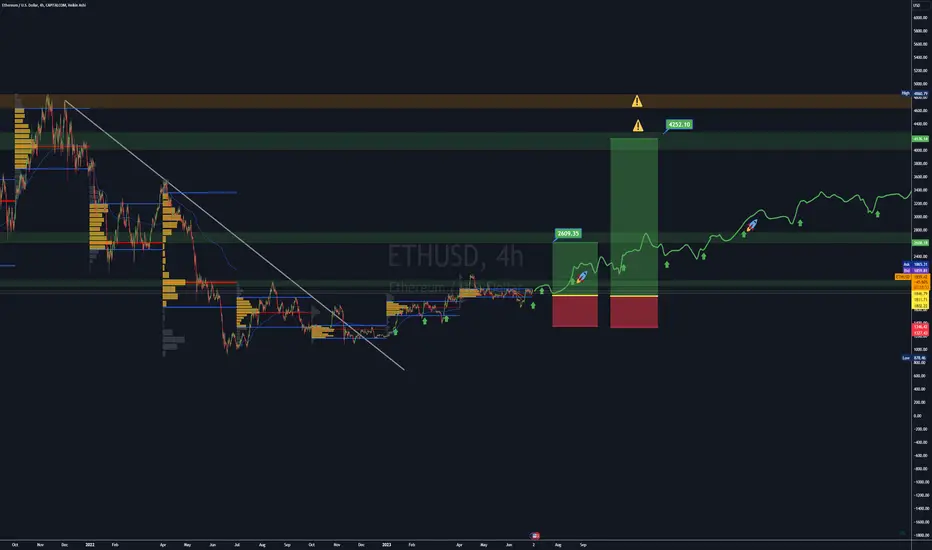
Ethereum Value Slashes by 99%Though this episode of crypto winter is very soon due to be a thing of the past, just a regular seasons do, it will come around again! Considering the all-time structure of Ethereum's price chart, I believe the next crypto winter will be especially bad for Ethereum.
While many altcoins are due for very sizeable runs (100x - 500x and more) over the next couple of years, I think Ethereum will top out near the $6000 mark, giving it a 3.6X push from current price levels. Beyond this, there is great chance that the sloping formation begins to drastically slip. Despite completing 2 sizeable five-swing moves and a correction between the two, its unlikely that this equates to a truly impulsive formation being developed.
The tell-tale sign for me is the extreme shallow correction that we see in the boxed area. Some would classify this as Wave 2 but I'm more inclined to believe it to be a Wave B instead. While it is possible for Wave 2 to find support/terminate near the 0.38 fib level, it is quite rare and even when it does, generally it still makes a return to the previous sub-wave 4. In this case of Ethereum this has not manifested.
If not in an impulsive wave, as the price action suggests, there are 2 options as to how this could play out:
1 - it Luna bombs and eventually makes new all-time lows.
2 - it drops to 0.618 - 0.89 fib levels (compared to the size of Waves A and C combined) and finds support there before resuming upside.
With this in mind, support at/near $20 is the very best outlook for Ethereum's mid-term future. From $6K-$7K, this would equate to a massive 99% drop and this is a very perfect reason why its important to study and understand the science of price action. The last macro crypto pattern I've seen resemble this form was Luna. I thought it would find support at $1.50 but instead it dropped to $0.0000. My Luna prediction was shared well before the drop came. We will see in the years ahead if Ethereum follows suit or if bulls make a stand.
Until next time, stay safe and don't drown. Peace!

Ethereum Retracement potential? 🤔Ethereum! Anticipating a retracement from Weekly Zone 3,519$ and monthly zone 3,346$. Wow! What an ascent that we have observed in recent weeks. A bull market typically has healthy retracements from profit taking and to clear late buyside liquidity. Gathering liquidity is necessary to continue the upside campaign and so we may retrace and consolidate for some time before the train continues. All other technicals explained in the video.
Please share your feedback if this analysis was useful.

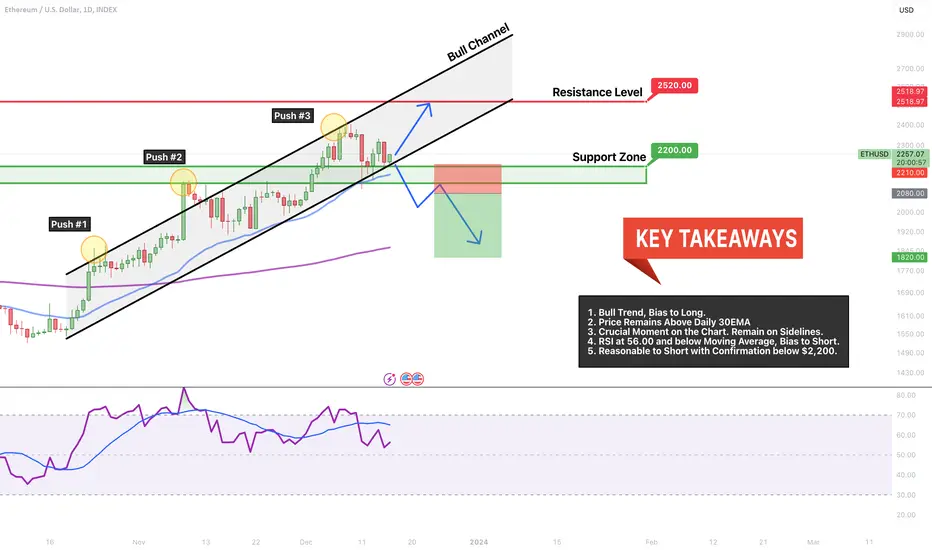
ETH → Blast to $2,500 then fall to $1,800? Reversal Time Near?Ethereum is far into its bull run from $1,100 to $2,300; with three pushes up and a Weekly RSI near the 70.00 level, and we're near a resistance level. Three initial conditions for a trend change.
How do we trade this? 🤔
These conditions are great indicators that we're near the end of the current bull trend, but we don't yet have any confirmation that we're done. We're still in the bull channel, price is above the 30EMA and we're above the Support Zone. We need a break below the Support Zone with a strong bear bar closing on or near its low and the RSI to remain below the moving average. There is a strong possibility that ETH has enough momentum left to hit $2,500, especially if Bitcoin finishes its Measured Move to $46,000 and takes the rest of the crypto market with it.
Until either scenario presents itself, we should remain on the sidelines and watch the price action unfold.
💡 Trade Ideas 💡
Short Entry: $2,080.00
🟥 Stop Loss: $2,210.00
✅ Take Profit: $1,820.00
⚖️ Risk/Reward Ratio: 1:2
🔑 Key Takeaways 🔑
1. Bull Trend, Bias to Long.
2. Price Remains Above Daily 30EMA
3. Crucial Moment on the Chart. Remain on Sidelines.
4. RSI at 56.00 and below Moving Average, Bias to Short.
5. Reasonable to Short with Confirmation below $2,200.
⚠️ Risk Warning! ⚠️
Past performance is not necessarily indicative of future results. You are solely responsible for your trades. Trade at your own risk!
Like 👍 and comment if you found this analysis useful!
Ethereum to continue LowerThe previous overall count remains valid, please find the link attached.
We seem to be bouncing back and forth between the 61.8% and equality of wave c vs. a.
Looking for that one last leg lower into wave 5 of c before considering longs.
Feel free to ask question, please leave a like if you enjoy the content,
Trade safe.

EthereumUSD Will Rise Higher to 2600 and then 4250,before...ETH Bulls to Target $1,950 on Sentiment toward Crypto ETFs
While staking inflows and US economic indicators will draw interest, ETF-related news will remain a focal point.
Bullish throughout the morning, ETH rose from an opening price of $1,828 to an early afternoon high of $1,879. Coming up against the First Major Resistance Level (R1) at $1,874, ETH eased back to end the day at $1,853.
This morning, ETH was up 1.35% to $1,878. A mixed start to the day saw ETH fall to an early low of $1,843 before rising to a high of $1,879. The First Major Resistance Level (R1) at $1,879 capped the upside.
ETH Technical Indicators
Looking at the EMAs and the 4-hourly candlestick chart (below), it was bullish signals. Ethereum sat above the 50-day EMA, currently at $1,856. The 50-day EMA pulled away from the 100-day EMA, with the 100-day EMA widening from the 200-day EMA, delivering bullish signals.
A hold above the 50-day EMA ($1,856) would support a breakout from R1 ($1,879) to target R2 ($1,904) and $1,950. However, a fall through the 50-day EMA ($1,856) would bring the 100-day EMA ($1,837), S1 ($1,828), and the 200-day EMA ($1,828) into view. A fall through the 50-day EMA would send bearish signals.
Resistance & Support Level
R1 – $ 1,879 S1 – $ 1,828
R2 – $ 1,904 S2 – $ 1,802
R3 – $ 1,955 S3 – $ 1,751
Strategy Bullish
3Lots
2 Lots will be excecuted at Profit Target Zones
1Lot will follow the Trend
It will be only!!! excecuted ,if Bullish Trend changes
The stops will be delivered as soon as possible to break even,better some pips above the Buyinh price
I have marked my profit targets
Psychology:
1:The price is always right
2The Market is alwas right
3 The Chart is always right
4 IGNORE THE NEWS; Plan your trades and trade your plan.
5Drawdowns are partof the game
6 Risk management and money mangement is King!
7 wHATEVER HAPPENS;sTICK TO YOUR PLAN!
8 In a bear market no price is weak enough
9 In a bull market no price is strong enough
10 Patience !Wait for confirmation: Control emotions and tensions.
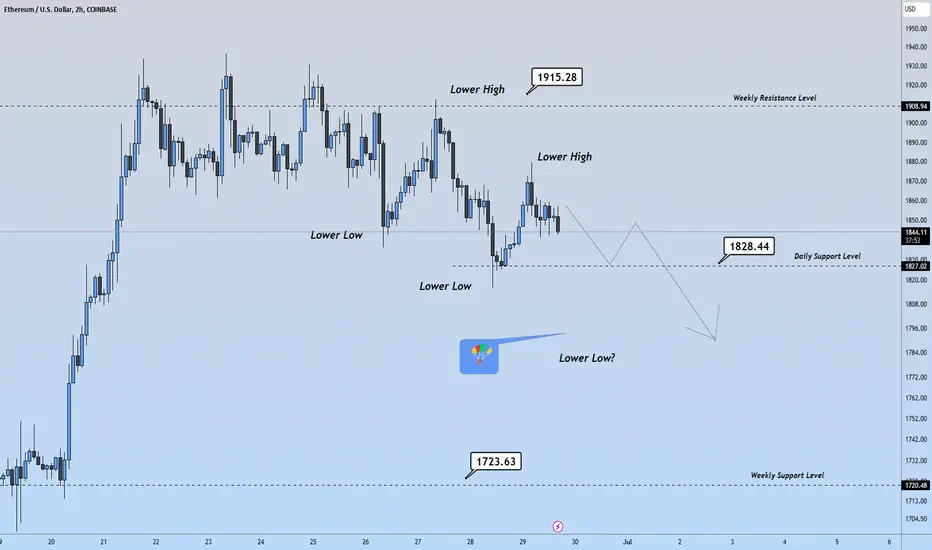
27.5$ Top Wick and 25$ Candle Body 🫣 -> Rejection of HighsEthereum is Creating Lowr Lows and Lower Highs as it descends away from our Weekly Supply level $1,915. Price ran into th Weekly Supply level last wednesday and ever since then we have been unable to identify a push to create a Higher high on the Intraday timeframes. Instead price is retracing and it appears to be stepping down stairs in a calculated fashion. As the Monthly candle comes to a close price, we will be able to identify a bearish candle if price closes below $1,873. Price would have to increase +1.6% from the current price to end Break even on the month. If the Monthly candle closes bearish then Bears have established a Resistance. We may then anticipate further downside to fill at least part of the previous monthly candle's bottom wick with momentum carried over. This is the idea behind this Short publishing.
First TP $1,828 Daily Support Level
2nd TP $1,800 Psychological Level
3rd TP $1,723$ Weekly Support Level
Monthly timeframe Outlook : Idea is that we will go to fill at least part of this month's bottom wick with momentum carried over to the next monthly candle
Ethereum Short at the Lows 🏴 (More Risky) / Momentum ↘️This Short Idea begins at a 1Hr Support Zone & let me explain my thoughts. The Idea for the trade stems from the fact that the Weekly candle is Bearish. Daily candle is bearish. 4Hr Market Structure is bearish and descending away from our Weekly Supply level at $1,915 ( Published in a previous idea). We are shorting the breakout to the downside in anticipation that the Daily candle will continue to pull down into the close of the candle in 5 Hours. We have clean candles to the left /clean traffic on the 1Hr timeframe down to $1,816. 2 Ways to approach this. 1) Short at the lows anticipating volume to come into the market as we transition into the new daily candle. 2) Wait for a pullback to what was our Daily support level and may now because a Resistance level at $1,860$.

Ethereum Only bullish to re-test a prior HighAfter the daily close of yesterday, it became apparent that this pair isn't in much favor of an uptrend. I believe that this is an indecision retracement, price has already been rejected at the weekly resistance and 62% fib. It's formed it higher low and now its looking to either push for new highs or begin new lows again. This is a daily setup being monitored on the 4H.

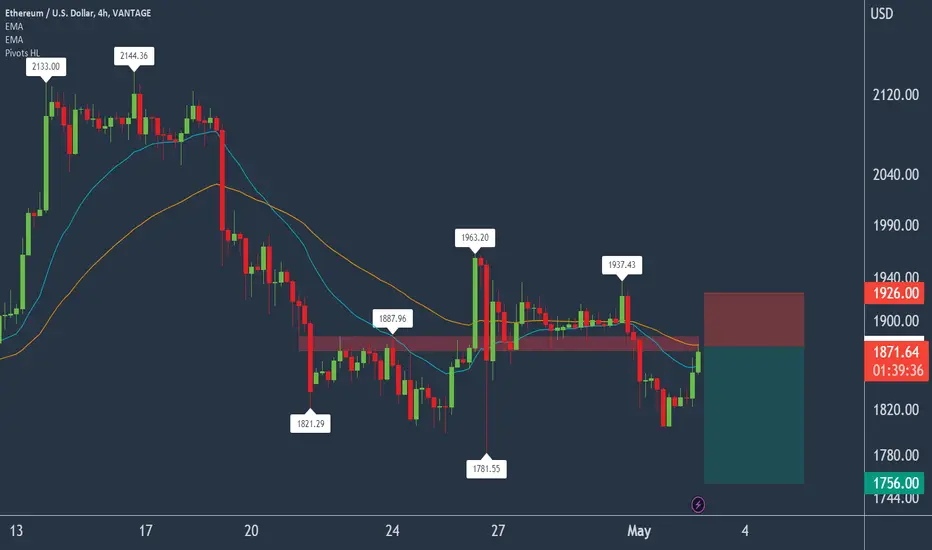
Selling Ethereum at current resistance.Ethereum - 24h expiry - We look to Sell at 1829 (stop at 1879)
We look to trade the current range. Bespoke resistance is located at 1830.
1830 continues to hold back the bulls.
The preferred trade is to sell into rallies.
Our short-term bias remains negative.
Our profit targets will be 1709 and 1689
Resistance: 1810 / 1830 / 1850
Support: 1790 / 1770 / 1755
Please be advised that the information presented on TradingView is provided to Vantage (‘Vantage Global Limited’, ‘we’) by a third-party provider (‘Signal Centre’). Please be reminded that you are solely responsible for the trading decisions on your account. There is a very high degree of risk involved in trading. Any information and/or content is intended entirely for research, educational and informational purposes only and does not constitute investment or consultation advice or investment strategy. The information is not tailored to the investment needs of any specific person and therefore does not involve a consideration of any of the investment objectives, financial situation or needs of any viewer that may receive it. Kindly also note that past performance is not a reliable indicator of future results. Actual results may differ materially from those anticipated in forward-looking or past performance statements. We assume no liability as to the accuracy or completeness of any of the information and/or content provided herein and the Company cannot be held responsible for any omission, mistake nor for any loss or damage including without limitation to any loss of profit which may arise from reliance on any information supplied by Signal Centre.
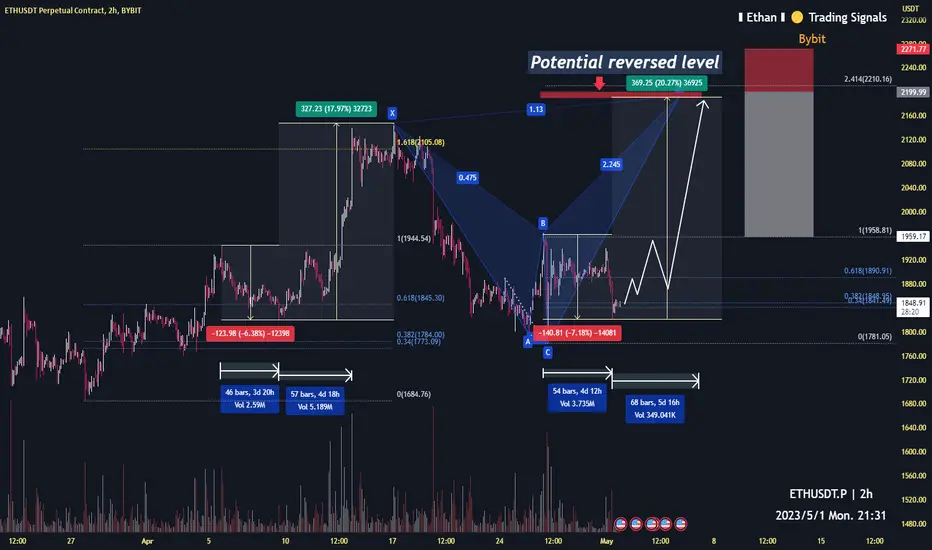
Ethereum highest price in this bear4h time frame
-
We see a potential harmonic structure(shark pattern) on 4h time frame.
The potential reversed point is around 2195
Plus, if measre the price pumped range from the wedge structure, we can also have the same price around 2195
We might see Ethereum reach 2195 soon, and do not be FOMO there.
Stay prepared to open short!

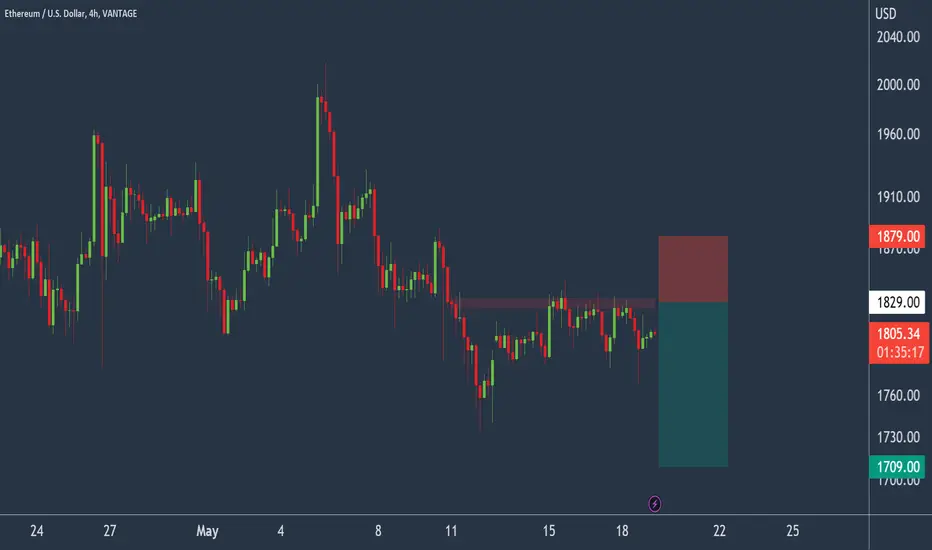
Will Ethereum find sellers at market?Ethereum - 24h expiry - We look to Sell at 1876 (stop at 1926)
Previous resistance located at 1880.
Previous support at 1870 now becomes resistance.
Short term bias has turned negative.
Preferred trade is to sell into rallies.
We look for a temporary move higher.
Our profit targets will be 1756 and 1736
Resistance: 1830 / 1850 / 1880
Support: 1820 / 1805 / 1785
Please be advised that the information presented on TradingView is provided to Vantage (‘Vantage Global Limited’, ‘we’) by a third-party provider (‘Signal Centre’). Please be reminded that you are solely responsible for the trading decisions on your account. There is a very high degree of risk involved in trading. Any information and/or content is intended entirely for research, educational and informational purposes only and does not constitute investment or consultation advice or investment strategy. The information is not tailored to the investment needs of any specific person and therefore does not involve a consideration of any of the investment objectives, financial situation or needs of any viewer that may receive it. Kindly also note that past performance is not a reliable indicator of future results. Actual results may differ materially from those anticipated in forward-looking or past performance statements. We assume no liability as to the accuracy or completeness of any of the information and/or content provided herein and the Company cannot be held responsible for any omission, mistake nor for any loss or damage including without limitation to any loss of profit which may arise from reliance on any information supplied by Signal Centre.
Ethereum potential reversed price is 22002h time frame
-
Refer to the previous structure from Mar 27 to April 17
We can easily predict the next trend of ETH
Still have the potential to create harmonic pattern in near future.
With this analysis, timing to open short will be around 2200
Get ready for it!