ETHUSD today analysis, 190924. Much worse than expected.Hello my friends. It's Cryptoranger K.
Few hours before this article, the price of ETH dropped momentarily to $182 and then rose. I saw this and accepted that the future drop would be at least $182. If you look at today's spot, below is the intersection of the 20-day and 50-day lines. This is the support of the candle today. Also up there is the intersection of the 5 and 10 day lines. This is the resistance of the candle today. I expected today if the candle touches the resistance above and falls back, the end of the drop would be near $190. But in the length of yesterday's candle and today's candle, I think the strength of this drop is getting bigger and bigger. So I thought the end of the drop could go below $190. As of today's chart, the MACD is showing its appearance before making a dead cross. If the daily MACD shows a dead cross, I think the drop could fall to $180 or mid-170.
Ethereumshort

ETHUSD today analysis, 190923. Rebound after fall to around $190Hello my friends. It's Crypto Ranger K.
First of all, fortunately, for the last few days, I think the price is flowing as I expected.
One thing that bothers me is that today's candle bottom is higher than yesterday's candle bottom.
I think there are three reasons for the weakening of the decline.
First of all, I think it's far from the 5day line due to a sharp drop in prices over the past few days.
The second reason is that the intersection of the 200-day line and the 10-day line acts as a support, and finally, the current position is the place where the trading volume is concentrated.
In fact, when I saw this part yesterday morning, I thought about the possibility that the price would rise from this point.
I still think there is some possibility.

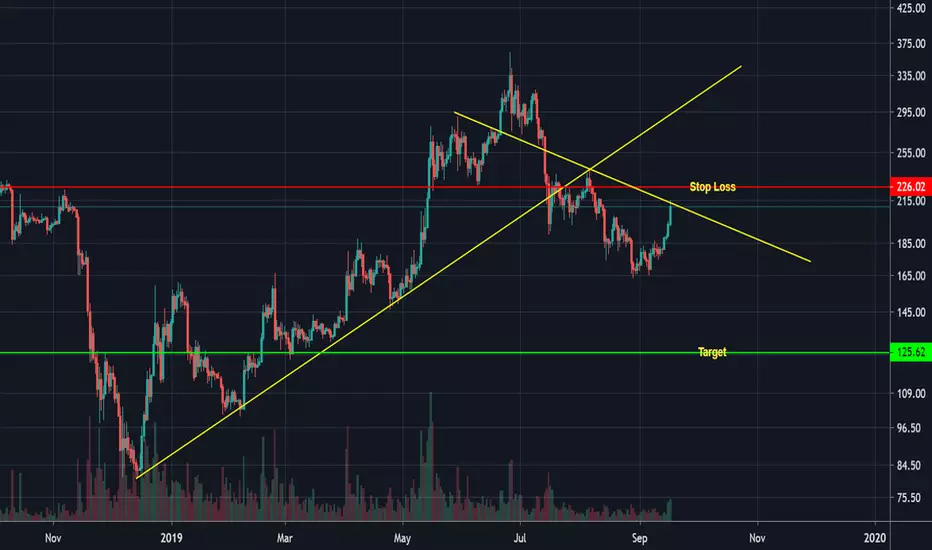
Short the hopium out of Ethereum?
Stop loss: $226
Target: $125
Please refer to my last idea as to how I can possibly be Bearish on Ether right now.
"but but but but bull ru..." "NO!"
Window closing for ETHUSD (SHORT) TP1 $190.18
TP2 $193.97
STOP @ $174.42
DISCLAIMER*
Not Financial Advise

SHORT ETHUSDI think bitcoin will rise. When bitcoin is elevated, altcoins drop due to bitcoin. So I think ETH drop to Fibonacci support.
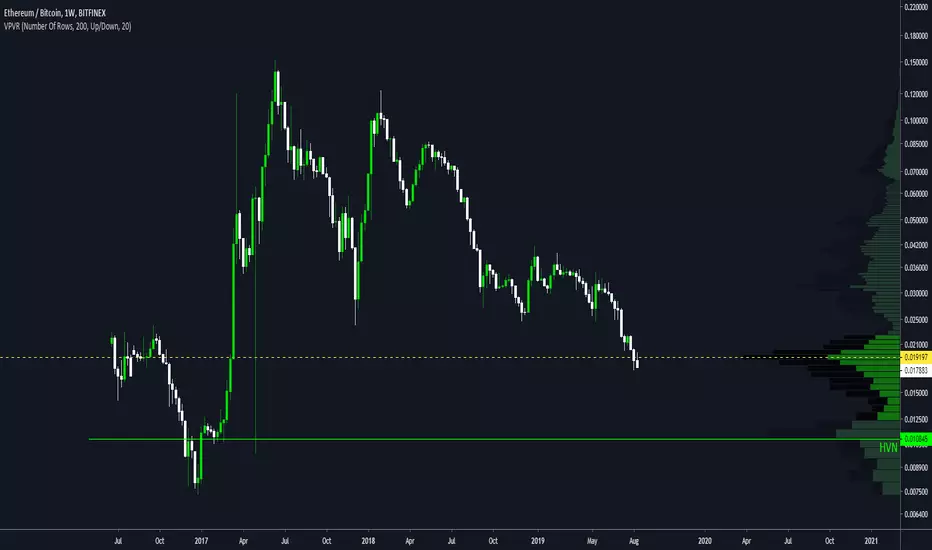
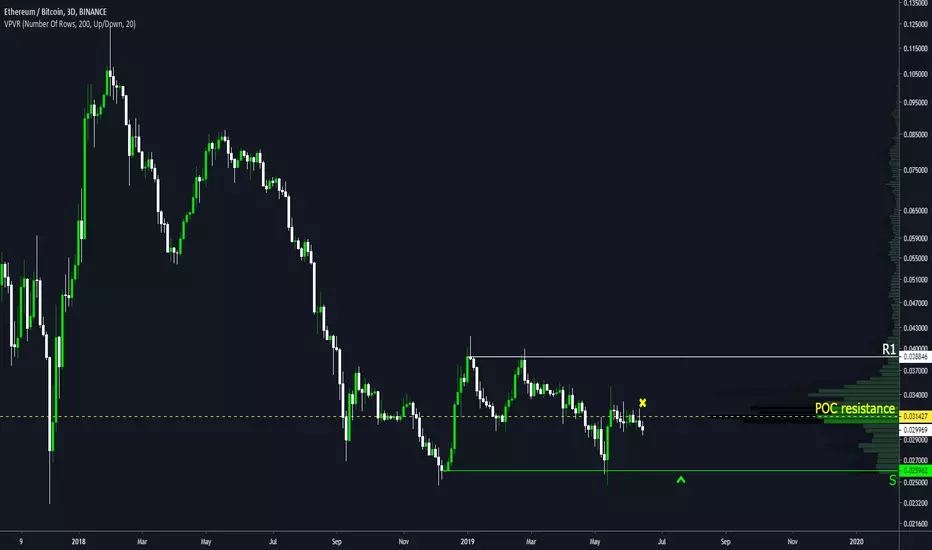
ETH BTC THOUGHTS$ETH - $BTC
Not looking good at all. If we lose the POC level that we're currently at, the next area I'd be interesting in longing is at 0.0108. Be careful.
we found it good to take action ether usd in bank level buy zone ,
hopefully reach our target soon
good luck

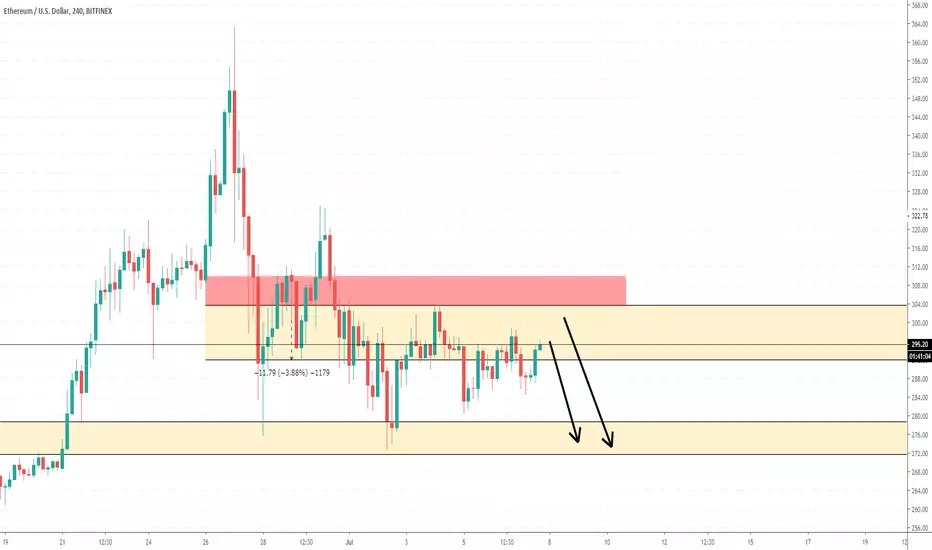
ETHUSD could possibly go this way!ETHUSD could possibly go this way!
Check out my FREE Telegram channel to receive instant NOTIFICATION.
Telegram: SamuelFelixClub
One of every 100 subscribers on my Telegram channel gets $100 credit. Don't miss it!

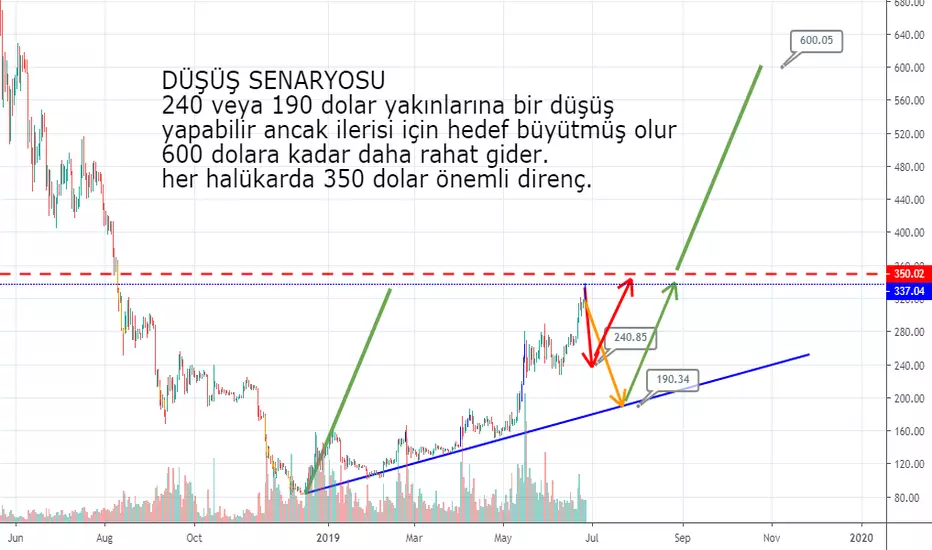
ETH/USDT (Binance) SHORT (Just for now)i think ethereum will make a C&H and im not totally sure if 240 $ or 190 $ but 190 $ makes sense. 2nd part of July is the time if we'll see 190 $.
next? to the Moon (respect Hekate)
Ethereum Short 1 HR Chart#Ethereum #Bitcoin #Litecoin #Crypto
Hello to all watching my charts.
Similar to other crypto ETHUSD Ethereum tries to find a bottoom now ,
but here the chart has been really damaged for long.
2 Big suppport aereas have been hit from ETHUSD at the range 275 - 277
and next stop down is 262.
What i also want to mention negativ is
that at the moment i write this here , Ethereum has been stopped the little up trend
exactly at the next resistance level from 17.6. ( BLUE RESISTANCE LINE)
For Long trendchange i think we do need a jump in the aerea of my
BLUE ARROW and make a new higher hgh (higher than high from yesterday in the minimum ).
Good trades
If you want to support my work and my charts, please like them
Renkotrade
ether still downtrend here is our view about ether bank levels i hope you enjoy and bank profit
good luck
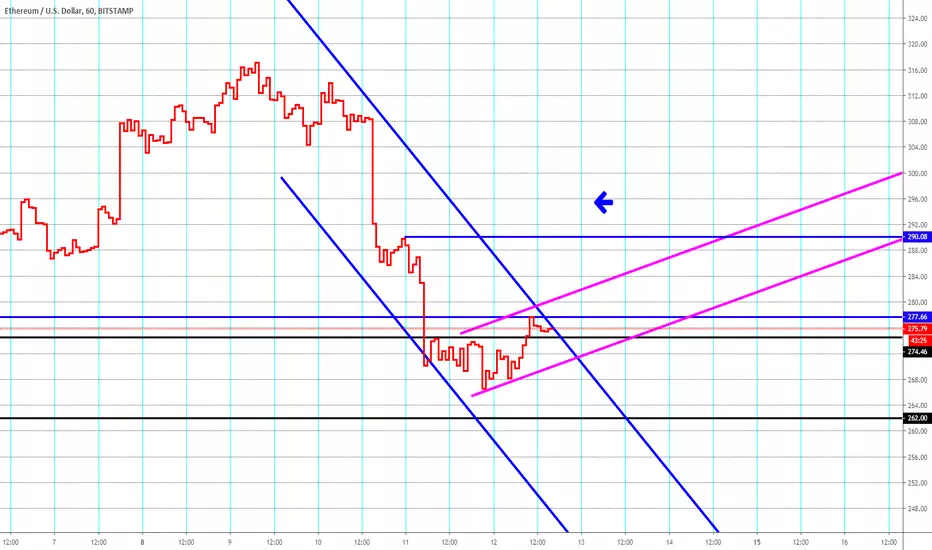
Ethereum SHORT 1 HR ChartHello to all watching my charts
Ethereum made similar to other cryptos now a big jump down
and is in recovering mode.
Recovering from my longgtime channel is fine
but to go back in a long , we have to wait in higher highs an higher lows.
The next high which is to beat is at 297
(my black line)
If the aerea of 298-299 will not reached , than its only
a recovery in the short trend (Blue lines)
What is for longs not so fine is, that my shorttime channel
system (purple lines) are so much weaker and tell us so clear
a short mode.
For long change:
First is to trade at 300 (my lower blue arrow)
Than to jump above the resistance of 302 (higher black line)
Than trade in the aerea of 305-306 , this would restart
my long scenario.
All other trades are short in my eyes at the moment.
Good trades
If you want to support my work and my charts, please like them..
Renkotrade

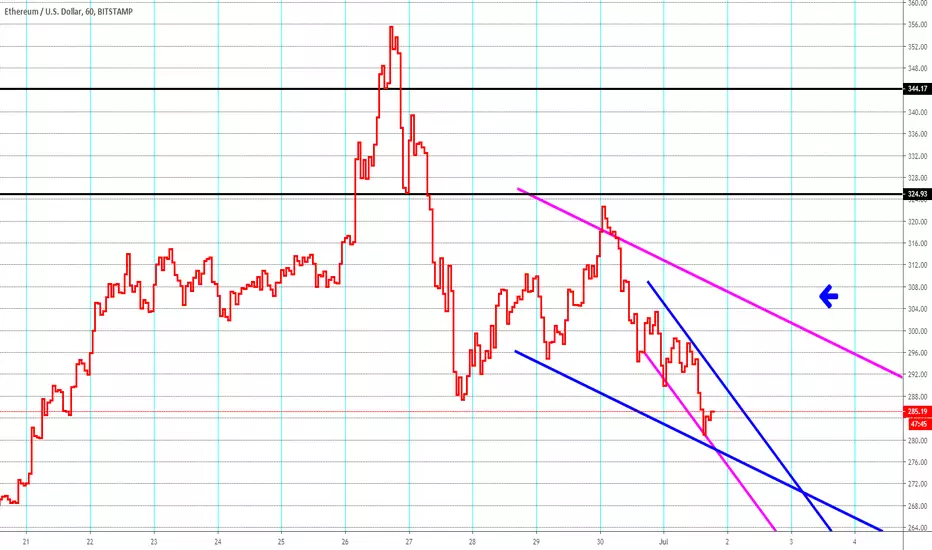
ETHEREUM SHORT ETHUSD SHORT 1 HR Chart#Renkotrade
Hello to all watching my charts.
Ethereum is now similar to Bitcoin on the way down
Short, short, short as my eye is able to see..
My longtime channelsystem is short , my shorttime channelsystem is short
and my really longlongtime channel which checked 7 days is also short
but i have leave that her byside to dont overfill the chart.
Dor my visitor which want to have an advice for a tendchnage
i have add my ARROW System for a long run
but i dont see any chance at the moment !!
for ETHUSD to come to that range in 2 days.
So as in Bitcoin i do hope you are short or have sold
your Ethereum at around 324 as 2 supports had had been broken
(black lines)
Good trades
If you want to support my work and my charts, please be so kind and like them...
Renkotrade
ETHUSD Forecast SHORT 1 HR ChartHello to all watching my charts
Here in Ethereum we do see similar situation as in Bitcoin BUT !!
this pair ETHUSD is much weaker than BTCUSD, broke all supports !! and is now
in a Longchannel but only included in my bigger and longer and stronger
Shortchannel system
So only if the pair reach my "ARROW POINT" and comes totally out of the
shortchannel we can think of going long again.
But as so much supports have been brokesn
i wold be very very couations with longs here in that pair.
Resistance of 315 also in Front against the Longs...
Good trades
If you want to support my work and my charts, please be ko kind and liem the
Renkotrade

ETH BTC SHORT$ETH $BTC
If it can't reclaim the POC as support, and $BTC ends up breaking upwards even further (10K mania), I think it's reasonable to think we could test the bottom of the range again at green.
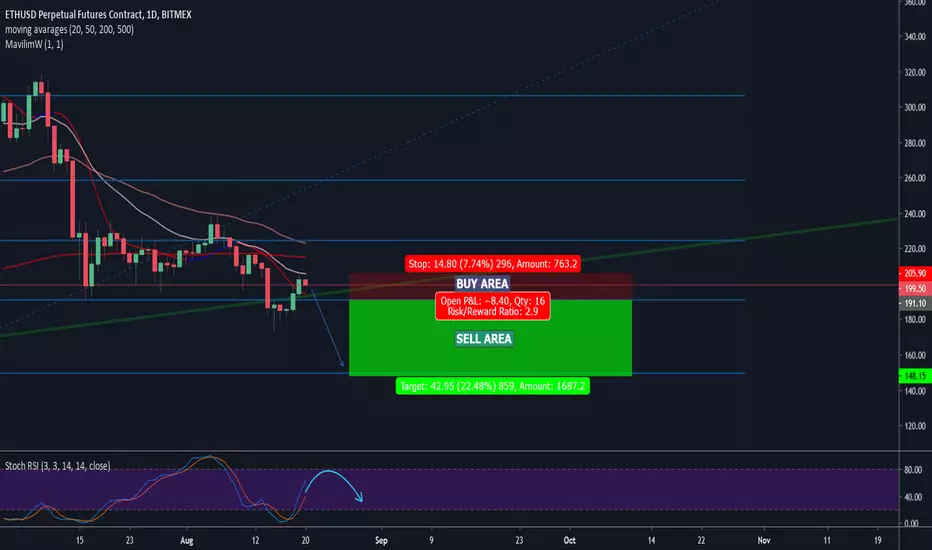
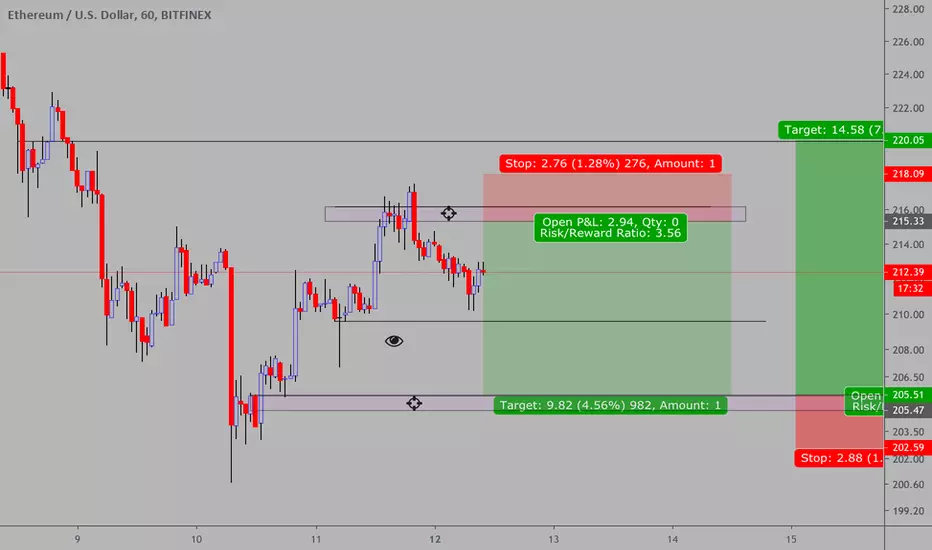
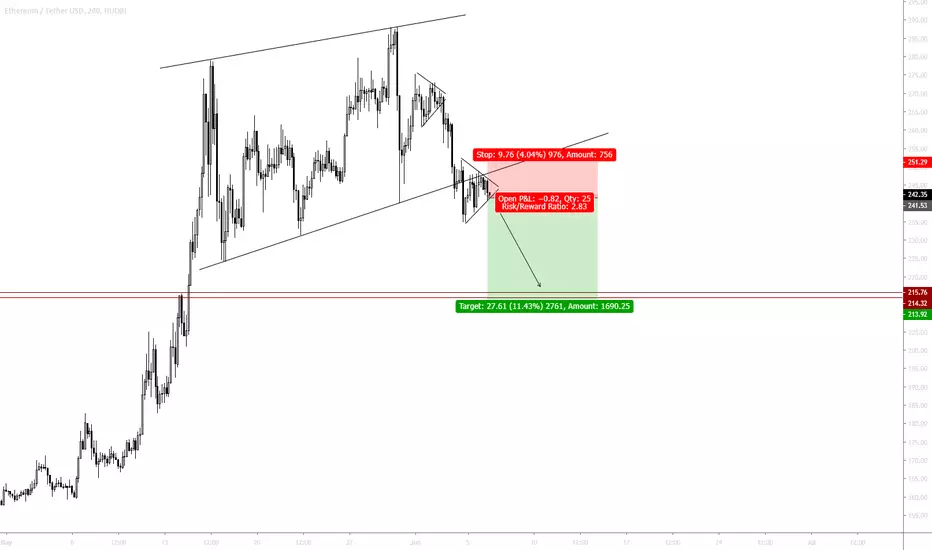
ETH SHORT ( ETH / USDT)ENTERY : 242.50
PROFIT TARGET : 214.5
(With profit trailing 3%)
STOP LOSS : 251
Ethereum Primed For Its Deadliest Fall In MonthsEthereum is primed for its deadliest fall in months as all key indicators point to extremely bearish outlook. The weekly chart for ETH/USD shows a strong bearish divergence on the RSI that confirms. The trend line resistance shown on the RSI has been rejected and the RSI is expected to fall further in the days and weeks ahead. Similarly, the price has faced a strong rejection near the Ichimoku cloud on the weekly chart and is now ready to fall towards the bottom of the ascending channel it is trading in. Interestingly, this ascending channel forms part of a large bear flag that could see the price fall lower than our previously stated target of $60 per coin by the end of the year. Recently, over $7 million worth of Ethereum were hacked and transferred to an unknown wallet. At this point, Ethereum is not short of catalysts that could push the price off a cliff.
Full Analysis: cryptodaily.co.uk

ETHEUR first the price fall then BULLMARKETIn my opinion we will test the resistance again and then we will drop to 130 - 135 €.
Finally, we will break through the resistance and aim for 187€.

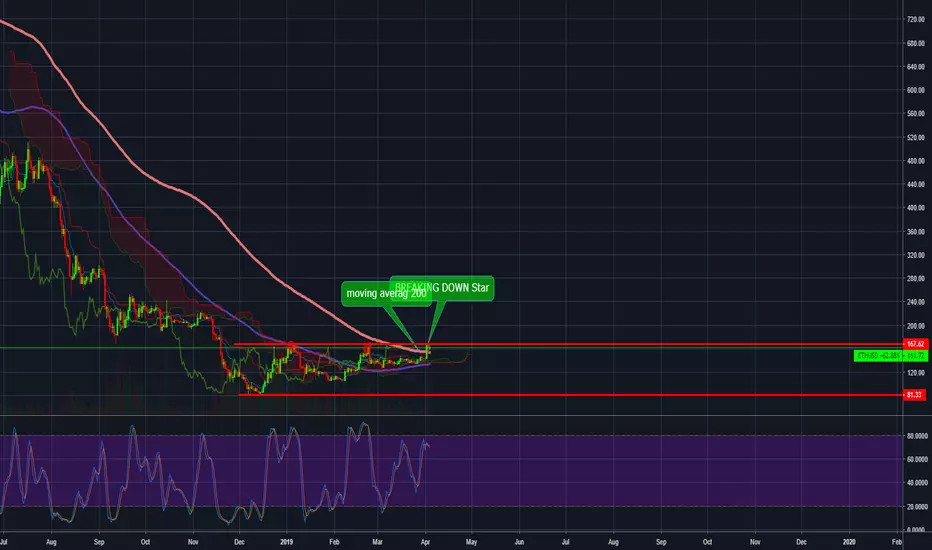
#Ethereum Next step!In this review, I would like to talk about some important things that can be seen in the Ethereum graph above.
Let's start from the beginning - I added 2 red lines that show solid support in the 81.33 area and resistance in the 167.60 area, that these words are written we are still within this range.
2 The red circles are located in two places where the Ethereum tried to break the resistance without success.
Yesterday we had another attempt to break the Ethereum price resistance that succeeded for a while and then became Star Candlestick, the definition of this candle is-"Small-bodied candles in the star position often suggest that market participants are becoming indecisive and that the strength of the current trend could be reversing" (according to Investopedia).
After analyzing all of the parameters mentioned above we recommend a sell signal as long as the Ether does not break the resistance.
Sell Ethereum:
Entry price: 161.30
Take profit: 102
Stop loss:180
Ethereum Shorta little late, but from here...
Entry at 135.50
Target at 127.17
Stop at 139.58
this gives a 2:1 risk:reward
can also use the 137 as a stop as the rejection on the 100MA was there... but there is always the risk of getting arthur'd anywhere.
-Travis
JMJ - UIOGD

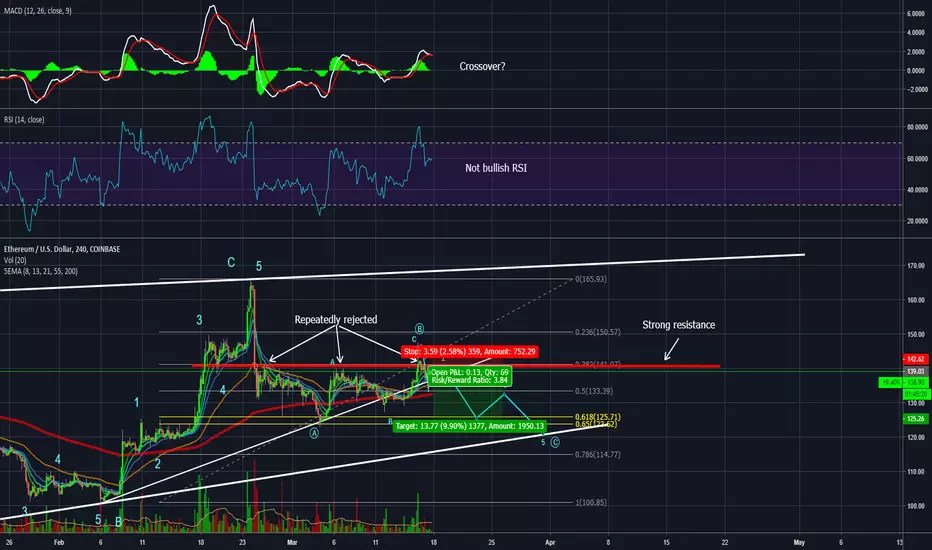
ETH - That resistance is just too strong B wave probably formed. That resistance is simply too strong. I can't see breaking that resistance in near future. Bitcoin also looks bearish. MACD doesn't looks bullish at all, RSI also.
Let's see how we can play this resistance on ETH. In case that I'am wrong i will put stop loss just little above that super resistance. My first target is Golden pocket (0.618 - 0.65 Fib), you can also play that major support where i think C wave will be formed.If you have any questions you can DM me. If you like my trade and analysis make sure you hit that like and follow button. Thanks!