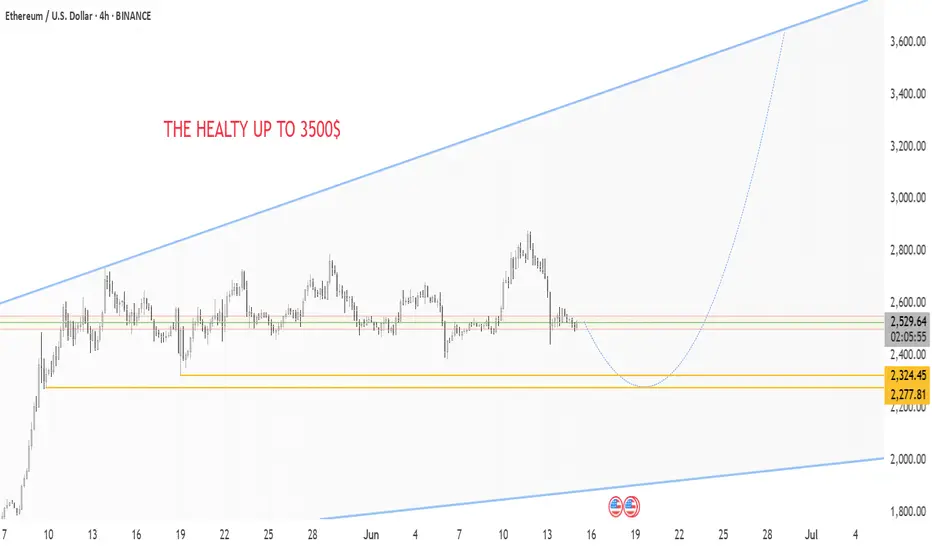
ETH/USD: The Great Ethereum Bounce is HERE!🚀 THE MOON MISSION (Resistance Zone)
HEALTY TARGET: $3,500 - Your text says it all!
Upper Trendline: Acting as launch pad
Psychological Resistance: $3,000 round number
🟢 CURRENT LAUNCH PAD
Price: $2,529.15 - Breaking above key resistance
Previous Resistance: $2,324.45 - Now turned support
Support Zone: $2,277.81 - Strong foundation
🔴 DANGER ZONE (Abort Mission)
Critical Support: Lower trendline around $2,000
Major Support: $2,277.81 level must hold
💡BUY ZONE: $2,100 - $2,180 🎯
⚠️STOP LOSS: $1999 (Previous resistance) ⚠️
TAKE PROFIT 1: $2,650 (Take 50% profits) 🔥
TAKE PROFIT 2: $3,300 (Let winners run!) 🔥
Etherum
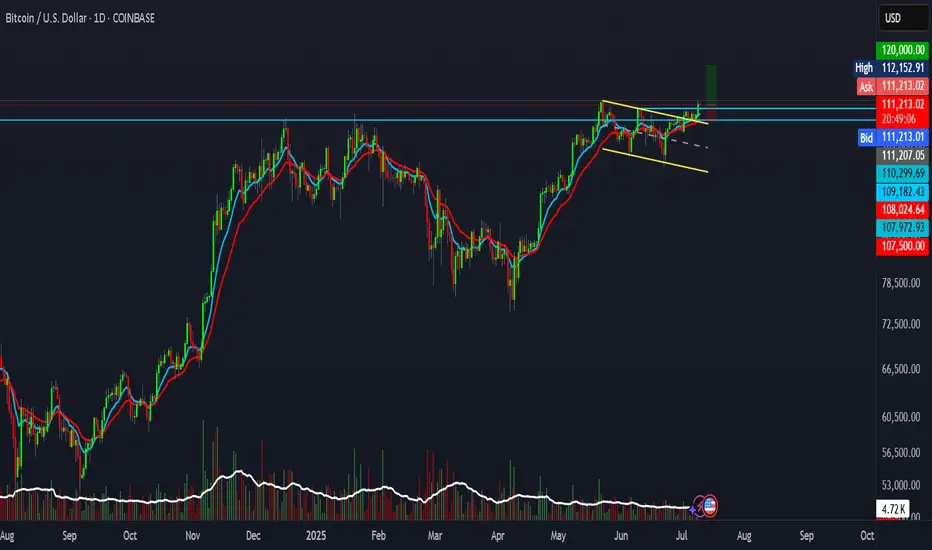
BTC setup with 2R R:R.BTC is showing signs of a real breakout.
This setup offers a 2:1 risk-reward ratio.
Entry: 111,207
Stop Loss: 107,500
Target: 120,000
Not financial advice.
ETH/USDT Price Action Analysis — Bullish Continuation Expected 📊 ETH/USDT Price Action Analysis — Bullish Continuation Expected 🚀
🔍 Chart Overview (as of June 9, 2025):
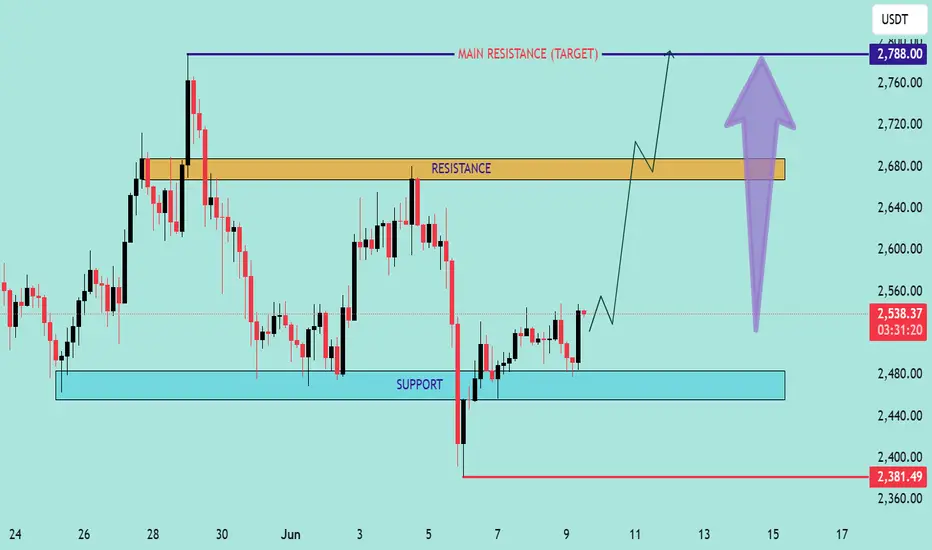
This chart of ETH/USDT highlights a well-defined support and resistance structure, projecting a potential bullish move toward a main resistance target at $2,788.00.
🧱 Key Zones:
🔵 Support Zone: $2,440 – $2,480
Price rebounded strongly from this area, showing buyer interest and liquidity absorption.
🟠 Resistance Zone: $2,660 – $2,690
Previously rejected zone where supply overtook demand. Price must break and hold above this for further upside.
🔺 Main Resistance Target: $2,788.00
If resistance is cleared, this is the next major supply area, acting as a potential take-profit level.
📈 Price Action Insight:
Price is currently hovering near $2,538.37, approaching resistance.
The chart suggests a potential breakout scenario after a short consolidation.
A bullish breakout above $2,690 could trigger a sharp rally toward the $2,788 target.
The chart projects a pullback-retest pattern (break, retest, and continuation) before the final leg up.
⚠️ Risk Management:
Invalidation Level: $2,381.49
A break below this level would invalidate the bullish setup and could lead to further downside.
✅ Summary:
Bias: Bullish 📈
Entry Area: Break and retest above resistance zone ($2,660–2,690) 🔓
Target: $2,788 🎯
Invalidation: Below $2,381.49 🚫
📌 Note: Always use proper risk management and confirm breakouts with volume or momentum indicators (e.g., RSI, MACD).
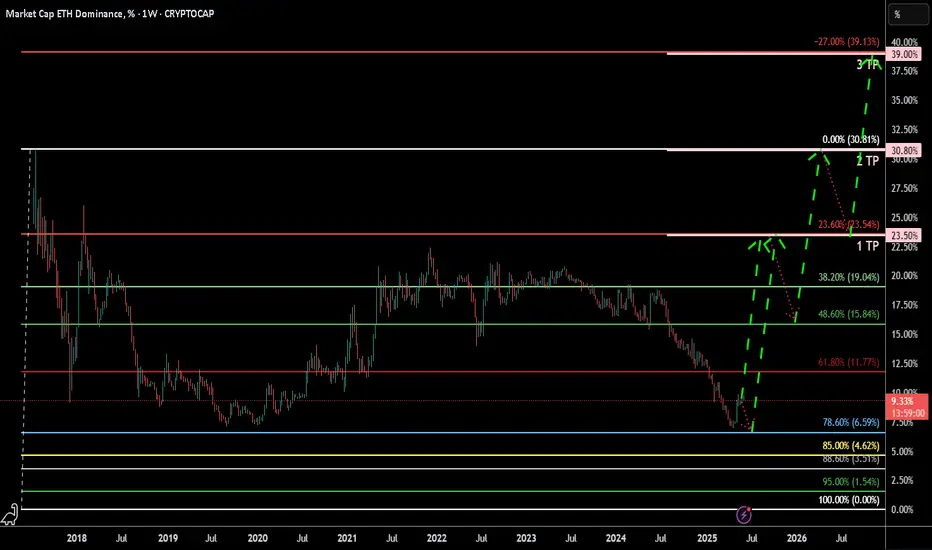
ETH.D (Ethereum Dominance) Weekly TF 2025
Summary:
Ethereum Dominance (ETH.D) has likely bottomed after retracing to its 78.6% Fibonacci level (~6.59%) and is showing early signs of a structural reversal. With institutional inflows, growing staking adoption, and key upcoming Ethereum upgrades, ETH.D may reclaim significant market dominance over the next 12–18 months. Our chart anticipates a bounce-pullback-rebound structure, aiming for 3 target zones: TP1 (23.5%), TP2 (30.8%), and TP3 (39%).
Contextual Market Alignment:
This ETH.D bullish bias aligns strongly with our broader market outlook:
TOTAL Market Cap Analysis → Bullish breakout structure, indicating overall crypto expansion.
TOTAL2 (Altcoin Market Cap Ex-BTC) → Bullish retracement completion and extension targets active.
BTC.D (Bitcoin Dominance) → Bearish confluence zone, suggesting Bitcoin may underperform versus ETH and altcoins, freeing up dominance space for ETH.D to rise.
Chart Context:
This weekly ETH.D chart uses a Fibonacci retracement from the top (~30.81%) to bottom (0%) to identify potential reversal zones. The dominance hit a key support area at the 78.6% Fib retracement (6.59%), showing a reaction that may develop into a reversal. The roadmap includes:
Rebound toward TP1 (23.54% = 23.5%)
Minor correction or consolidation
Breakout continuation toward TP2 (0.0% = 30.8%)
Extension leg targeting TP3 (–27% = 39%)
Key Technical Observations:
Support Levels:
78.60% = 6.59% (bottom support)
88.60%=3.5%
Possible Resistances:
61.80% = 11.77%
48.60% = 15.84%
38.20% = 19.04%
Resistance & TPs:
TP1: 23.54% (23.6% Fib)
TP2: 30.81% (Full retrace = 0%)
TP3: 39.13% (–27% extension)
Current level: ~9.36%
Clear bullish structure with a “bounce–pullback–rebound” sequence
Indicators:
Fibonacci retracements from ~30.81% to 0%
Structural pattern: rounded bottom / double bottom
Hidden bullish divergence forming on weekly timeframe
Fundamental Context:
Institutional Inflows & ETF Dynamics:
Since July 2024’s launch of spot Ether ETFs, inflows have been strong with a 15-day streak totaling approximately $837 million (~25% of total net inflows).
Recently, the SEC approved options trading on spot ETH ETFs (e.g., BlackRock, Grayscale), deepening liquidity and offering hedging mechanisms.
BlackRock is now pushing to add staking functionality allowing yield generation within an ETF wrapper. If approved, this could markedly increase demand.
Staking Growth & On-Chain Supply Dynamics:
27% of ETH is already staked, and ETF inflows could lift that by >10%.
A staking ETF would institutionalize ETH staking: more capital locked, less circulating supply → supply constraints could support dominance and valuation.
Ethereum Backbone in DeFi & RWA:
Ethereum still leads the Real-World Asset (RWA) space: over 50% market share and ~$5–6 billion in assets tokenized on-chain.
Its core infrastructure underlies the majority of DeFi, smart contracts, and stablecoins, reinforcing ETH.D’s structural resilience.
Network Upgrades & Tech Progress:
The Pectra upgrade (mid-2025) is on the horizon, introducing EIP-7251/7702, improving validator flexibility and network usability.
Combined with recent Dencun improvements, Ethereum is becoming cheaper and more efficient, boosting adoption in L2 ecosystems.
Price action & on-chain indicators:
ETH price has surged ~46% in the past 30 days, driven by ETF demand; some analyst forecasts target $3,000–5,000 year-end.
The withdrawal of ~$1.2 billion ETH from exchanges suggests increasing long-term holdings and less selling pressure.
Integrating with Your Technical Setup:
Level: 78.6%–61.8% bounce zones (6–11%)
Fundamental Support: Institutional re-entry via ETFs often begins with accumulation near support.
Level: TP1 at 23.6% (23.5%)
Fundamental Support: Could coincide with ETF inflows + early vesting of staking narratives.
Level: TP2 (~30.8%)
Fundamental Support: Full retrace driven by mass ETF adoption, options trading, and upgrade momentum.
Level: TP3 >39% (–27% ext.)
Fundamental Support: If staking ETF and yield-bearing structures go live, ETH.D could reach new dominance highs.
Summary of Fundamental Catalysts:
Spot ETH ETF inflows (~$800 M), with options exposure adding liquidity.
Upcoming staking ETF (BlackRock, Grayscale) with >10% locked-up supply implications.
Ethereum remains the DeFi and RWA backbone, sustaining structural demand.
Protocol upgrades (Pectra, Dencun) enhance scalability and adoption.
On-chain withdrawal trends show growing holder conviction.
Narrative / Bias & Strategy Implication:
ETH.D has likely completed its correction and is primed for a staged bullish reversal, mirroring prior cycles. The chart forecasts a rally toward TP1, where some short-term profit-taking and rotation to alts may occur (Alts season). Following that, a retrace may set up the next impulsive move to reclaim lost dominance and eventually challenge prior highs.
Time Horizon: Mid-2025 to late 2026
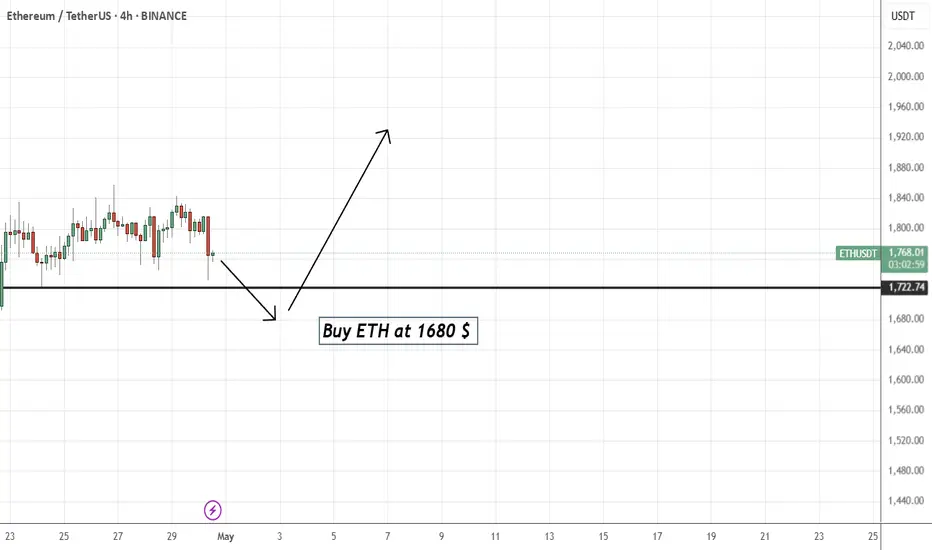
Ethereum TA 25.4.5Hello everyone, I hope you are doing well. Ethereum on the 4-hour timeframe got rejected after hitting a strong order block and started forming new lows. Given the current chart conditions, we have two order blocks in the high price area and we expect the price to return to these levels. If we see a short setup, we will enter a short position with a target of 1750. For now, I am not suggesting a long position and will wait until the pullback on the chart is complete.
⚠️ This Analysis will be updated ...
👤 Sadegh Ahmadi: GPTradersHub
📅 25.Apr.5
⚠️(DYOR)
❤️ If you apperciate my work , Please like and comment , It Keeps me motivated to do better

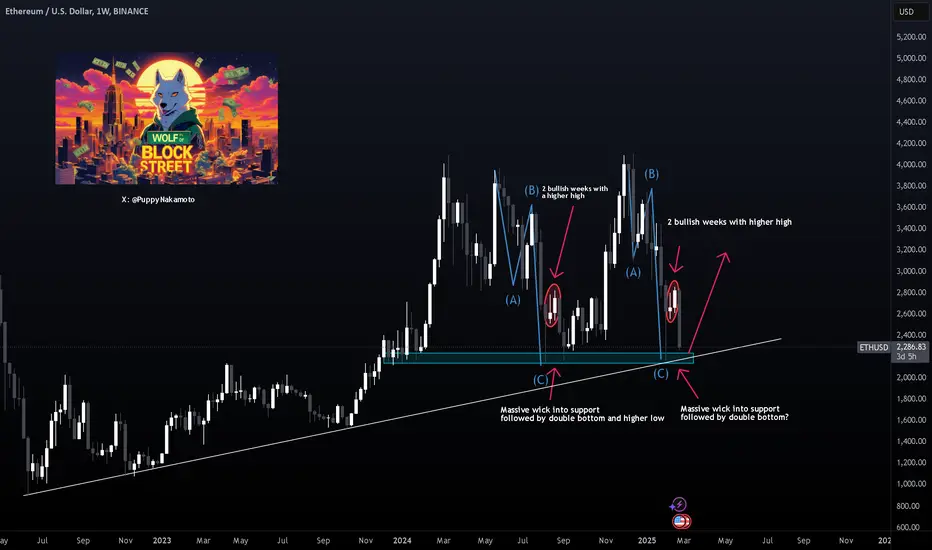
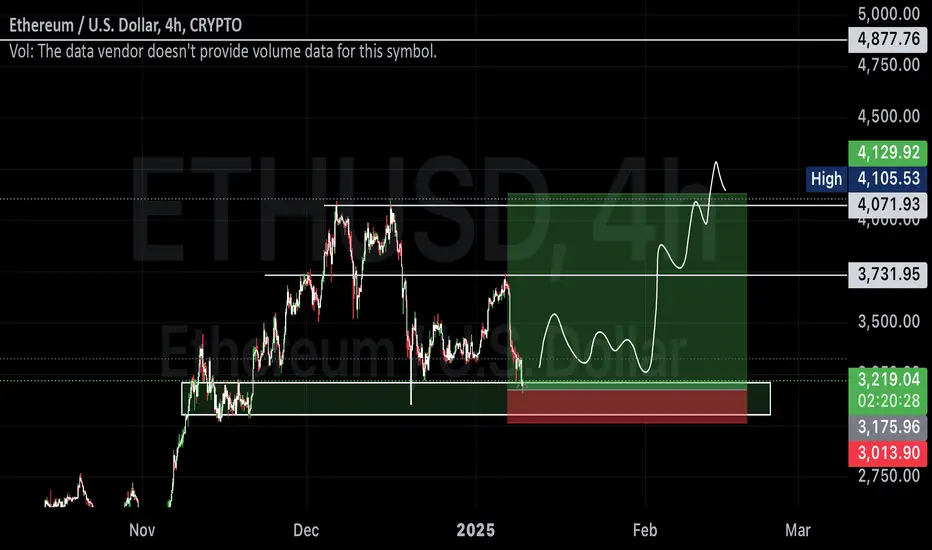
ETH/USD - Technicals and Fear Index Point to Upside!Welcome to another Wolf of Blockstreet analysis where I take a look on ETH/USD!
On the weekly timeframe, we can observe a significant market structure since the last low in September 2024. ETH in 2024 underwent an ABC correction into a strong support zone, followed by a massive wick up. This was followed by two bullish weeks, establishing a higher high, and then a wick fill down that set up a double bottom pattern.
This could be happening again. Additionally, we see a long-term support trendline in play here, reinforcing the bullish setup.
At the same time, the Fear and Greed Index is at a historically low level, signaling extreme fear in the market. As of February 27, 2025, the index stands at 10, which is even lower than the fear levels seen during the FTX crash in November 2022.
Historically, extreme fear in the market has often represented one of the best times to buy, as it tends to be followed by a recovery and upward movement in prices. The double bottom pattern on ETH/USD, combined with the extreme fear indicated by the Fear and Greed Index, could signal a potential reversal to the upside.
My key area to look for long-term buying opportunities lies in the $2000-$2200 range. This zone provides strong support and could serve as an ideal entry point for those looking to accumulate ETH for the long run. However, this idea would become invalid if we see a weekly candle close below this range, indicating a potential shift in market dynamics.
While both the technical analysis and market sentiment suggest a bullish reversal could be on the horizon, we need to see confirmation here and the cryptocurrency market remains highly volatile. Investors should conduct thorough research and be aware of the inherent risks before making any trading decisions.
For more updates you can follow me on X: @PuppyNakamoto
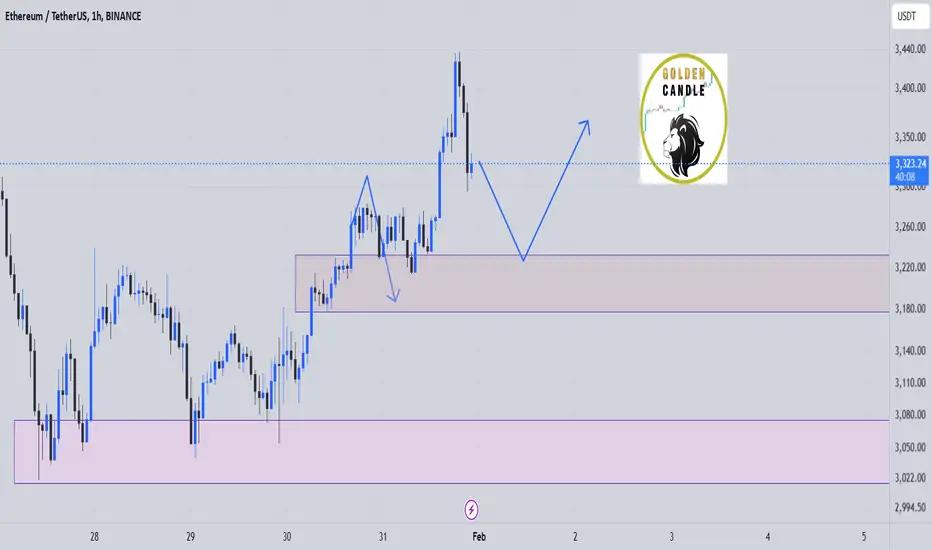
Ethereum (ETH/USDT) Breakout Incoming? Eyeing $4,000 TargetEthereum (ETH/USDT) 4H Analysis: Breakout Toward $4,000?
Key Observations:
1. Potential Double Bottom Formation:
ETH appears to be forming a double bottom near the $3,000 support level, indicating a potential bullish reversal.
2. 200 EMA Resistance:
The 200 EMA ($3,324) is acting as resistance. A clear breakout above this level could confirm bullish momentum.
3. RSI Indicates Momentum Shift:
The Relative Strength Index (RSI) is at 56.85, trending upward, suggesting increasing buying pressure but not yet overbought.
4. Potential Scenarios:
Bullish Breakout: If ETH breaks and holds above $3,324, the next target could be around $4,000.
Rejection & Retest: If ETH faces rejection at $3,324, it may retest $3,000 before another attempt higher.
Conclusion:
ETH is showing bullish potential, especially if it clears $3,324 resistance.
A confirmed breakout could trigger a strong rally toward $3,800-$4,000.
Traders should watch for volume confirmation to validate the move.

eth midterm buy"🌟 Welcome to Golden Candle! 🌟
We're a team of 📈 passionate traders 📉 who love sharing our 🔍 technical analysis insights 🔎 with the TradingView community. 🌎
Our goal is to provide 💡 valuable perspectives 💡 on market trends and patterns, but 🚫 please note that our analyses are not intended as buy or sell recommendations. 🚫
Instead, they reflect our own 💭 personal attitudes and thoughts. 💭
Follow along and 📚 learn 📚 from our analyses! 📊💡"
ETH ReaccumulationThe market has put in a bear trap this week inside of a reaccumulation pattern. Get ready for a boom over the next few months.
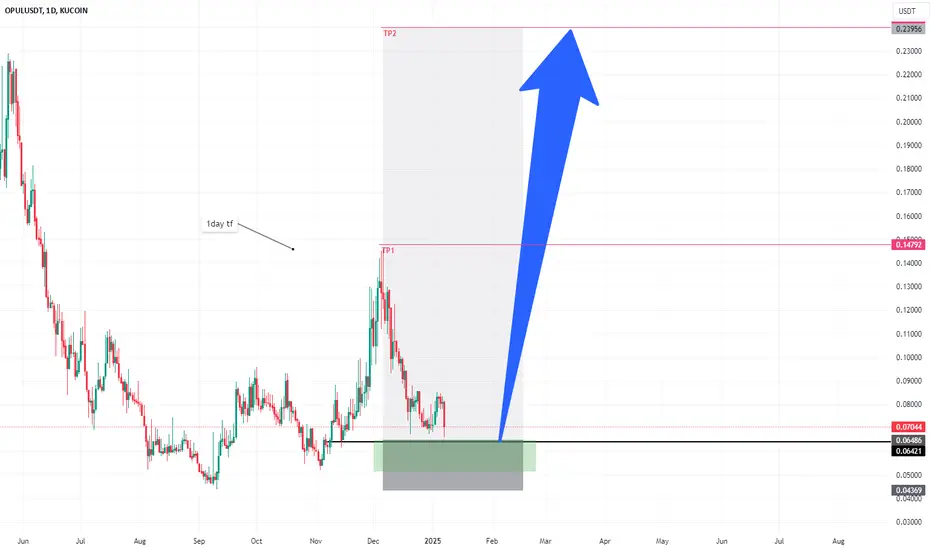
Opulous ($OPULUSDT): Awaiting Entry for 100% + Upside in MusicFiI spend time researching and finding the best entries and setups, so make sure to boost and follow for more.
**Opulous ( KUCOIN:OPULUSDT ): Awaiting Entry for Promising Upside in MusicFi**
Trade Setup:
- Entry Price: $0.06486 (Pending Activation)
- Stop-Loss: $0.04369
- **Take-Profit Targets:**
- **TP1:** $0.14686
- **TP2:** $0.24000
**Current Price:** $0.07048
Fundamental Analysis:
Opulous ( KUCOIN:OPULUSDT ) is leading the way in MusicFi by merging decentralized finance (DeFi) with the music industry. Through its platform, artists can mint music as NFTs, allowing fans to directly invest in their music and share in royalty streams. This revolutionary approach is disrupting traditional music rights management and has garnered significant attention from artists and investors alike.
Recent developments, such as new artist partnerships and an increase in platform adoption, underscore Opulous’s potential to drive innovation in the blockchain space.
Tokenomics Overview:
- **Total Supply:** 500 million tokens.
- **Utility:** Facilitates music NFT transactions, staking, and royalty payments.
- **Growth:** Rapid adoption within the MusicFi niche, attracting both artists and investors.
Technical Analysis (4-Hour Timeframe):
- Support Levels: $0.06500 is a strong support zone near the anticipated entry price, aligning with previous price consolidation levels.
- Resistance Levels: $0.07500 is the first key resistance, with further resistance at TP1 ($0.14686).
- Moving Averages:
- 20-EMA: $0.07000
- 50-EMA: $0.06700
- Relative Strength Index (RSI): Currently at 57, signaling neutral momentum, providing room for further upside.
Market Sentiment:
Interest in MusicFi continues to grow, with Opulous at the forefront of this trend. The unique proposition of allowing fans to invest in music royalties via NFTs is driving increased market interest. Community engagement remains strong, reflecting confidence in the project’s long-term potential.
Risk Management:
The stop-loss at $0.04369 provides protection against significant downside risk, while the take-profit targets offer excellent upside potential. TP1 represents a **126% return**, and TP2 offers a potential **270% gain**, making this trade highly attractive for mid- to long-term investors.
Key Takeaways:
- Opulous is uniquely positioned to capitalize on the growing MusicFi trend, blending blockchain with real-world applications in the music industry.
- Awaiting a pullback to $0.06486 for an optimal entry point into this promising setup.
- The trade offers a compelling risk-to-reward ratio, ideal for swing traders and long-term holders.
When the Market’s Call, We Stand Tall. Bull or Bear, We’ll Brave It All!
TradeCityPro | ETCUSDT Still Ranging in the Box!👋 Welcome to TradeCityPro Channel!
Let’s analyze Ethereum Classic during the market's holiday period, where we saw some movement. We’ll review the triggers together.
🌐 Overview Bitcoin
Before diving into today’s altcoin analysis, as usual, let’s check Bitcoin in the 1-hour timeframe. Bitcoin is still under a descending trendline. Once this is broken, it can move toward 98599, and after that, to 99443. It’s better to open or maintain positions after breaking 99443, as volatility is expected to increase at higher levels.
Whether I open a long position after breaking the trendline or resistance at 98599 depends on Bitcoin dominance. If Bitcoin dominance shows a red candle at the time of the breakout, I’ll focus on altcoins or BTC pairs. If it’s green, I’ll prefer Bitcoin itself. This could lead to another wave movement.
📊 Weekly Timeframe
It feels like we’re analyzing forex charts—completely ranging! This is normal given Ethereum Classic’s mining-related dynamics and the heavy movements associated with it.
For around 1100 days, this coin has been ranging within a large 130% box. Without a proper trigger, investing in this range might have tied up your capital, especially when other projects provided much higher returns over the same period. This highlights the risk of entering the market without a trigger.
If you’re holding ETC and want to set a stop-loss, you can exit if a weekly candle closes below 14.68.
For re-entry, the box top trigger at 36.58 is an excellent option. Since ETC is rebounding from the box’s midline, the likelihood of breaking the top is higher. The 24.78 support level can serve as a suitable stop-loss for box breakout attempts.
📈 Daily Timeframe
ETC has been performing well since breaking the daily box top at 20.92. It moved from the box’s bottom to its top, emphasizing the 38.24 resistance even further.
The $25 level currently serves as the most crucial support, coinciding with the weekly box’s midline. Staying above $25 indicates a higher low and a rebound from the channel’s midline, reflecting stronger buyer activity. This could lead to testing 38.24 again and possibly breaking it.
If you bought after the 20.92 breakout, your stop-loss should be below 17.55, with some profits already secured. If you haven’t acted yet and if resistance at 28.49—better yet, 30.20—causes a rejection and forms a lower high, consider exiting below $25 and look for new triggers later.
For re-entry, breaking 28.49 is a potential entry point, but your main entry should be after breaking 38.24, with momentum and increased volume supporting it.
⏱ 4-Hour Timeframe
ETC belongs to the group of coins that didn’t break their 4-hour resistance and box top yesterday, possibly setting up futures positions next week.
📈 Long Position Trigger
The rejection from 28.49 clearly defines the trigger. Open a long position after breaking this resistance or after the RSI breaks 72.58.
📉 Short Position Trigger
The main trigger at 24.92 is quite distant. However, if the 28.49 resistance turns out to be a fake breakout, you can use the fake breakout strategy. Look for the first trigger in lower timeframes to open a short position.
📝 Final Thoughts
Stay calm, trade wisely, and let's capture the market's best opportunities!
This analysis reflects our opinions and is not financial advice.
Share your thoughts in the comments, and don’t forget to share this analysis with your friends! ❤️

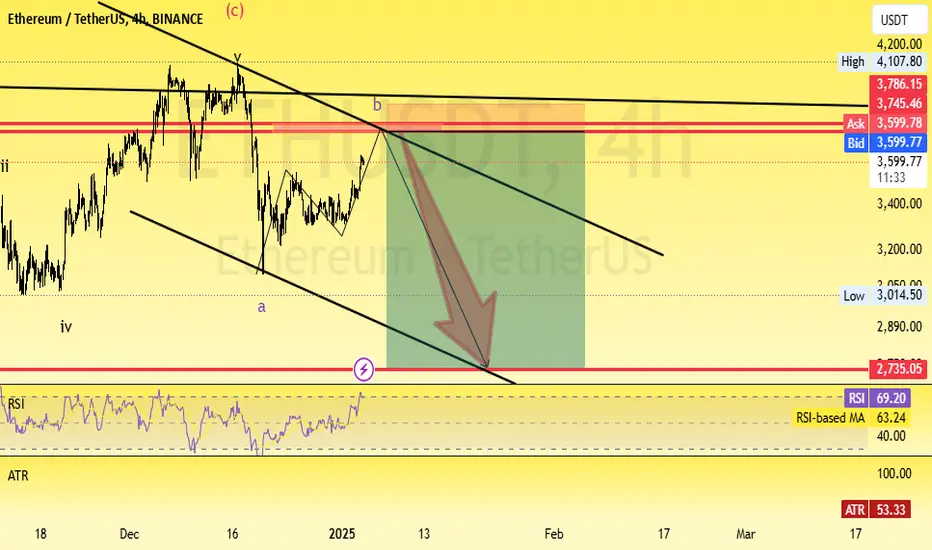
ETHUSDT: 4hr Timeframe Elliot Wave analysisHello friends. According to Elliot Wave from ETHUSDT I expected the leg C for this currency and start downtrend at 3700$ shows on chart and touch the target at 2700$ . be profitable .
ETH/USDT IN 15 minutes AnalysisETH/USDT 15-Minute Analysis
On the 15-minute time frame, ETH/USDT has successfully broken out of a triangle pattern, indicating potential bullish momentum. If the breakout is supported by strong volume and sustained buying pressure, we can expect the price to move toward the green target zone.
Target zone:
The green zone is the current target area, aligning with the measured move from the triangle breakout.
At this moment, it’s crucial to monitor whether the price finds support at the breakout level to confirm the continuation of the trend.

Sun Token ($SUN): Strategic Entry into DeFi Ecosystem TokenI spend time researching and finding the best entries and setups, so make sure to boost and follow for more.
Sun Token ( NYSE:SUN ): Strategic Entry into DeFi Ecosystem Token
Sun Token (SUN) is a crypto in the CRYPTO market. The price is 0.02420828 USD currently with a change of -0.00058 (-0.02359%) from the previous close. The intraday high is 0.02517523 USD and the intraday low is 0.02232376 USD.
Trade Setup:
- Entry Price: $0.02197
- Stop-Loss: $0.00692
- Take-Profit Targets:
- TP1: $0.05232
- TP2: $0.08906
Fundamental Analysis:
Sun Token ( NYSE:SUN ) is integral to the TRON blockchain's decentralized finance (DeFi) ecosystem, facilitating governance and incentivization within the platform. Its role in promoting DeFi activities on TRON has garnered attention from investors seeking exposure to this growing sector.
Technical Analysis:
- Current Price: $0.02420828
- Moving Averages:
- 50-Day SMA: $0.02350000
- 200-Day SMA: $0.02200000
- Relative Strength Index (RSI): Currently at 55, indicating neutral momentum.
- Support and Resistance Levels:
- Support: $0.02250000
- Resistance: $0.02550000
Market Sentiment:
The DeFi sector continues to expand, with NYSE:SUN playing a pivotal role in TRON's ecosystem. Its integration into various DeFi protocols enhances its utility and appeal among investors.
Risk Management:
Implementing a stop-loss at $0.00692 helps mitigate potential losses, while the take-profit targets at $0.05232 and $0.08906 offer favorable risk-reward ratios. Given the token's volatility, strict adherence to these levels is crucial.
When the Market’s Call, We Stand Tall. Bull or Bear, Just Ride the Wave!
Disclaimer: This analysis is for informational purposes only and does not constitute financial advice. Traders should conduct their own due diligence before making investment decisions.

Ethereum Trade Alert: Next Big Move Incoming!#Ethereum Trade Setup
Entry Zone: $3,530 to $3,696
Targets:
$4,700
$5,300
$6,050
$8,954
Stop-Loss (SL): $3,169
Leverage: 3X to 5X
Don't miss this opportunity! If you missed the BTC rally, Ethereum could be your chance to catch the next big move. 🚀
#ETH #bullrun

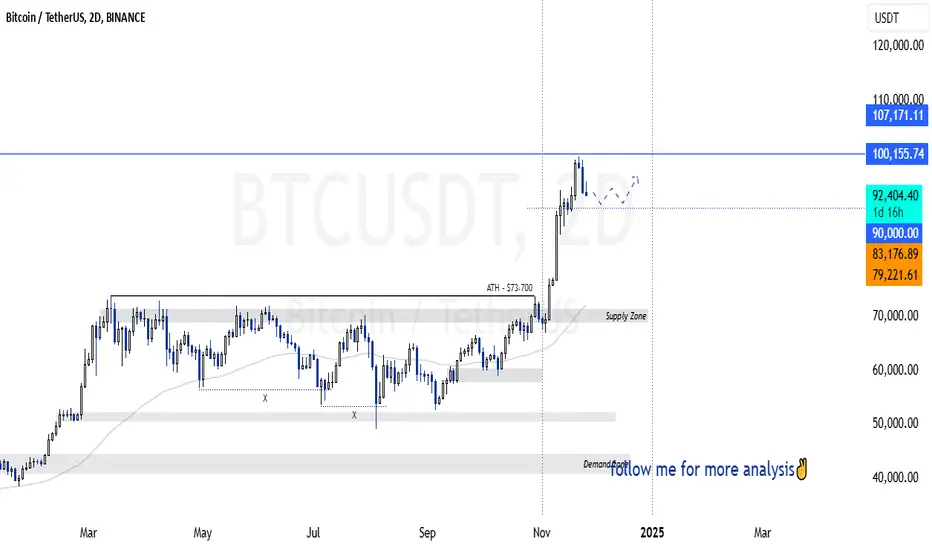
SasanSeifi|Bitcoin Hits $99,500 ATH: Will It Cross $100K Next?Hey there, ✌ As shown in the BINANCE:BTCUSDT 2-day chart, the price broke its previous all-time high (ATH) of $73,000, leading to an impressive rally that reached a new ATH at $99,500. This strong upward movement sparked optimism for further growth. However, after hitting this level, Bitcoin faced resistance and is currently trading around $92,400.
Currently, a minor range is visible near the $90,000 price zone in the 2-day timeframe. If Bitcoin manages to hold this level and consolidate, it may enter a range phase. Following this phase, Bitcoin is expected to resume its upward trend, targeting $100,000 and $107,000.
On the other hand, if Bitcoin fails to maintain the $90,000 support and faces selling pressure, a correction may occur. In such a scenario, a confirmed breakdown below $90,000 could lead to further declines toward the $83,000 and $79,000 support levels.
The $90,000 level is critical for assessing Bitcoin’s next move. A consolidation here could pave the way for more growth. Additionally, if Bitcoin ranges at this level, altcoins might also benefit from bullish momentum.
💢 Please remember that this is just my personal viewpoint and should not be taken as investment advice. I’d love to hear your thoughts and share opinions!
Happy trading!✌😎
Sure, if you have any more questions or need further clarification, feel free to ask. I'm here to help!✌
ETH USD UpdateSo Month Later Price has filled orders and finally got going, easy 50% Spot gain profits are ahead of us, happy cruising!
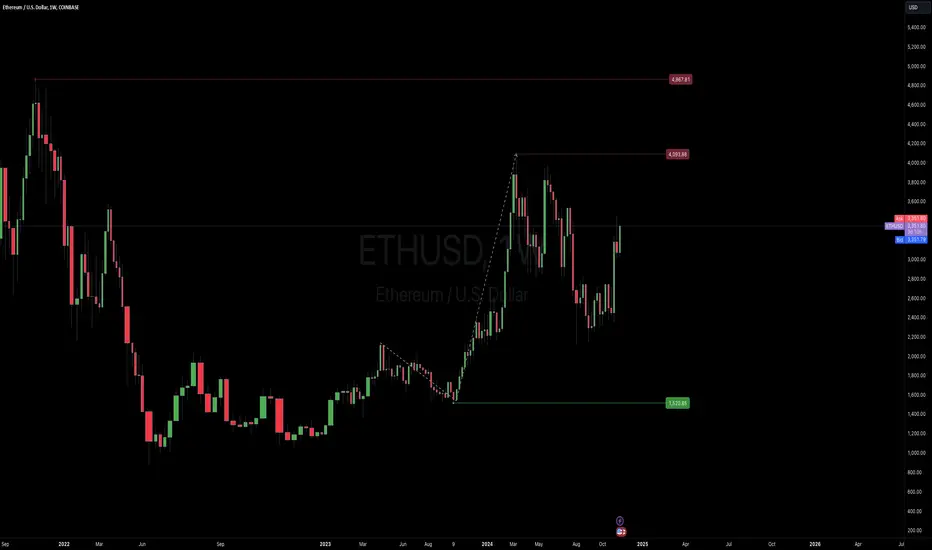
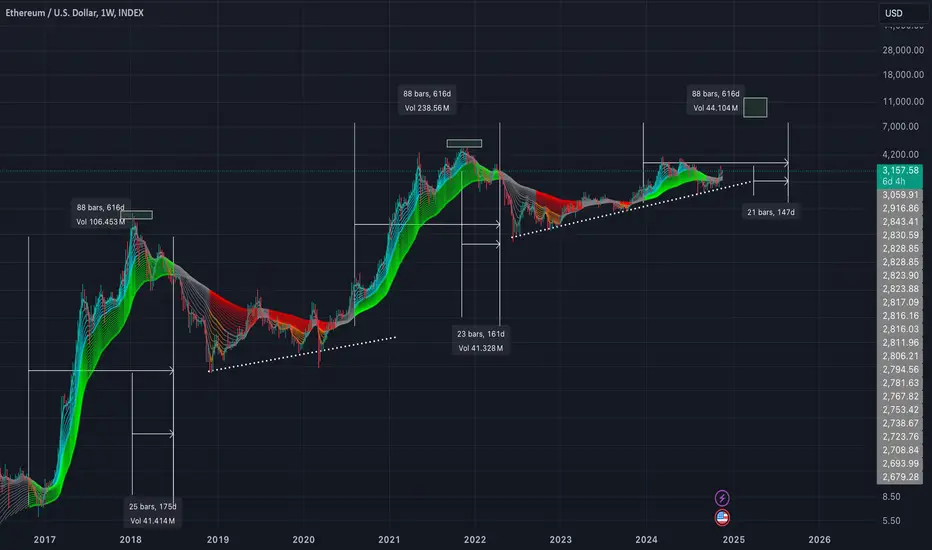
Etherum might be about to PopIf this patterns keep playing out we should find topping prices around March 2025. According to previous bull markets price usually tops ~100 and more days before the 616 days of bullish trend.
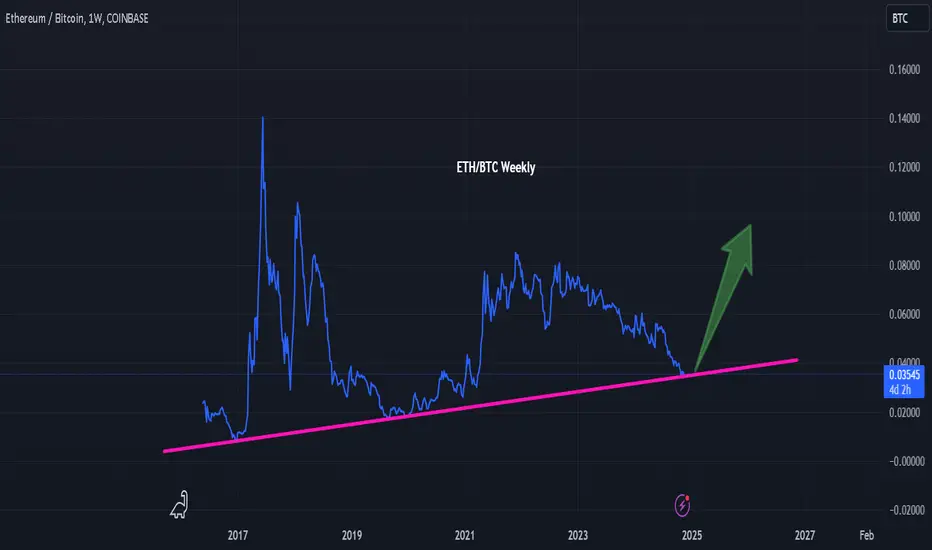
ETH/BTC Weekly - Ascending Trendline Support and Potential RebouThe ETH/BTC weekly chart shows a strong ascending trendline acting as long-term support. ETH/BTC is currently near this support level, where it has historically shown bullish reactions. The recent drop to the trendline suggests a potential bounce, with a green arrow indicating the possible upward trajectory if the trendline holds.
I'm personally considering this level for a potential long position, with a target near 0.08 BTC, aligning with prior resistance. However, if the price closes below the trendline on the weekly chart, I’ll reevaluate this setup for further downside possibilities.
This is my personal trade setup and not financial advice
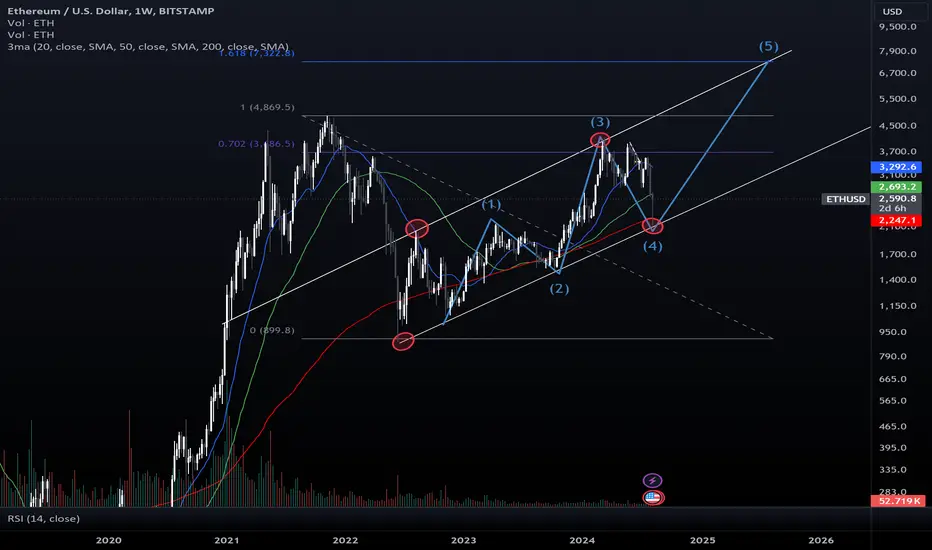
Etherum eyes $7,300 After Wave 4 Rebound! Long-Term Analysis of ETH/USD
We are back with another in-depth look at the ETH/USD pair. It appears that Elliott Wave 4 has completed, and we may see one more wave to the upside before a larger correction occurs.
Wave 4 was particularly intense, with a sharp and rapid decline that brought the price down to the 200-week moving average (MA). This level also coincided with the lower support line of the current channel. Fortunately, we experienced a strong rebound from this area, and the market is now poised for a potential upward movement.
My target for this next leg is at the 1.618 Fibonacci extension level, which is around $7,300 per coi
The wolf pack are hunting for profits, one block at a time..🐺
Make sure to follow my new profile on X for more weekly updates! :@PuppyNakamoto
Happy trading!
COINBASE:ETHUSD BITSTAMP:ETHUSD BINANCE:ETHUSD BINANCE:ETHUSDT
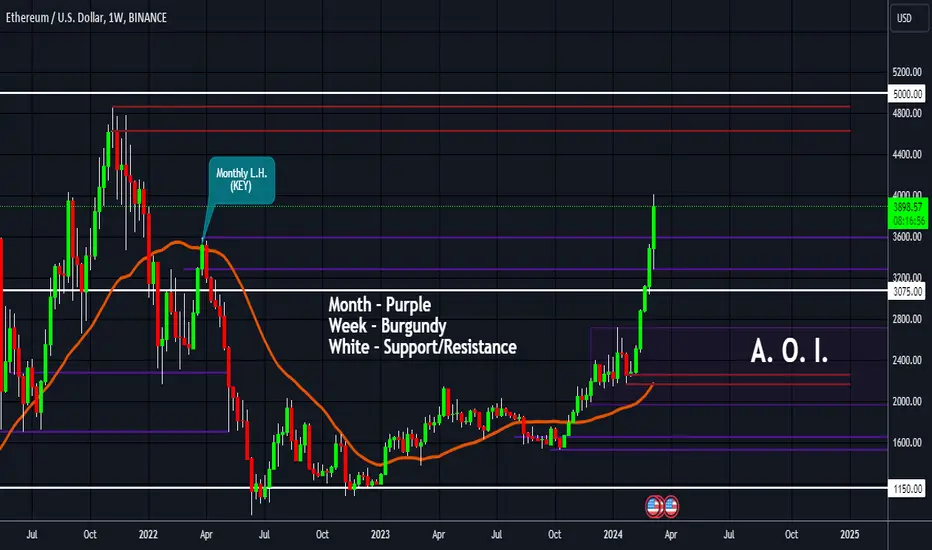
EthereumI'm finding myself gravitating more towards this crypto over Bitcoin, and that's mainly due to Ethereum's price. I'll explain my chart along with what I'm anticipating.
What am I anticipating?
Price is currently breaking a key lower-high on the weekly, which happens to also be the same area as the monthly (key) lower-high. Once that bull candle closes pass those levels at the end of today then the weekly turns bullish.
Normally, price would run into an old key area in order for the retracement phase to begin. I'm looking for bull continuation to spike the A.T.H. and $5000 price point followed by a correction right into my area of interest (A.O.I.).
Do I have a "special" price within the A.O.I.?
I actually do! $2400.
In conclusion, I'm merely a spectator until the bears enter the market to drive price down, and if that doesn't happen due to bull momentum, I'll readjust.
M - 🐻
W - 🐻 *If today's candle closes above the key LH, it turns 🐂*
D - 🐂
H4 - 🐂
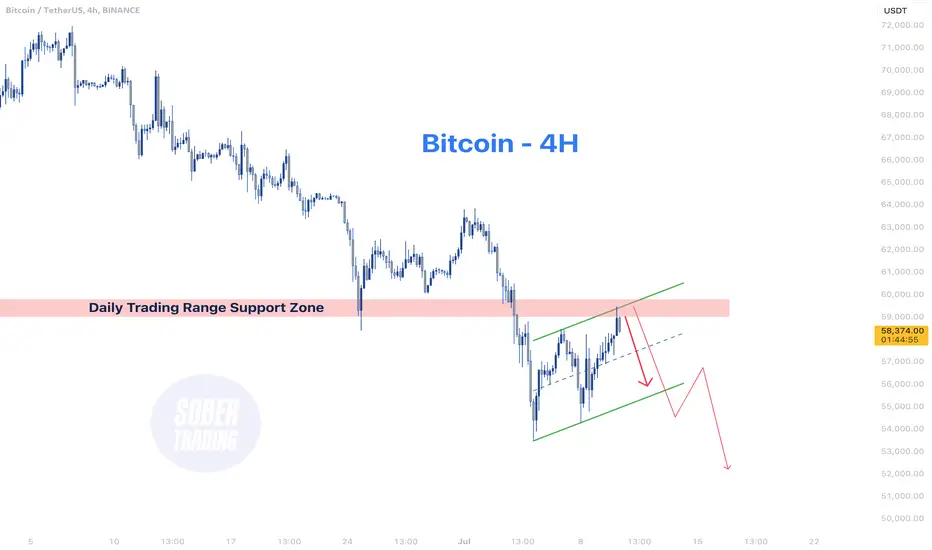
BTC - 4H Best Sell Opportunity#BTCUSDT is currently trading within an ascending channel that is often recognized as a bearish flag pattern, indicating a potential continuation of the downtrend. The price is approaching the top of this channel, which coincides with a significant resistance zone. This confluence of resistance levels provides a strategic entry point for short positions, offering a logical stop loss placement just above the resistance zone. The bearish flag pattern suggests that the upward movement within the channel is a temporary correction before the downtrend resumes.
Additionally, there is a notable daily timeframe support zone that has been broken and now acts as a resistance after a period of consolidation below it. This transformation from support to resistance further strengthens the bearish outlook. As #BTCUSD tests these resistance levels, the probability of a downward move increases, making this an ideal setup for traders looking to short Bitcoin. The confluence of technical factors suggests a high probability of BTC resuming its downward trajectory from the current levels.