ETH USD IdeaGreetings, Traders, and a prosperous New Year to all! As we re-enter the charts, the liquidity remains low in both the crypto and forex markets. Currently, no trades have been initiated, as we are patiently waiting for weekly order blocks to signal the commencement of the new year. Additionally, we are monitoring zones for potential discounts.
This routine tends to repeat itself each year, and historically, market activity is often subdued until the end of January. Notably, we are anticipating significant news related to the Bitcoin ETF on the 10th, which could impact our trades that have been performing well since the end of last year. Presently, we have set stops below the latest bullish distribution.
In the event of positive news on the 10th, we anticipate a substantial increase in price. However, it is crucial to acknowledge the fact that we are currently situated within the monthly bearish distribution zone. We will closely observe the developments this week and provide regular updates on our charts.
Stay tuned for further updates. Thank you, and happy trading!
Etherum

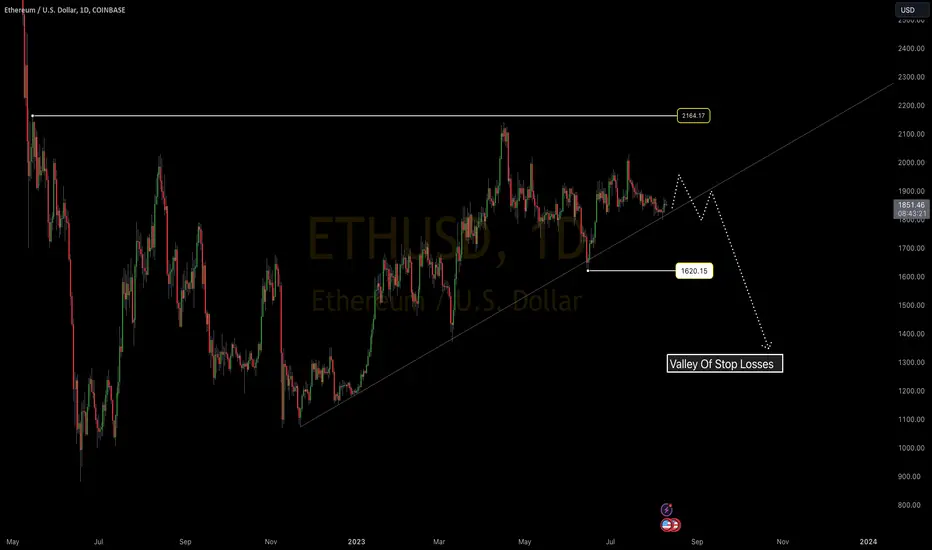
ETH USD ideaOur killer trendline that hooked us up with those rad entries might be showing some signs of taking a break. I mean, it's been unreal how it's been delivering, right? But hey, let's not get too ahead of ourselves. If we're giving up that trendline and the 1620 price point, we gotta be real careful.
Here's the deal – if that trendline starts slipping away and we break that 1620 level, we're not sticking around to see if it's just a passing thing. We're playing it smart, closing those spot trades and taking a chill pill. We'll just kick back, ride the wave, and see what kind of data is rolling in.
And hey, don't stress – besides all that, the daytrading scene is looking pretty darn groovy. So, keep those eyes sharp, stay ready to bail if needed, and let's ride these waves with the finesse of true chart surfers. Stay stoked, stay sharp, and let the market vibes guide us, man! 🌊🤙🏄♂️📉
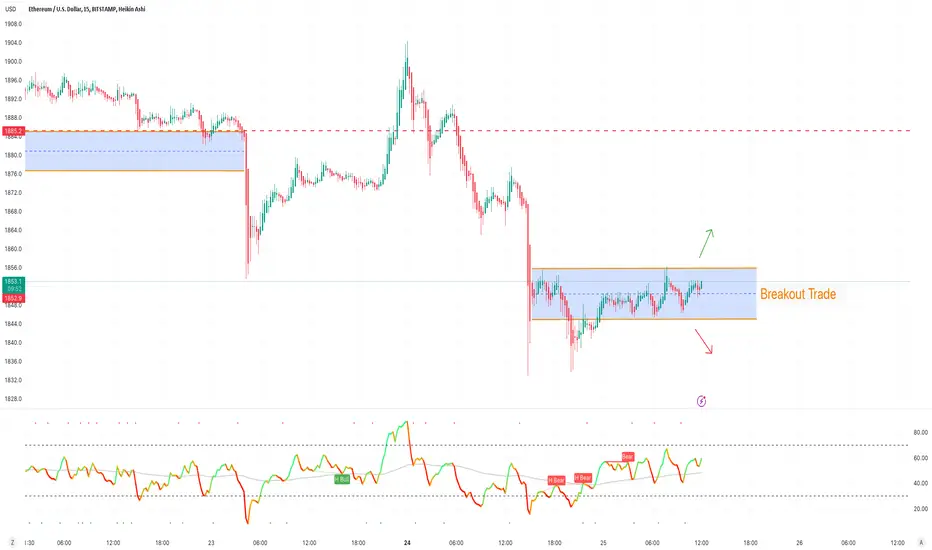
ETHUSDT Breakout TradeETHUSDT wait for breakout and trade in the direction of breakout.
Manage your risk according to account size!
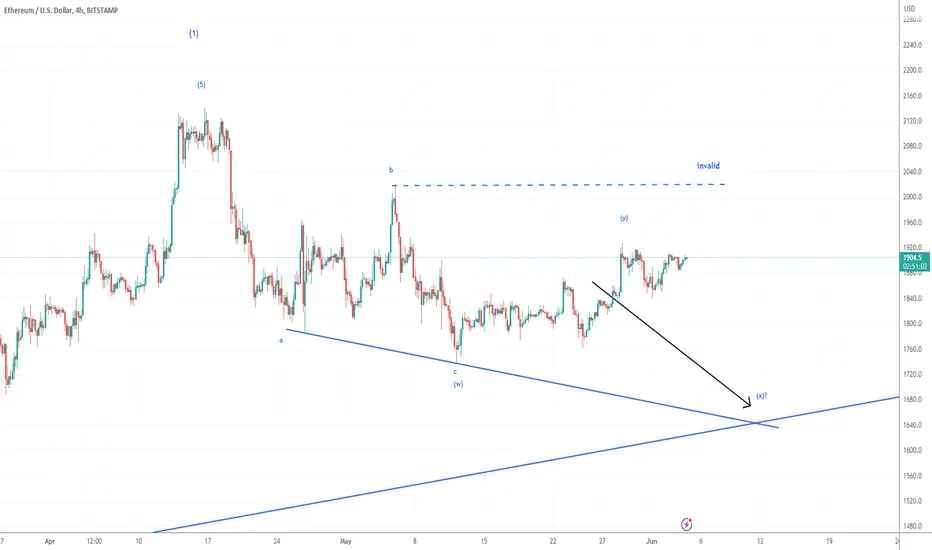
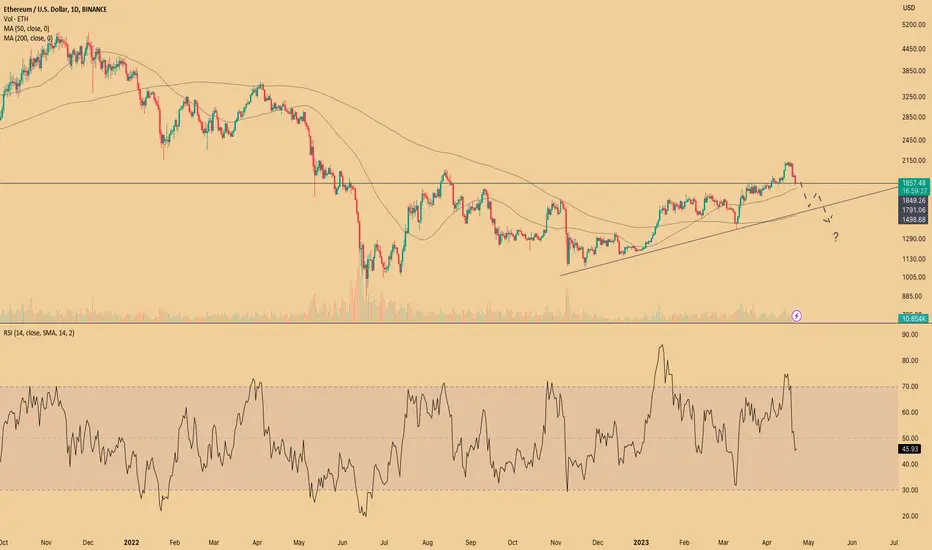
ETHUSD 4June2023ETH is currently still in the correction period, it can be quite long if you look at the current trendline pull. the invalid area is only a marker if the price goes higher then the elliot notation may fail, but that does not mean the trend returns to bullish. most likely what happens is a complex correction that can last long enough.
CRYPTO TOTAL MARKET CAP DALILY HI Guys Hope you well,
On a daily basis, we are seeing a demand zone, but I am waiting to test the Green support level for the third time as well. And then we can see a rapid upward movement.
SecondChanceCrypto
⏰23/May/23
⛔️(DYOR)
always do your research.
If you have any questions, you can write them in the comments below, and I will answer them.
And please don't forget to support this idea with your likes and comment.

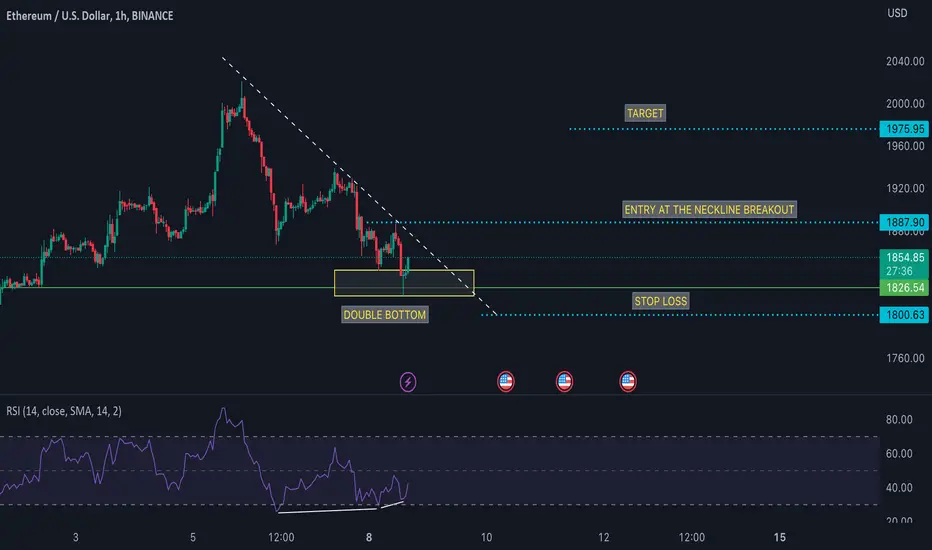
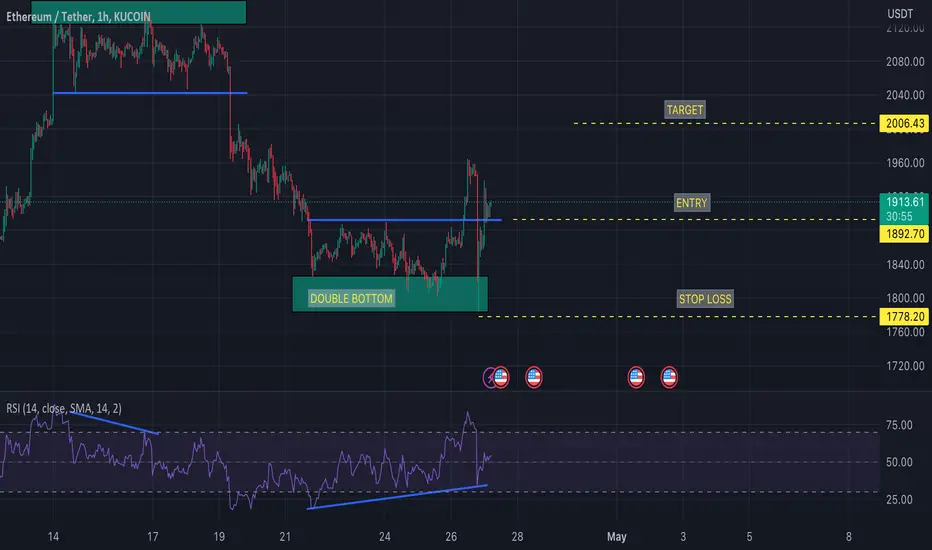
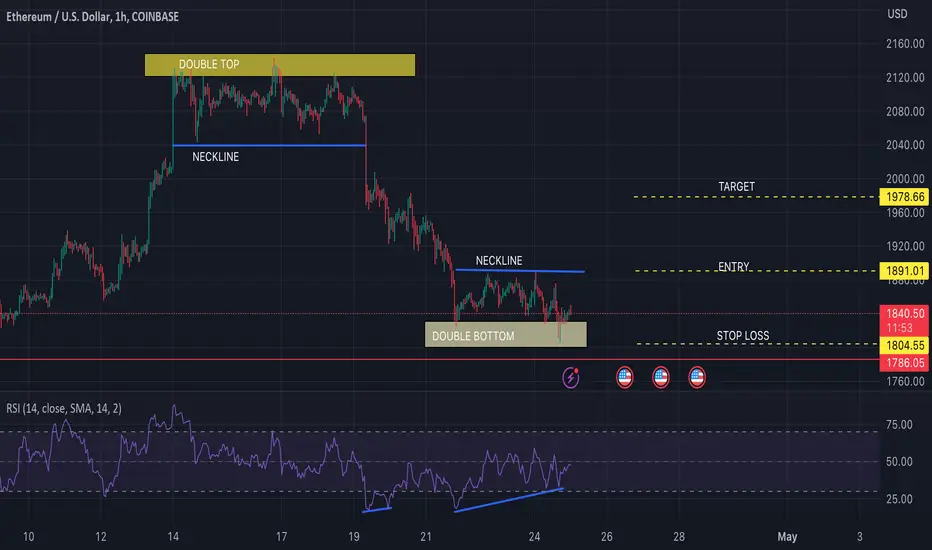
ETHERUM BULLISH IDEA (DOUBLE BOTTOM)Potential Bullish Entry Dow Theory In Place -
Higher High and Higher Low Expected in Place
Formation of DOUBLE bottom coupled with bullish divergence (Bullish reversal pattern)
SL & TP Levels are defined.
W10-30 ETC BULLISH IDEAPotential Bullish Entry Dow Theory In Place -
Higher High and Higher Low Expected in Place
Formation of double bottom coupled with bullish divergence (Bullish reversal pattern)
Entry at the break of trendline, SL & TP Levels are defined.

W9.1-38 ETHERUM BULLISH IDEA (DOUBLE BOTTOM)Potential Bullish Entry Dow Theory In Place - Higher High and Higher Low Expected in Place Formation of DOUBLE bottom coupled with bullish divergence (Bullish reversal pattern) SL & TP Levels are defined.
W9.1-21 ETHERUM SHORT TERM BULLSIH IDEAPotential Bullish Entry
Dow Theory In Place - Higher High and Higher Low Expected in Place Formation of DOUBLE bottom coupled with bullish divergence (Bullish reversal pattern) SL & TP Levels are defined.
If the price action does not follow the plan mentioned in the chart then, The support zone is 1786 and 1836; (watch out for your levels)
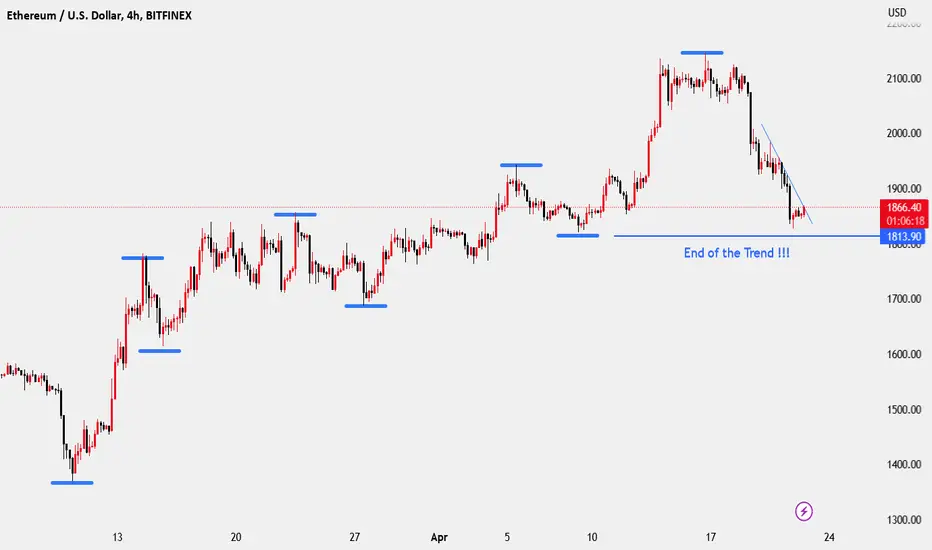
Eth change trendAccording to the chart if price touched long horizontal blue line means trend finished . This point is a hard situation with ot of orders. So if this line break we can short. But in my ideas we have a continues in trend to up. Currently i am wait for other signs.
W9.1 ETHERUM BULLISH IDEA (HARMONICS BULLISH PATTERN)Potential Bullish Entry
Dow Theory In Place - Higher High and Higher Low Expected in Place
Formation of Harmonic Bullish reversal Pattern coupled with bullish divergence at potential reversal zone (PZR)
Entry at the new HH
SL & TP Levels are defined.

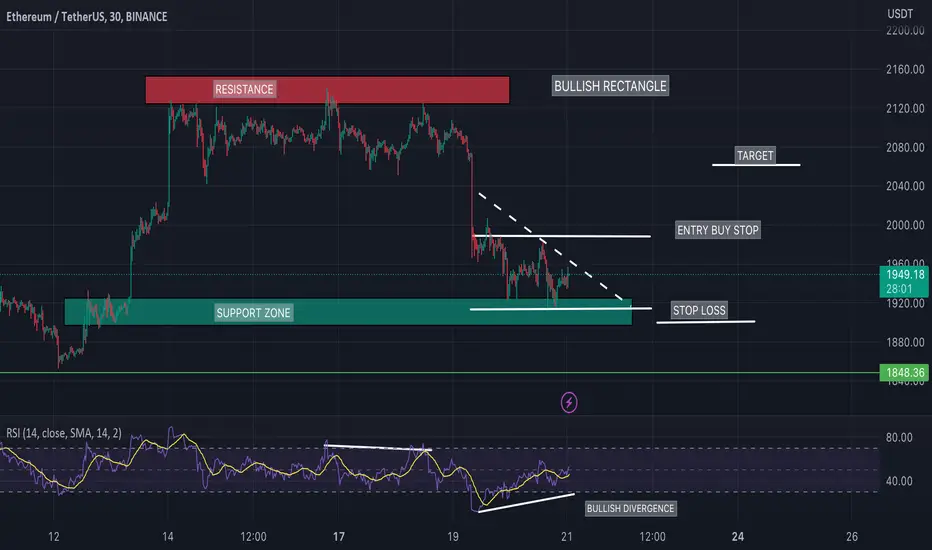
W9-25 ETHERUM BULLISH IDEA(BULLISH RECTANGLE)Potential Bullish Entry
Dow Theory In Place - Higher High and Higher Low Expected in Place
Formation of BULLISH RECTANGLE Pattern coupled with bullish divergence.
Entry, SL & TP Levels are defined.
$ETH - "SHORT" SETUP in PERSPECTIVE#CRYPTOASSETS #STRATEGY
CRYPTOCAP:ETH
THE RANGE 1938$ - 2047$
We might playing inside what we passed without interest. But there is indeed !
1925$ MIght be a perfect preliminary. 1908-1900 is called on the HEATMAP
IS the UpTREND done ? Maybe ! Price Action has left 2060$ and DISTRIBUTION MIGHT BE OVER. THE VALIDATION should be with a LPSY @2115$ (MY SHORT) STOP 2146$ > TARGET 1490$ (1600$ AT LEAST)
BREAKING 2146$ : 2 Otions
1. UTAD, THEN We reintegrate > STOP SHORT below 2060$
2. JAC (+50$ at LEAST) > I will be LONG and my first TARGET will be 2360$
Source :
www.tradinglite.com

what do you think about The LONG position on ETH ?what do you think about The LONG position on ETH ?
have a good day.

Represents A Significant Price LevelEthereum (ETH) price is struggling to consolidate above $1,700. This Monday, February 20, is the fifth consecutive day that Etherum has passed that level, but in the previous days it has not been able to close above said price.
As of this writing, ETH is trading at just $1,708, on TradingView records . The highest level in recent days was recorded on February 16, when it reached $1,742 per unit .
However, on that occasion the daily candle closed in the red, below $1,640 . The same has happened on the other days, with ETH being unable to stay above the $1,700 barrier at the end of the day.
At the moment, he is achieving it this Monday. That price mark is an important barrier, taking into account that that level was lost 5 months ago. On September 13, its price fell from there to not return, until a few days ago.
As it was reported by the end of January ETH had managed to consolidate a new price level above $1,500 . In addition, various bullish signs already supported the rise of the cryptocurrency from that moment.
So far this year, the entire cryptocurrency market has been bullish and very promising. In addition to ETH, bitcoin has risen almost 50% this 2023 and went to its best price in 6 months.
In addition, there are already at least 30 cryptocurrencies in the top 100 that have doubled in price today. A list that was barely 17 coins a few days ago. In that list there are even some outstanding trends, such as the case of cryptocurrencies related to artificial intelligence or Stacks case and its relationship with the NFT Ordinals in Bitcoin.

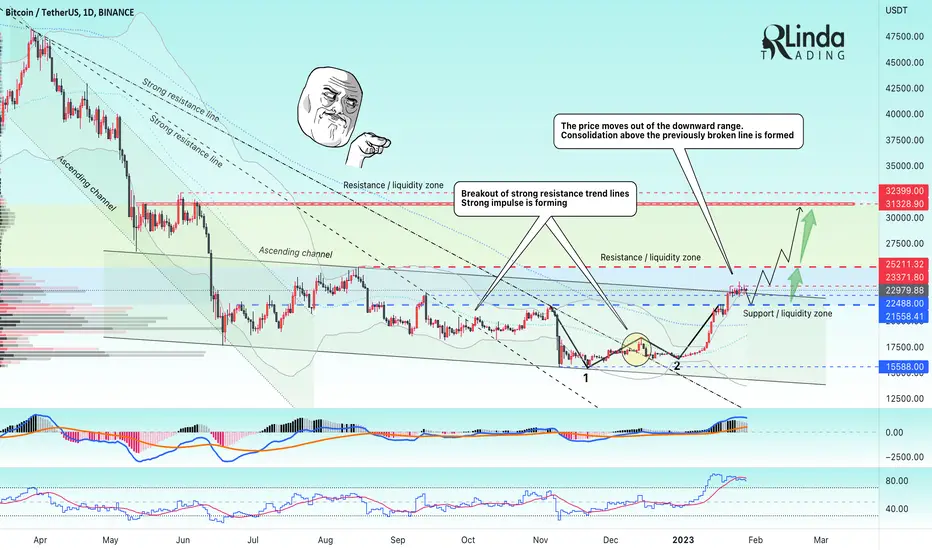
RLinda ! BTCUSD-> Consolidation. What to expect from the price? Bitcoin has been forming a 46% rise since its second (supposed) bottom, which is quite surprising. As Sentiment noted in one of its reports - shortly before the rally, on January 5, there were 2 identical, largest deals in a month on the BTC network. Again it's worth asking - was that the scenario? (The cycle is starting to repeat itself again.)
It is worth to pay attention to an interesting situation: when distributive movement is formed, the price breaks through the resistance of descending channel and consolidation is formed. Statistically, I can single out such a set-up as a possible false-break. While the price is above this line, the buyers are actively gaining positions, but it is possible that in the near future the market maker may weaken the price a little (trap) to entice liquidity.
In our case, if the price consolidates below 22488, it could go to the strong support from June 24, 2022 - 21558
The flagship has now entered a strong range - support 21558 - resistance 25211. The price is consolidating above the support zone and if you look from a trivial behavioral point of view, the price could head towards 25211 in the near future, but in that case the bulls need to hold the levels of 22488 and 21558.
At the same time WhaleMap is paying attention to the levels of the traded volumes in Bitcoin and notes that the next significant resistance level (according to the traded zones) is the resistance of 27000, and till that time the price will be in the void zone of the chart, in fact, there will be no obstacle before reaching the mentioned resistance
Strong levels and zones.
On the support side, bitcoin has the following strong support zones, 22488, 21558 and a local low of 20400. An important nuance, if the price starts to form a pullback, so that bitcoin does not fall deeper than these levels, in that case the potential for a fall to 18400 will open
Resistance
The nearest strong resistance is the upper consolidation boundary at 23370. If the bitcoin breaks this level, the price can go up to 25000
Strong liquidity zone is hidden behind 23800 and 31300
Fundamental nuances:
-CryptoQuant: another long-term bullish signal is triggered
- The cycle repeats about every 3-3.5 years
- Stripe is actively working on crypto payments
- Glazznode: the NUPL at these levels shows that the capitulation in bitcoin may be exhausted, it means that everyone who wanted and could has mostly sold out
-CoinMetrics: BTC in this cycle between halvinagmies will depart significantly from the average dynamic in past cycles
- Bitcoin is behaving stronger than the SP500 index
Regards to R. Linda!
Bitcoin and the last hours above 20KBitcoin buyers and all financial markets thinks it’s the end of the tightening policy of FED and the other Central banks…but it’s the biggest bull trap ever we see…bitcoin breaks all the trend line and ready to go down.NOW.

Eth A SHORT BUY AND HUGE SELLEth broke a very strong support at 1400 from my analysis i think it shoud buy to 1400 then drop to 8
00

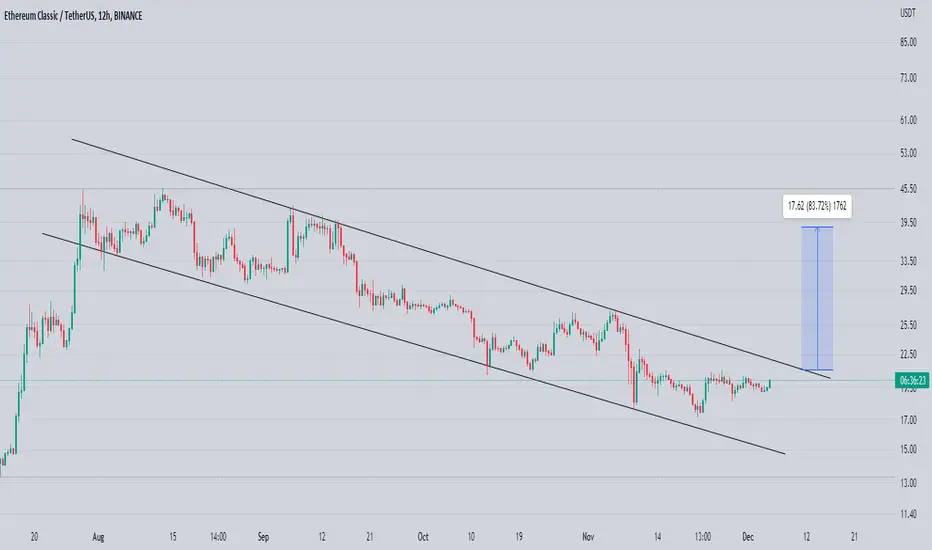
ETCUSDTFormed Descending Channel In h12 Timeframe
Incase Of Breakpout Expecting 70 to 805 Bulish Wave
$FTMUSDT UPDATE!!!Hi Snipers,
Please refer to the recording for the next price levels and scenarios.
Thanks
MS

ETH AT A CRITICAL POINT, WHERE IS RESISTANCE AND THE NEXT TARGETETH is at a critical point and is trying to break resistance. We will watch closely and if it breaks out we can watch for these targets.

$APEUSDT UPDATE!!!Hi Snipers,
Please refer to the recording for the next price levels and scenarios.
Thanks
MS
