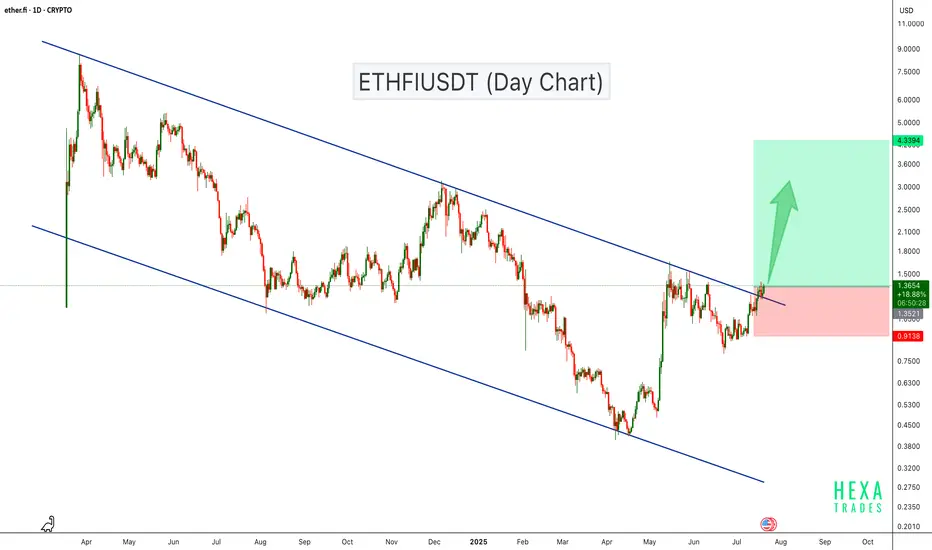
ETHFI Breaks Out of Descending Channel – Bullish Rally Ahead?ETHFI has been trading inside a descending channel for over a year, consistently respecting both resistance and support levels. Recently, the price broke above the channel resistance with strong bullish candles, suggesting a potential trend reversal.
This breakout indicates growing bullish momentum, and if the price sustains above the breakout level, we could see a move towards the $4.00–$4.70 range in the coming weeks.
Cheers
Hexa
ETHFIBTC
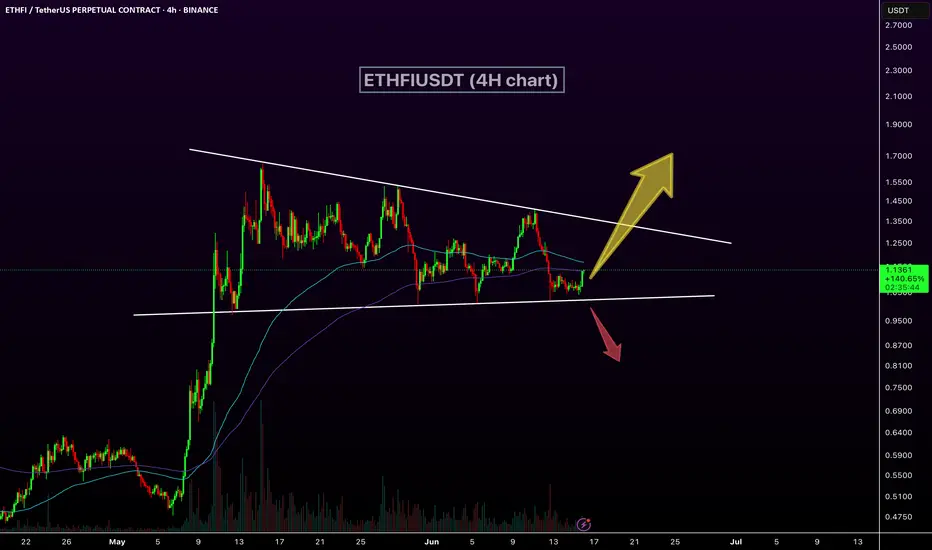
ETHFIUSDT Breakout Loading!CRYPTOCAP:ETHFI is consolidating within a symmetrical triangle on the 4H chart, with price tightening between descending resistance and rising support. A breakout or breakdown is likely soon. Watch for volume confirmation. Key levels to watch: $1.35 (resistance) and $1.00 (support). Breakout could lead to $1.50+, while breakdown risks a drop toward $0.95.
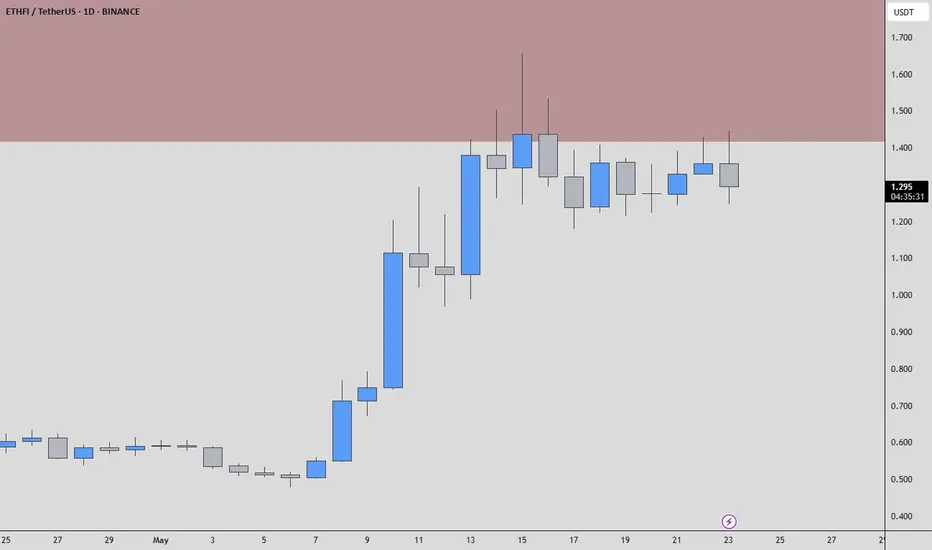
ETHFIUSDT | Bearish Bias Below the Red BoxETHFIUSDT isn’t showing strength here. Price is stuck below a clear red box resistance, and as long as that holds, my bias stays short.
There’s no sign of buyer aggression. CDV remains flat, and any volume upticks have been absorbed. Unless that red box is broken and retested, I see no reason to flip bullish.
Short ideas stay valid until proven otherwise.
Let the market earn your trust — not the other way around.
📌I keep my charts clean and simple because I believe clarity leads to better decisions.
📌My approach is built on years of experience and a solid track record. I don’t claim to know it all but I’m confident in my ability to spot high-probability setups.
📌If you would like to learn how to use the heatmap, cumulative volume delta and volume footprint techniques that I use below to determine very accurate demand regions, you can send me a private message. I help anyone who wants it completely free of charge.
🔑I have a long list of my proven technique below:
🎯 ZENUSDT.P: Patience & Profitability | %230 Reaction from the Sniper Entry
🐶 DOGEUSDT.P: Next Move
🎨 RENDERUSDT.P: Opportunity of the Month
💎 ETHUSDT.P: Where to Retrace
🟢 BNBUSDT.P: Potential Surge
📊 BTC Dominance: Reaction Zone
🌊 WAVESUSDT.P: Demand Zone Potential
🟣 UNIUSDT.P: Long-Term Trade
🔵 XRPUSDT.P: Entry Zones
🔗 LINKUSDT.P: Follow The River
📈 BTCUSDT.P: Two Key Demand Zones
🟩 POLUSDT: Bullish Momentum
🌟 PENDLEUSDT.P: Where Opportunity Meets Precision
🔥 BTCUSDT.P: Liquidation of Highly Leveraged Longs
🌊 SOLUSDT.P: SOL's Dip - Your Opportunity
🐸 1000PEPEUSDT.P: Prime Bounce Zone Unlocked
🚀 ETHUSDT.P: Set to Explode - Don't Miss This Game Changer
🤖 IQUSDT: Smart Plan
⚡️ PONDUSDT: A Trade Not Taken Is Better Than a Losing One
💼 STMXUSDT: 2 Buying Areas
🐢 TURBOUSDT: Buy Zones and Buyer Presence
🌍 ICPUSDT.P: Massive Upside Potential | Check the Trade Update For Seeing Results
🟠 IDEXUSDT: Spot Buy Area | %26 Profit if You Trade with MSB
📌 USUALUSDT: Buyers Are Active + %70 Profit in Total
🌟 FORTHUSDT: Sniper Entry +%26 Reaction
🐳 QKCUSDT: Sniper Entry +%57 Reaction
📊 BTC.D: Retest of Key Area Highly Likely
📊 XNOUSDT %80 Reaction with a Simple Blue Box!
📊 BELUSDT Amazing %120 Reaction!
📊 Simple Red Box, Extraordinary Results
I stopped adding to the list because it's kinda tiring to add 5-10 charts in every move but you can check my profile and see that it goes on..
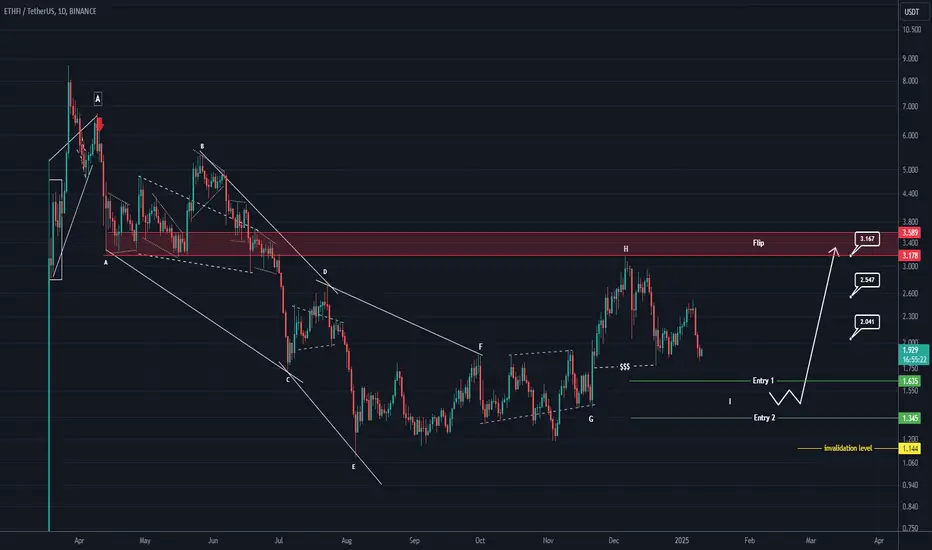
ETHFI Looks Super Bullish (1D)It seems that wave C of our higher-degree correction has completed. Wave C appears to be a diametric pattern.
As long as the green zone holds, the price could advance toward the red Flip zone, where wave D may form.
A daily candle closing below the invalidation level would invalidate this view.
For risk management, please don't forget stop loss and capital management
When we reach the first target, save some profit and then change the stop to entry
Comment if you have any questions
Thank You

ETHFI rebuy setup (1D)It seems that ETHFI is completing a symmetrical pattern. There are two important support zones on the chart. If the price reaches these zones, we can rebuy using this setup.
The low-risk areas for rebuying in spot trading are the two entries highlighted on the chart.
The targets are marked on the chart.
The closure of a daily candle below the invalidation level will invalidate this analysis.
For risk management, please don't forget stop loss and capital management
Comment if you have any questions
Thank You
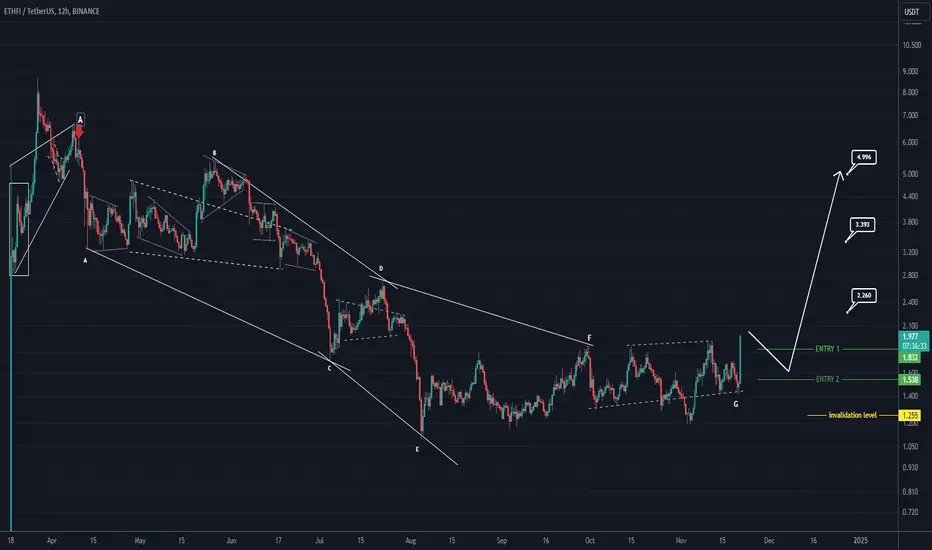
ETHFI is bullish (1D)The correction of ETHFI has started from the place where we have placed the red arrow on the chart.
The correction seems diametrical now that the G wave is over.
We have specified two entry points, which can be entered into BUY/LONG position in case of reversal.
The targets are clear on the chart.
Closing a daily candle below the invalidation level will violate this analysis.
For risk management, please don't forget stop loss and capital management
When we reach the first target, save some profit and then change the stop to entry
Comment if you have any questions
Thank You
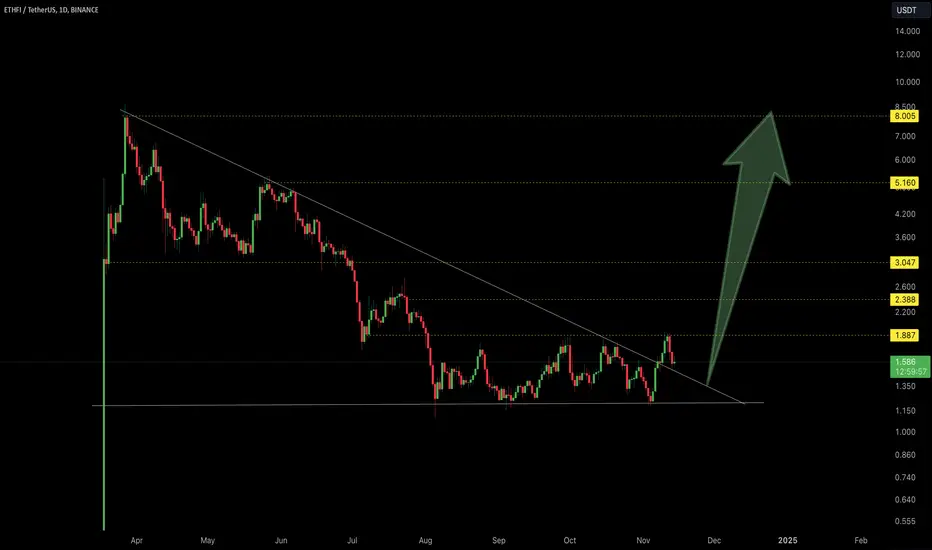
ETHFI/USDT CHART UPDATE !!ETHFI/USDT Trade Setup Update:-
ETHFI has broken out from a descending triangle pattern and confirmed support with a successful retest. The Ichimoku Cloud provides a strong foundation below, reinforcing the bullish setup. Combined with strong support, this structure suggests that ETHFI is primed for a potential upward move. Keep an eye on volume and key resistance levels as this breakout unfolds.
Disclaimer: This analysis is for informational purposes and is not financial advice. Always stay updated with market movements and adjust your trading strategies as needed.
You can DM us for information on any other coin.
@Peter_CSAdmin
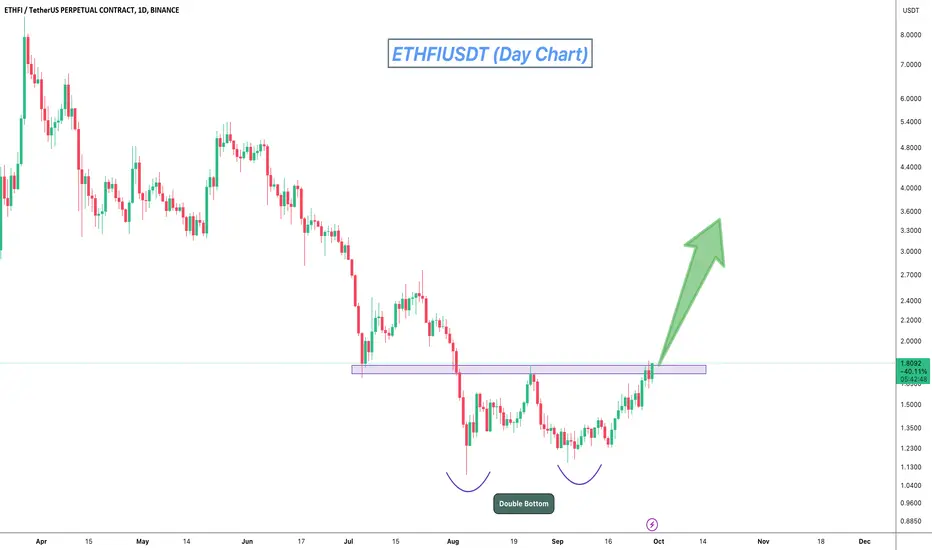
ETHFIUSDT Double Bottom: Preparing for a Strong Bullish MoveETHFIUSDT technical analysis update
ETHFIUSDT has formed a classic double-bottom pattern, indicating a potential reversal in its price trend. This formation, often seen as a bullish signal, suggests that the recent lows have established strong support. As the price approaches the neckline resistance, a breakout could trigger significant upward momentum.
Regards
Hexa
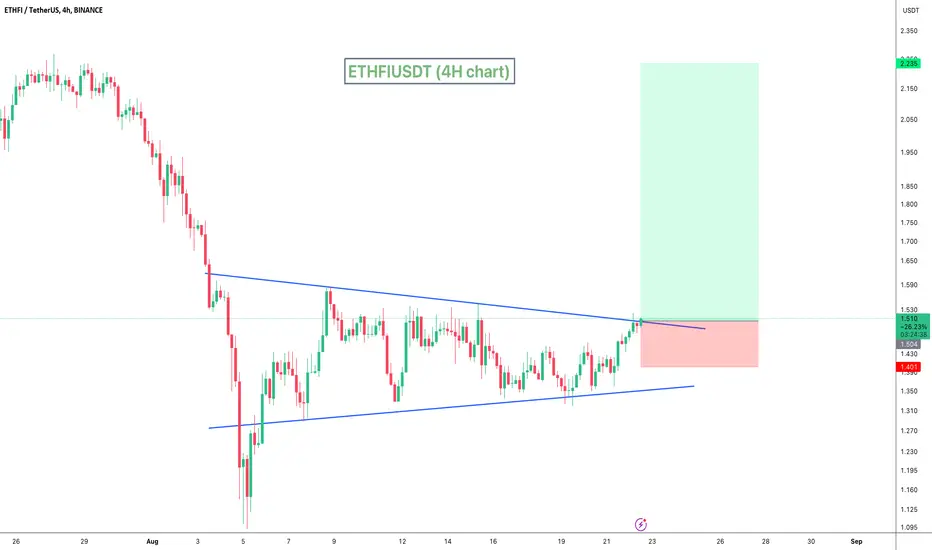
ETHFIUSDT Bullish TriangleETHFIUSDT technical analysis update
ETHFI price has formed a triangle pattern on the 4-hour chart and is moving towards a breakout at the triangle's resistance. Once the breakout is confirmed, we can expect a strong bullish move in ETHFI.
Buy zone : Below $1.51
Stop loss : $1.40
Regards
Hexa
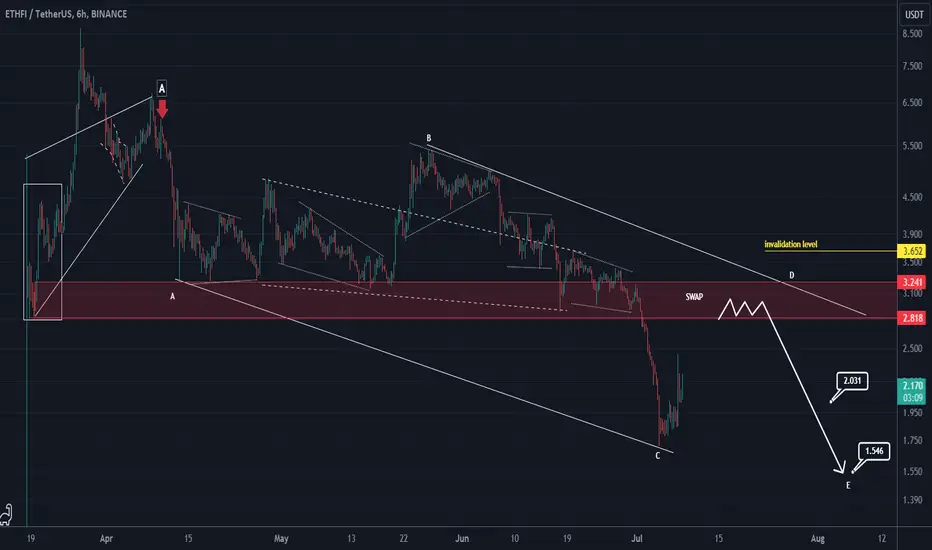
ETHFI is still bearishBy the data we now have on the chart and the time that has passed, the structure becomes clearer
From where we put the red arrow on the chart, it looks like the ETHFI correction has started.
The degree of correction pattern seems to be large.
We have a SWAP supply range, if the price reaches this range, we will look for sell/short positions.
The targets are clear on the chart.
Closing a daily candle above the invalidation level will violate the analysis
For risk management, please don't forget stop loss and capital management
Comment if you have any questions
Thank You
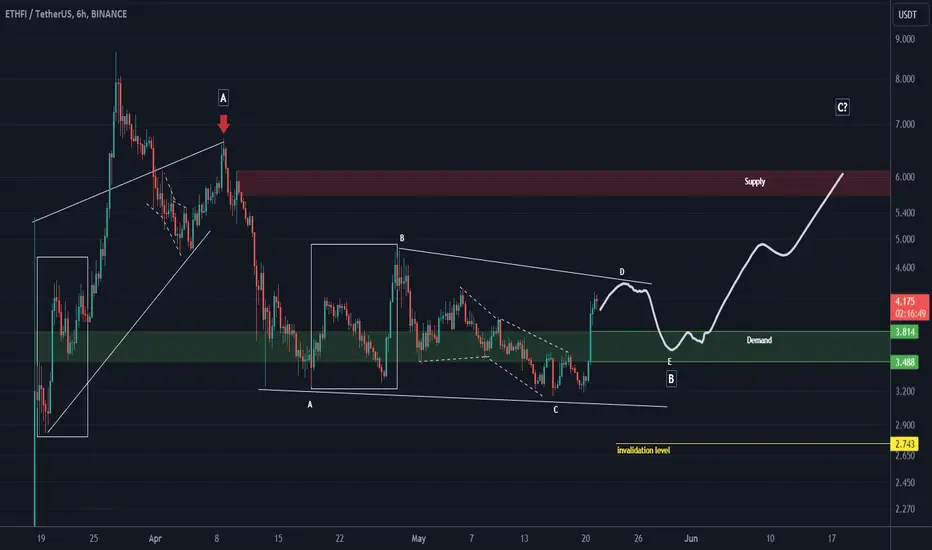
ETHFI NEW UPDATEAfter the completion of wave A, which was a bullish rally, the price has now entered a correction phase.
The correction phase corresponding to wave B looks like a large diametric that we are now completing wave E of.
There is a green area on the chart, if the price reaches this area, we will enter a buy/long position
The target can be the red supply box.
Closing a daily candle below the invalidation level will violate the analysis.
For risk management, please don't forget stop loss and capital management
When we reach the first target, save some profit and then change the stop to entry
Comment if you have any questions
Thank You

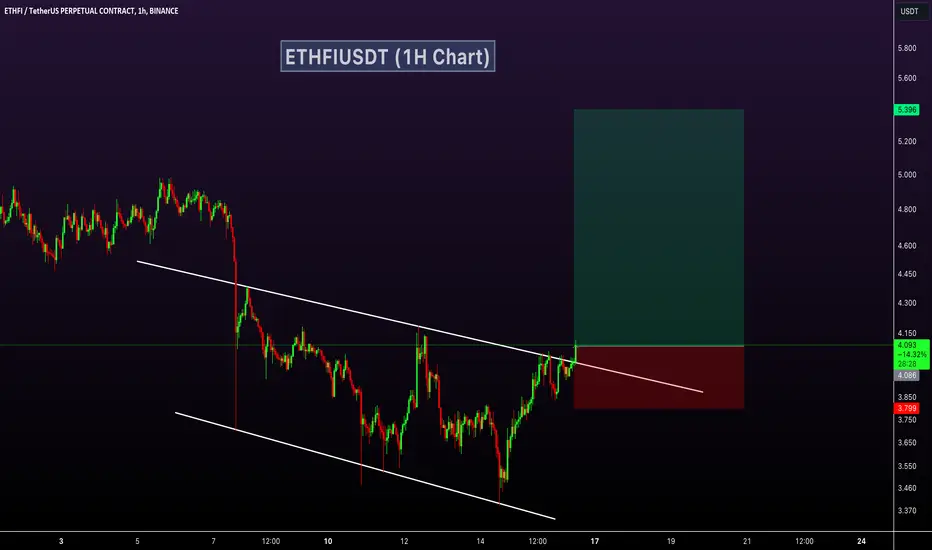
ETHFIUSDT Channel Breakout!ETFIUSDT Technical analysis update
The price of ETHFI broke its descending channel pattern on the 1-hour chart. On the daily chart, the price is bouncing from its major support.
Buy zone : Below $4.10
Stop loss : $3.80
Regards
Hexa
ETHFI looks bullishIt looks like we have three big ABC waves on the chart.
Wave B has started from where we placed the red arrow on the chart. Wave B looks like a triangle and now it looks like we are at the end of wave d of B.
After the completion of wave e of D, we can see the rising movements of the big C wave.
The targets are clear on the chart.
Closing a daily candle below the invalidation level will violate the analysis
For risk management, please don't forget stop loss and capital management
When we reach the first target, save some profit and then change the stop to entry
Comment if you have any questions
Thank You