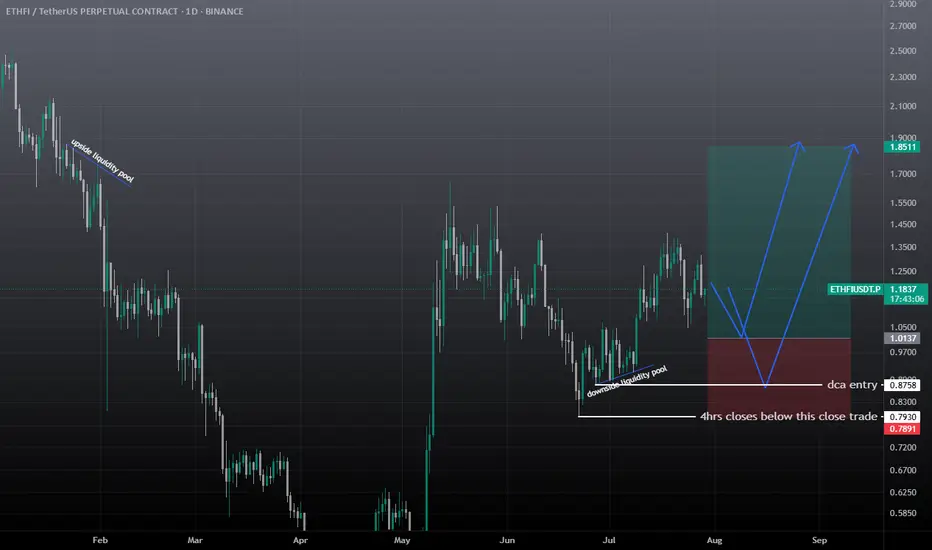
ETHFI Swing Buy / Long SetupWait for the entry, Must use SL, liquidation pending both sides, So wait for the one side to clear first. I'm not bearish on alts, until btc.d doesn't closes above 63%.
Ethfiusdtperp
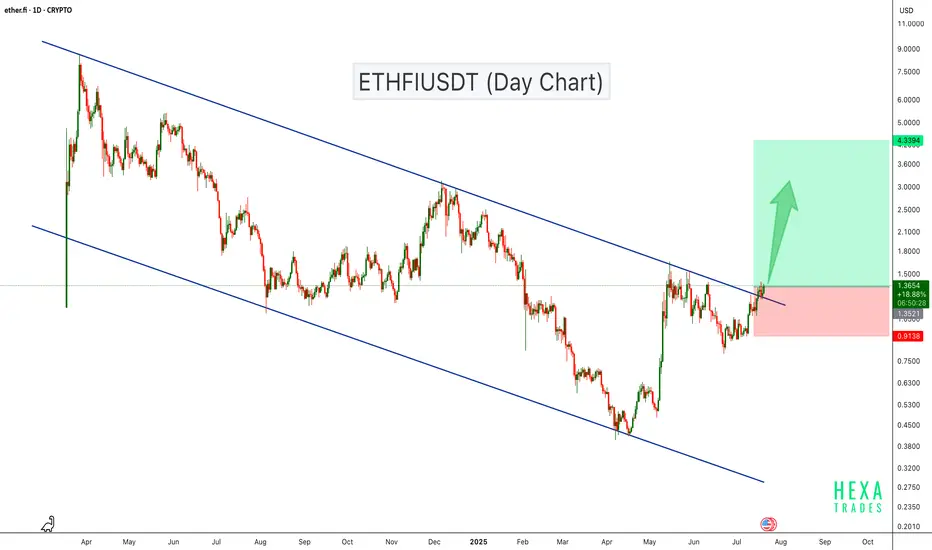
ETHFI Breaks Out of Descending Channel – Bullish Rally Ahead?ETHFI has been trading inside a descending channel for over a year, consistently respecting both resistance and support levels. Recently, the price broke above the channel resistance with strong bullish candles, suggesting a potential trend reversal.
This breakout indicates growing bullish momentum, and if the price sustains above the breakout level, we could see a move towards the $4.00–$4.70 range in the coming weeks.
Cheers
Hexa
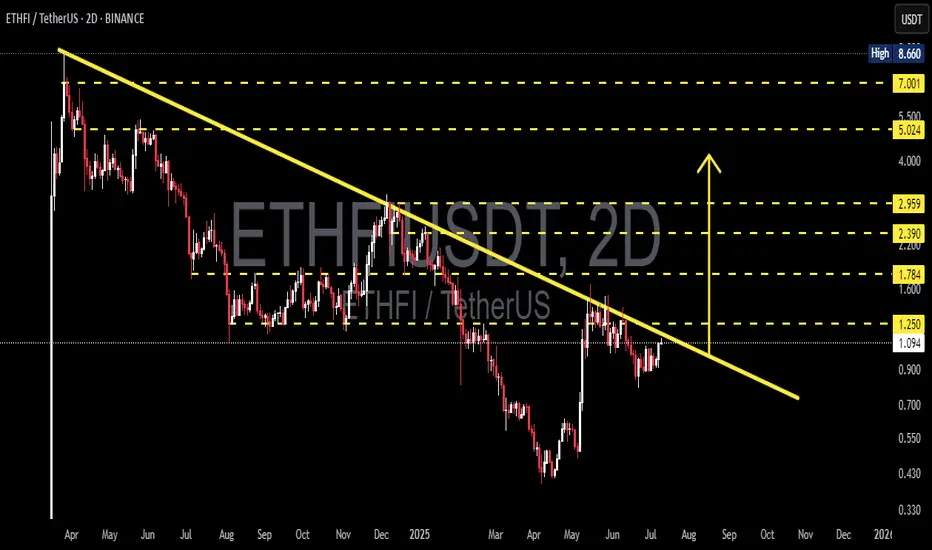
ETHFI/USDT – BREAKOUT ALERT! Descending Trendline Under Pressure
After over a year of relentless bearish pressure, ETHFI is now approaching a critical technical juncture that could mark the beginning of a major trend reversal. The chart displays a long-term descending trendline, and bulls are now challenging it with growing strength. This setup could lead to a powerful breakout and a potential trend shift.
🧩 Technical Pattern Overview:
🔸 Descending Trendline Resistance – Established since April 2024, acting as a dominant resistance across multiple retests.
🔸 Base Accumulation – Price has formed a strong base between $0.80–$1.00, indicating declining selling pressure and potential accumulation.
🔸 Volatility Squeeze – Price action is tightening near the apex of the descending triangle, suggesting that a breakout (up or down) is imminent.
🔸 Breakout Watch – A confirmed breakout above $1.25 would be a major bullish signal.
🐂 Bullish Scenario (Confirmed Breakout):
If the price breaks and closes above $1.25 with strong volume:
🎯 Potential Upside Targets:
Target 1: $1.784 – Previous local resistance
Target 2: $2.390 – Former consolidation zone
Target 3: $2.959 – Key psychological resistance
Extended Targets: $5.024 and $7.001 if a sustained rally unfolds
Ultimate ATH: $8.660 – If the broader crypto market enters full bullish mode
💡 Catalysts to Watch: Altseason, project news, favorable macro sentiment, or exchange listings.
🐻 Bearish Scenario (Rejection at Resistance):
If ETHFI fails to break out and gets rejected at the descending trendline:
🔻 Potential Downside Levels:
$1.088 – Immediate support
$0.88 – Minor support
$0.70 – Historical support zone
$0.50 to $0.35 – Deeper bearish targets if selling resumes
⚠️ Fakeouts are common during volatile phases — always wait for confirmation with volume.
📌 Conclusion & Strategy:
ETHFI is at a make-or-break level. A confirmed breakout could trigger a strong upward rally with high risk/reward potential. However, failure to break resistance could lead to continued consolidation or even downside.
🔍 Traders should watch for a clean breakout above $1.25, preferably with high volume. Risk management is key — define your invalidation levels and stick to your plan.
🧠 Trading Recommendations:
🟢 Breakout traders: Wait for confirmation > $1.25
🟡 Accumulate: Between $0.90–$1.00
🔴 Stop-loss: Below $0.85 for conservative risk
📈 Risk/Reward after breakout: Attractive (1:3 or better)
#ETHFI #ETHFIUSDT #CryptoBreakout #DescendingTrendline #AltcoinAnalysis #TechnicalAnalysis #BreakoutTrading #CryptoSignals #BullishReversal
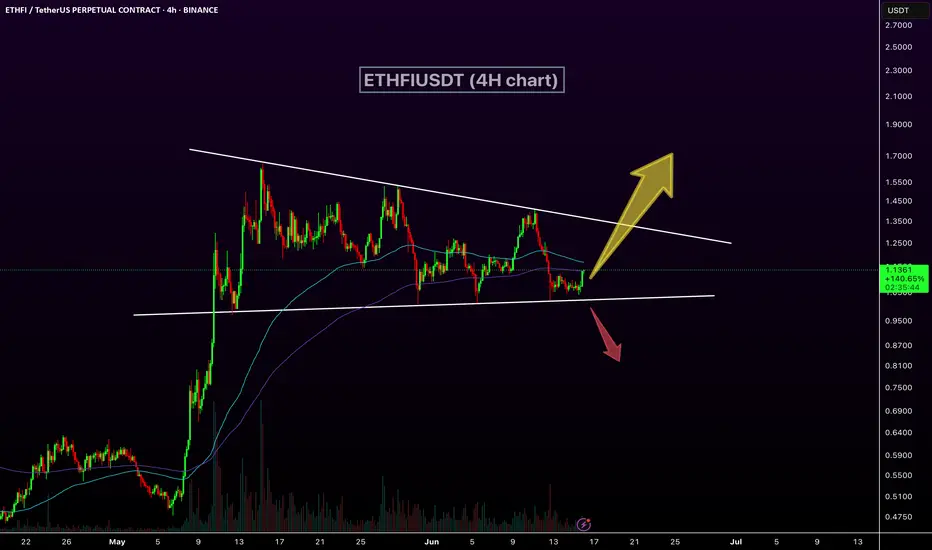
ETHFIUSDT Breakout Loading!CRYPTOCAP:ETHFI is consolidating within a symmetrical triangle on the 4H chart, with price tightening between descending resistance and rising support. A breakout or breakdown is likely soon. Watch for volume confirmation. Key levels to watch: $1.35 (resistance) and $1.00 (support). Breakout could lead to $1.50+, while breakdown risks a drop toward $0.95.
ETHFIUSDT breakdown alertETHFIUSDT breakdown alert
ETHFIUSDT has broken down from a triangle pattern and appears to have completed a retest of the breakdown zone. If the price fails to reclaim this level and continues to reject it, we could see further downside pressure in the coming sessions.
Key levels to monitor:
– Breakdown zone now acting as resistance
– Immediate support below
– Volume confirmation to validate the move
Watch ETHFI closely — if the retest holds, it may lead to continued bearish momentum.

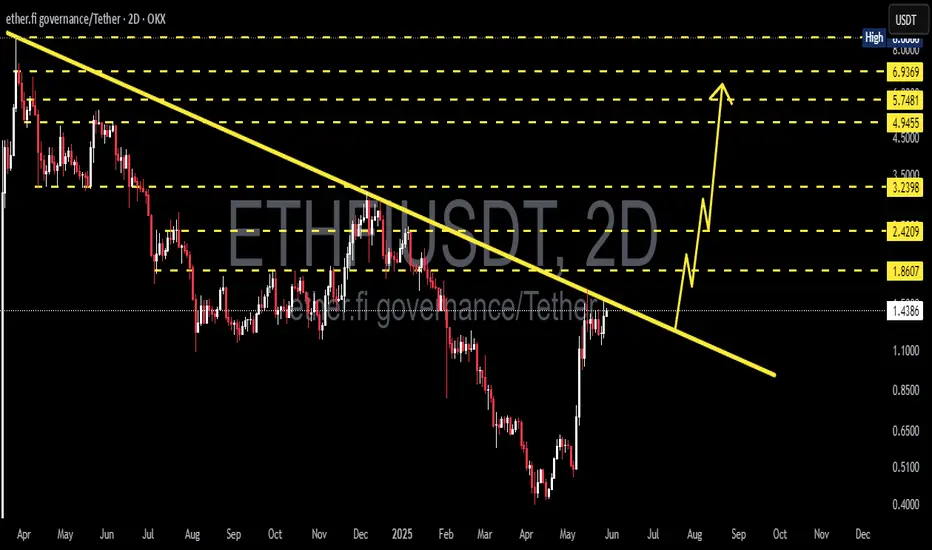
ETHFIUSDT 2D AnalysisETHFI ~ 2D Analysis
#ETHFI Buy after successfully breaking this resistance line with a short term target of at least 15%+ and a long term target of $8.7
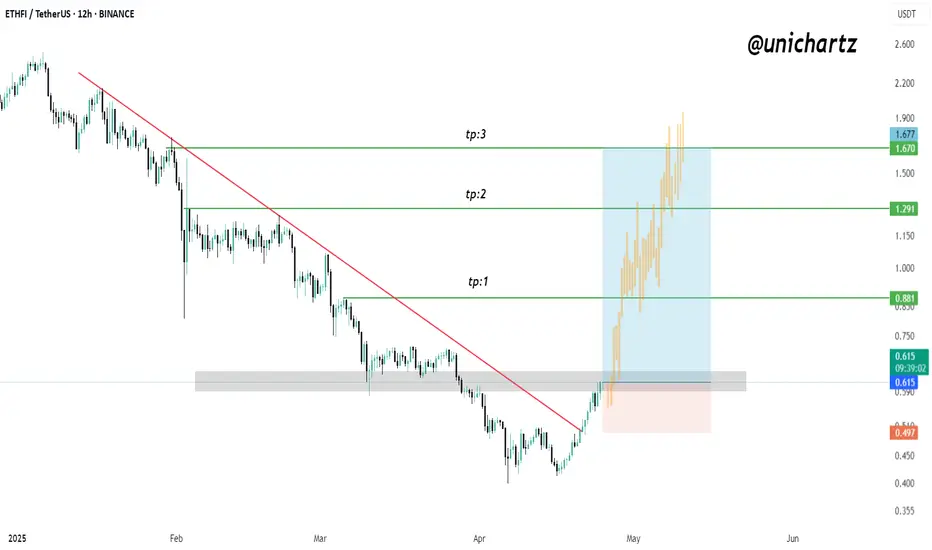
ETHFI Breakout Loading? Targets Up to $1.67!$ETHFI/USDT Analysis
Price is currently trading around a key resistance zone after a strong recovery from recent lows. While momentum looks bullish, the resistance has not been broken yet — making this a crucial level to watch.
A clean breakout and candle close above this zone could confirm a potential rally toward the next targets.
🎯 Upside Targets (if breakout confirms):
TP1: $0.881
TP2: $1.291
TP3: $1.677
📌 For now, stay patient. Let the price action confirm before entering — this zone could act as a rejection point if bulls fail to push through.
DYOR, NFA
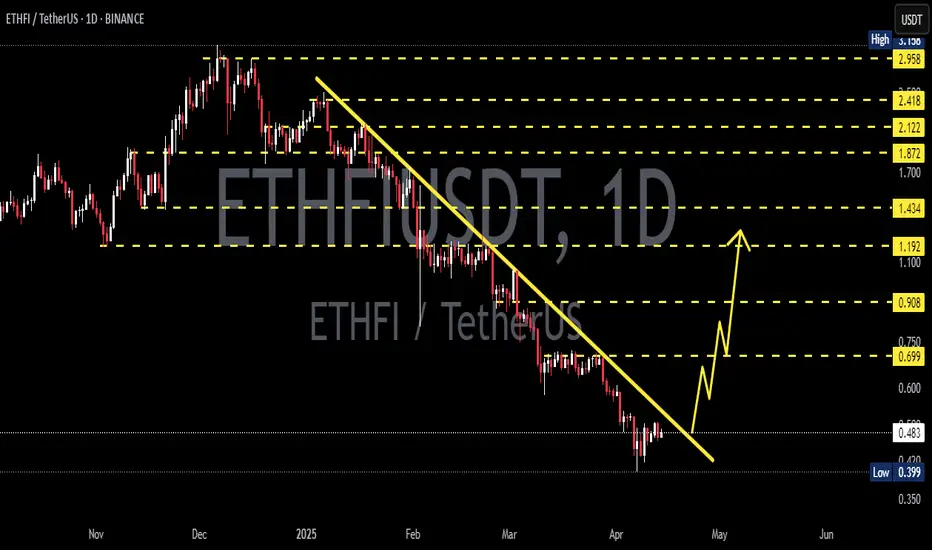
ETHFIUSDT 1DETHFI ~ 1D Analysis
#ETHFI The seller's pressure seems to have begun to decline. Buy after successfully penetrating this resistant line with a short -term target of at least 10%+.
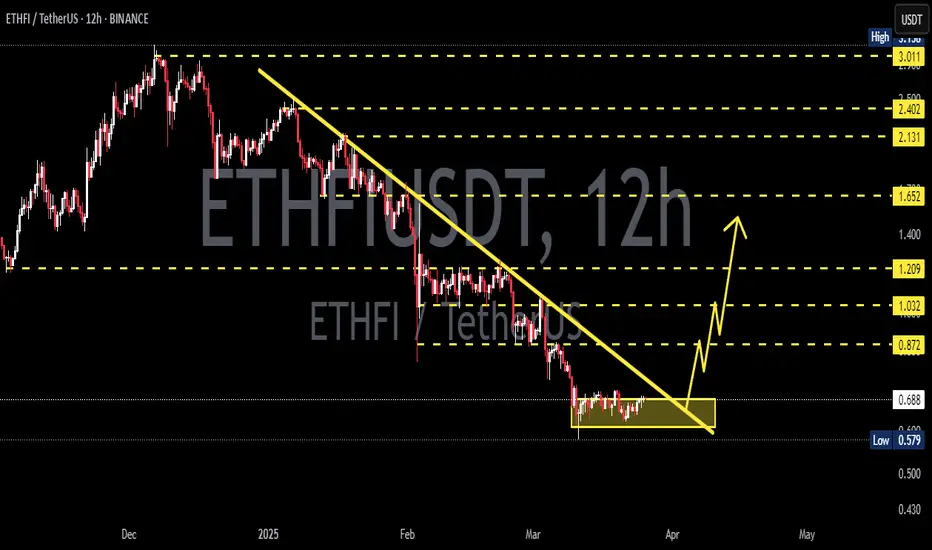
ETHFIUSDT 12HETHFI ~ 12H Analysis
#ETHFI Buy gradually after successfully penetrating this resistant line with a short -term target of at least 10%+.
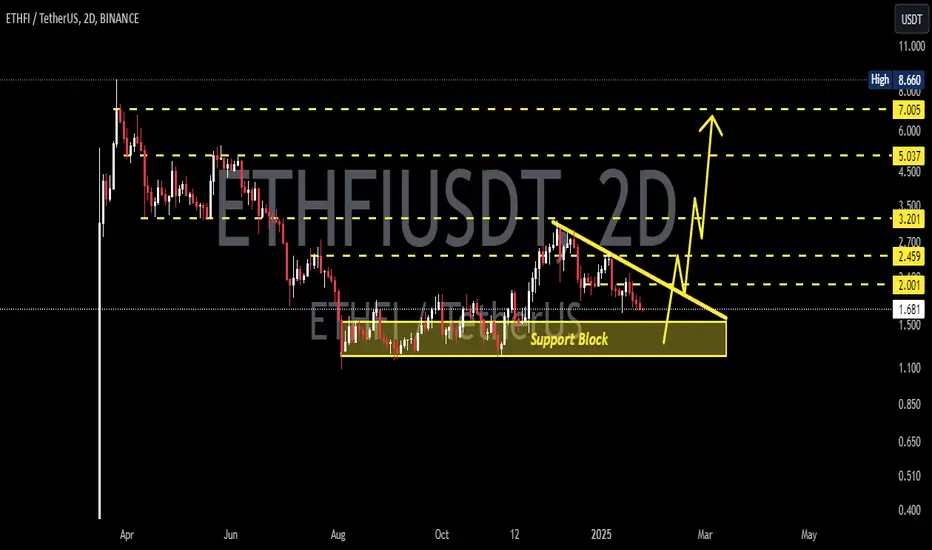
ETHFIUSDT 2DETHFI ~ 2D Analysis
#ETHFI In 2D Time Frame this is the accumulation support block. If you still have Conviction on this coin, buy it from here with a minimum target of 15%++
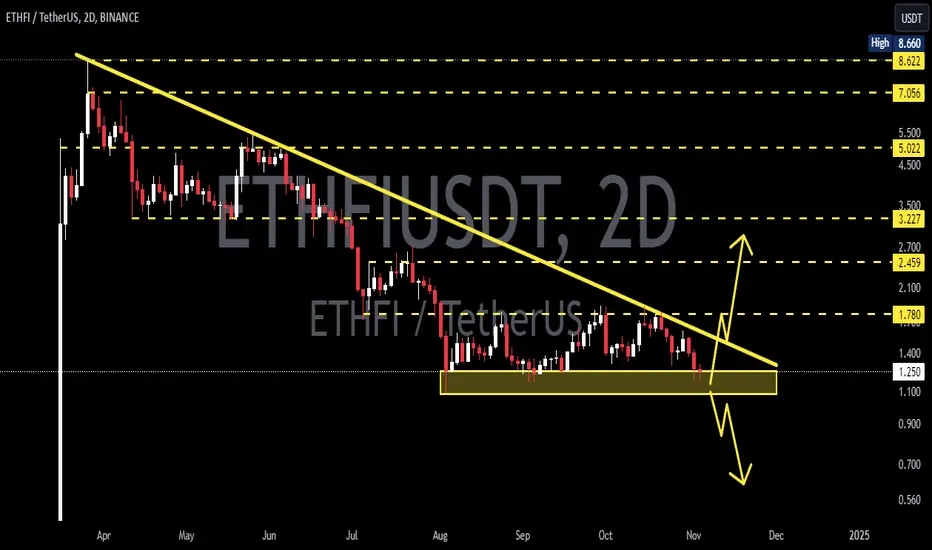
ETHFIUSDTETHFI ~ 2D
#ETHFI Losing this Support Block will bring the price even lower.
The best way to trade this coin. wait until this resistance line is successfully broken and open a buy position or open a short when this support block is successfully broken.
ETHFIUSDTETHFI ~ 1D ✅
#ETHFI So far this support block continues to keep prices from falling further.
✅ If you are an aggressive trader, maybe this is a good time to buy. Or if you want to play it safe. Wait until this resistance line is successfully broken, and start making purchases.

ETHFI/USDT PLAN ETHFI/USDT is breaking out from a significant horizontal resistance level. This could signal a solid upward move in the coming days as momentum builds. Keep an eye on trading volume and any potential pullbacks for entry opportunities. Remember, this is not financial advice; always do your own research (DYOR) before making any decisions.
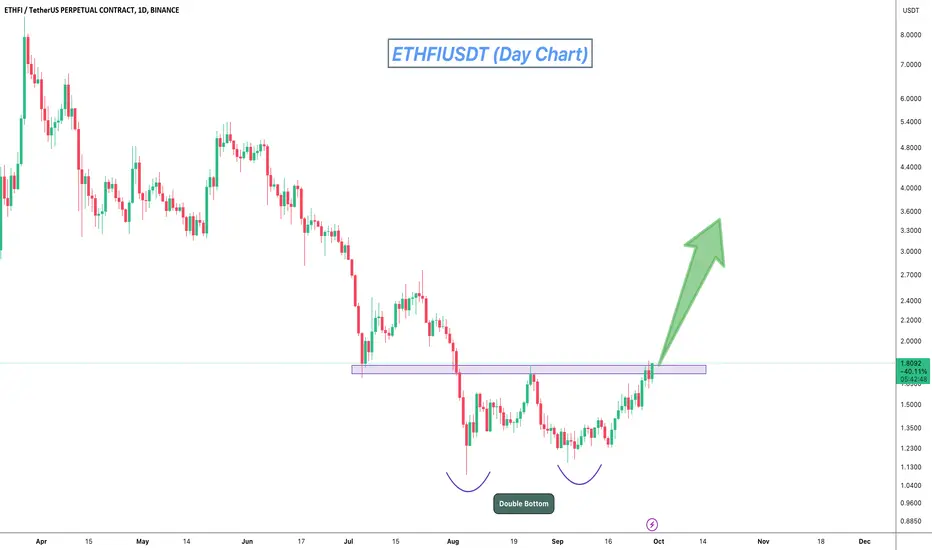
ETHFIUSDT Double Bottom: Preparing for a Strong Bullish MoveETHFIUSDT technical analysis update
ETHFIUSDT has formed a classic double-bottom pattern, indicating a potential reversal in its price trend. This formation, often seen as a bullish signal, suggests that the recent lows have established strong support. As the price approaches the neckline resistance, a breakout could trigger significant upward momentum.
Regards
Hexa
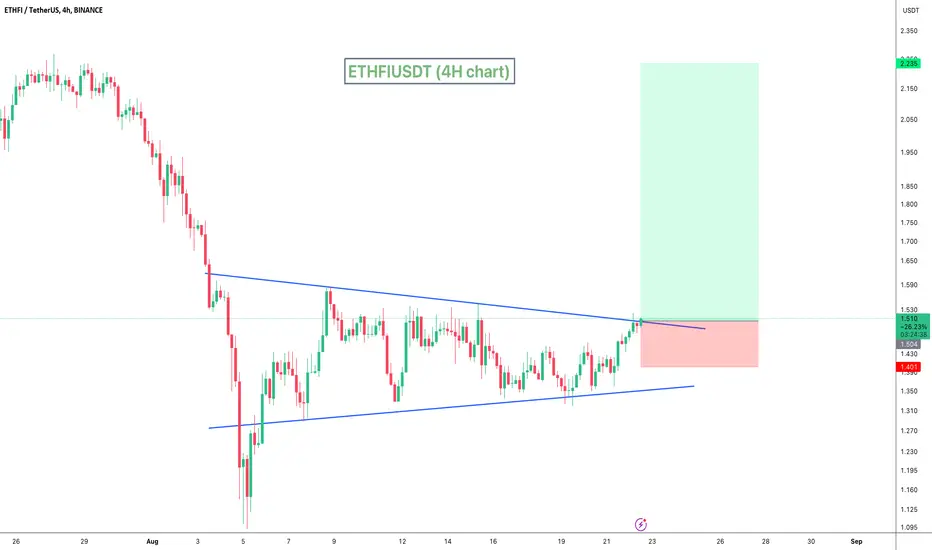
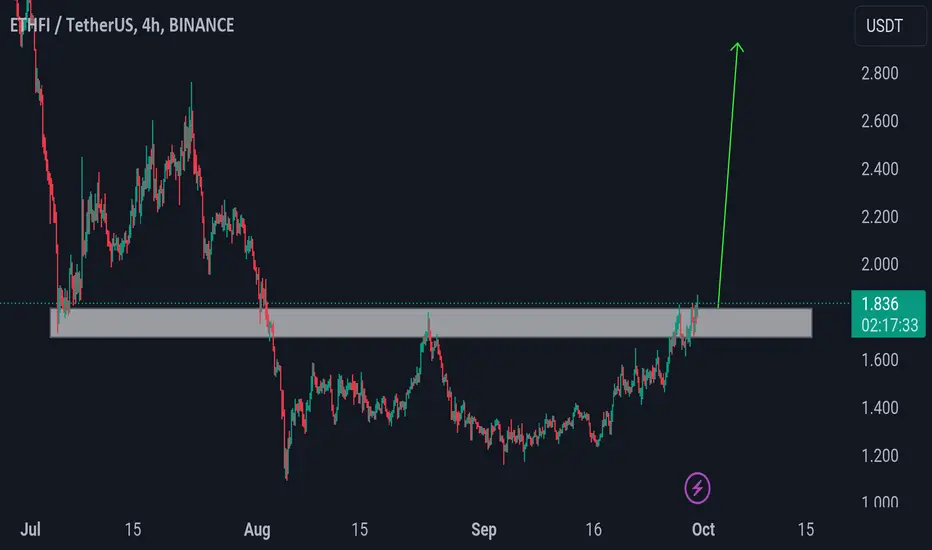
ETHFIUSDT Bullish TriangleETHFIUSDT technical analysis update
ETHFI price has formed a triangle pattern on the 4-hour chart and is moving towards a breakout at the triangle's resistance. Once the breakout is confirmed, we can expect a strong bullish move in ETHFI.
Buy zone : Below $1.51
Stop loss : $1.40
Regards
Hexa