ETHBTC Analysis 08/01/19ETHBTC bounce was short lived as the pair went back on the down road, following its downtrend. We are seeing some oversold signal on stochastic oscillator that let us believe that we could see a rebound in the short term but near resistance keeps capping any attempt to prop this pair up. We expect sellers to short the rebounds along with long covering, targeting the year lows at 0.02 BTC.
Raphaël Comte
Investment Analyst at Token Metrics
Disclosure: Token Metrics is a regular publication of information, analysis and commentary and does not provide individually tailored investment advice. Its principal has advised and invested in many blockchain companies. A complete list of his disclosures, advisory roles and current holdings can be viewed here: ianbalina.com .
Ethforecast

ETHBTC AnalysisContinuing rebound after hit yearly lows at 0.02 btc level which became strong support showing a possible bottom island formation. Oscillating between downtrend and support while volume decrease. No signs of reversal to the upside.
Raphaël Comte
Investment Analyst at Token Metrics
Disclosure: Token Metrics is a regular publication of information, analysis and commentary and does not provide individually tailored investment advice. Its principal has advised and invested in many blockchain companies. A complete list of his disclosures, advisory roles and current holdings can be viewed here: ianbalina.com .

ETHUSD Ethereum NEUTRAL RANGE Trading 1 HR Chart#Ethereum #Bitoin #Litecoin
Hello to all watching my charts.
Since a week Ethereum is trading in a range beween
200/204 and
235
We have to wait what happens next.
Whether the pair falls below support range 200/204 and ist short again
or if it will find bottom now in that range here and comes back to climb above 235 and
startet a new try to higher prices and goes long.
At the moment nothing to do
If you think that this range will last longer (which i doubt at a crypto pair) it would be possible to do a range trading :
buy at 204 , sell at 224 / 234.
But as Ethereum does similar to other cryptos in some cases big jumps
that would be not my first oppinion.
Good tardes
If you want to support my work and my trades please like the,..
Renkotrade

Ethereum (ETH) Bulls Eyeing New HighsYesterday's daily close above the $300 key resistance meant that Ethereum bulls are likely eyeing new highs. That said, the market could see further consolidation within the ascending triangle pattern in the next few days but a test on the upper triangle at $325 - $330 is very likely. Even though this kind of pattern tends to be bullish biased, we should not make any hasty conclusion as the market has yet to solidify its course, which can only be confirmed by a prevailing breakout from the triangle. Until then, there are two things to watch out for:
1. A trend reversal as price protrudes from the upper triangle, as what the sample pattern on the upper right illustrates.
2. A breach below the lower triangle is probably the best time to exit the market.

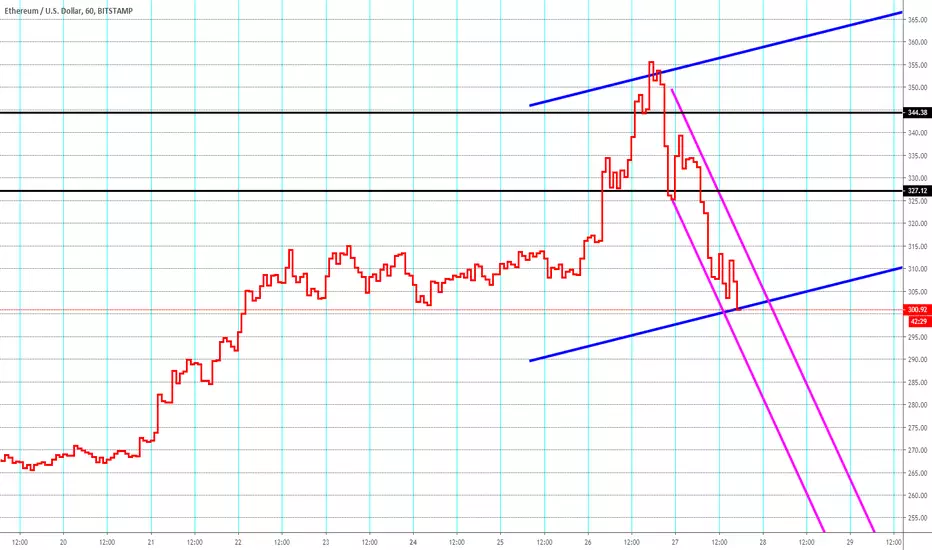
Ethereum ETHUSD SHORT 1 HR Short 2 Supports broken Hello to all watching my charts
Yesterday we talked about the steep steep UP channel
here and now since tonight we got not even a pullback
we got a break of 2 supports and a shortchannelsystem
The second brake has come in at 7.00 am in the morning
today and now we are on a short train here
Right now in this minutes even the great long channel (blue) has been broken
So thats shure a short idea now.
Good trades
If you want to support my work and my charts please like them...
Renkotrade
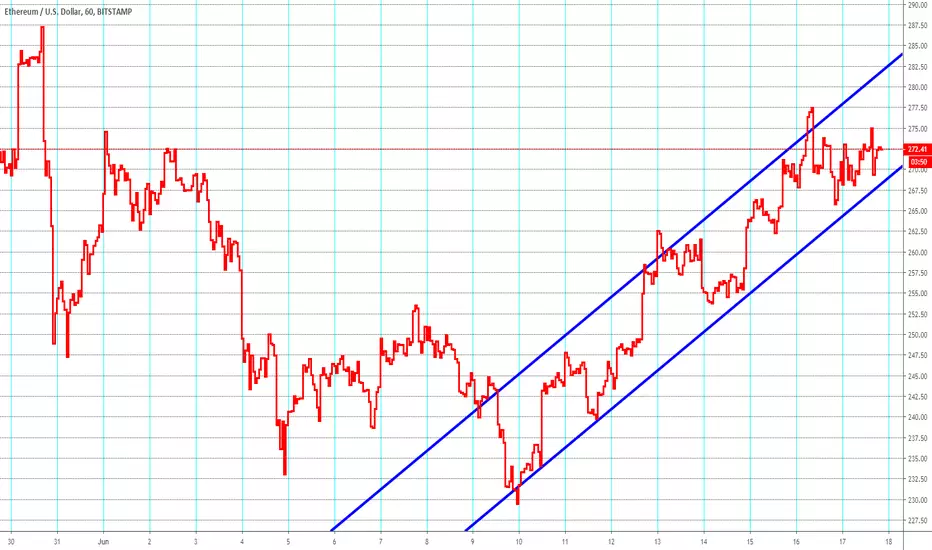
ETHUSD Ethereum LONG 1 HR ChartHello to all watching my charts
Nothing really new to tell you here in this pair.
Its still LONG as you check the purple longchannel of my trading system
What is to mention, that in the short timeframe (blue lines) the power has little
bit lost and the angel in not longer such steep as it has been in the days before
(purple lines )
but in my eyes that just normal after such a rally of nearly 15%.
So be little bit patience and i do hope you are in a long position.
If something will change massive i let you know.
-
If you want to support my work and my charts, please be so kind and like them...
Good trades
Renkotrade

ETHUSD LONG 1HR ChartHello to all watching my charts.
I am starting today a check of Ethereum
and will bring you more Crypto Charts the next time
Why ?
Cause the possibility of trading these pairs in my oppionion has been
dramatically changed to much smaller spreads and daytrading
if wanted , is now possible with positive results.
So lets come back to ETH:
What do we see ?
Its easy:
We have a nice and strong LONG channel
in which the pair is running up.
So run with that in Long diretion so long as the pair continue
in that channel.
I will update you
Good tardes
Renkotrade
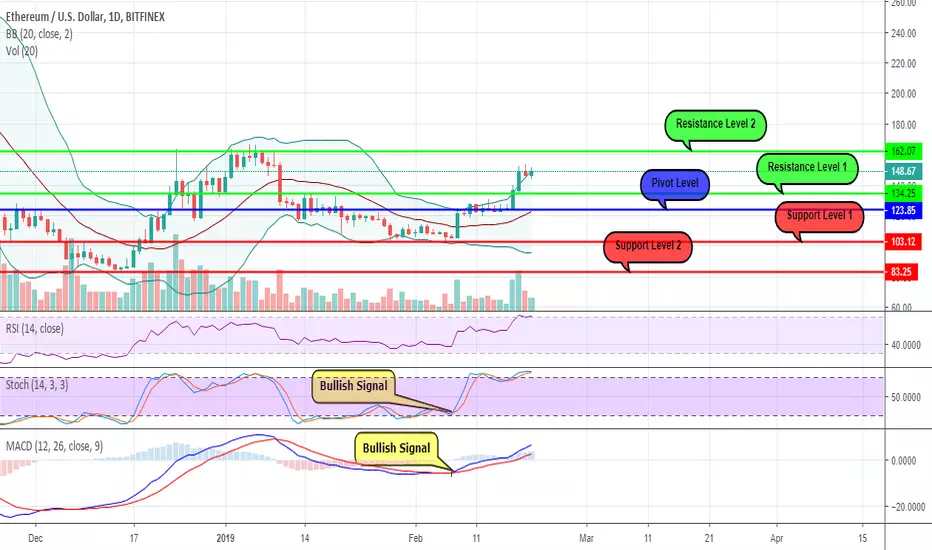
ETHUSD - 1D Chart AnalysisJust like in the case of the other major coins, the price of Ethereum has also managed to position itself above the 20 days Moving Average on the 8th of February, being stimulated by the increased trading volumes after 1 month of losses.
It's important to notice that the indicators which have announced the 45% increase which was registered since then are the Stochastic and the MACD, with both registering a crossovers with one day in advance.
Today, even if the trend is still "bullish", there are few reasons according to which a possible "slow-down" of the price may happen anytime soon :
* The upper standard deviation of the Bollinger Bands has been reached, meaning that the price is considered "overbought";
* The RSI has the level of 70, showing the same as the Bollinger Bands does;
* Both Moving Averages of the Stochastic are above the level of 80 and on top of this, there is also a crossover which was registered today signaling a possible change in the price direction
* The MACD seems to keep it's position at the top of the Signal for now, meaning that the trend has big chances to remain the same.
Based on these circumstances, the main scenario remains the one in which the price will start it's sideways movement before having an attempt of reaching the level of 161$.
On the other hand, if the trading volumes will fail to keep the actual consistency and the MACD will cross the Signal again, it will be a clear indication that the price will drop, with a possible target of 123$.
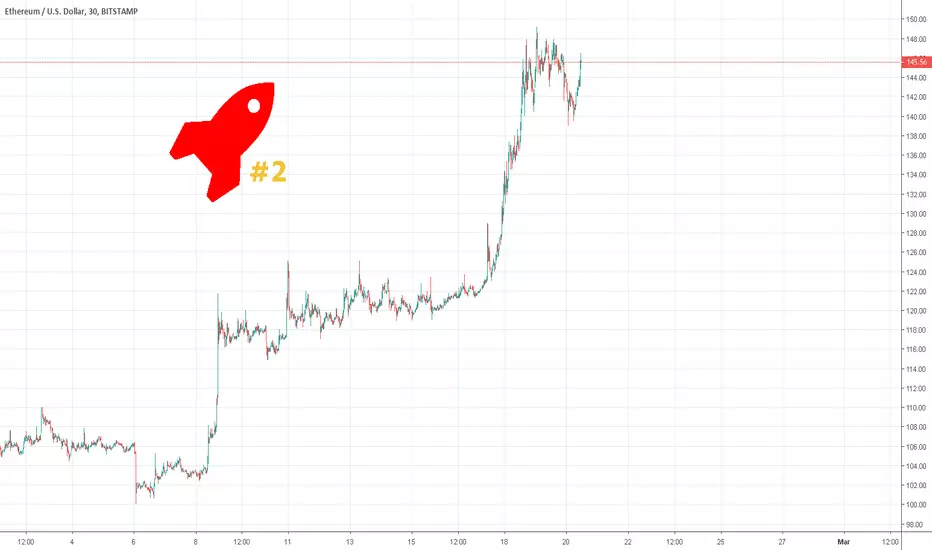
GettingAnotherMillion - Trade #2 - Sell ETHUSDGettingAnotherMillion
Thanks for your LIKE!
Welcome.
Trade #2
-Short ETHUSD at market (~145.94 Bitstamp)
-Take profit: open
-Stop loss: secret (contact me to get it)
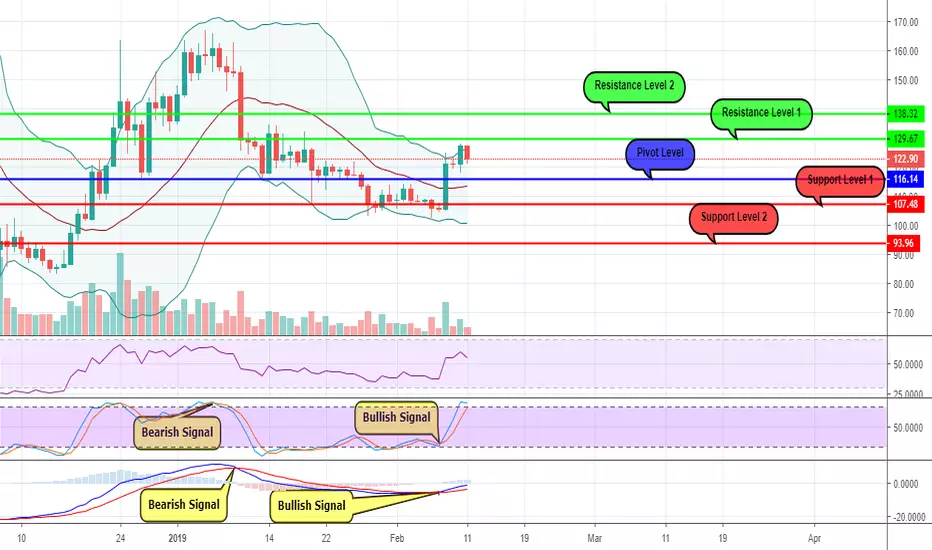
ETHUSD - 1D Chart AnalysisIf we go back in the days in which the whole sector used to go through amazing times, a movement like the one registered by the price of Ethereum on the 8th of February would have had less chances to be considered impressing.
But nowadays, after the market drop we could see in 2018, a price movement from 105$ to 121$ is huge and for sure it brought back some of the hopes.
However, even if the market is very low compared to it's heights, we have to admit that the entire sector keeps it's specifications and remains like a "wild horse" compared to the rest.
After 29 consecutive days of bearish trend, we can easily go back in time and compare the elements which signaled such a period, so we can see if there's anything which can help us in our forecast.
Therefore, on the 6th of January we could see the "fast" line of the Stochastic going below the "slow" one, signaling a potential decrease of the price which eventually happened.
After 4 days of dropping we could see how the price went below the 20 days Moving Average, when the "Bearish" trend has officially started. The cross has been announced by the MACD in the same day as well, with it's Signal line maintaining it's position at the top.
Today, we are 3 days after the 15% increase of the price which was signaled by both of the previous indicators and we have a small contradiction between it as it follows :
* The MACD is still above the Signal, meaning that the bullish trend may continue;
* The "fast" line of the Stochastic is still above the "low" one but as long as these one are about to cross each other it is possible to see a change in the price direction.
* On top of this, the trading volumes are moderate and the RSI is maintaining it's neutral position, meaning that there are small chances to see an aggressive movement.
Based on all these details, we have 2 possible scenarios :
1. The price will start moving sideways between the Pivot Level and the Resistance Level 1, consolidating it's position, with the possibility of going towards 138$ for the upcoming days
2. After the period in which it will move sideways, the price will go below the Pivot Level with a possible target at 107$.
Considering the low level of the trading volumes, we are tempted to say that the 2nd scenario has bigger chances to be caught off.
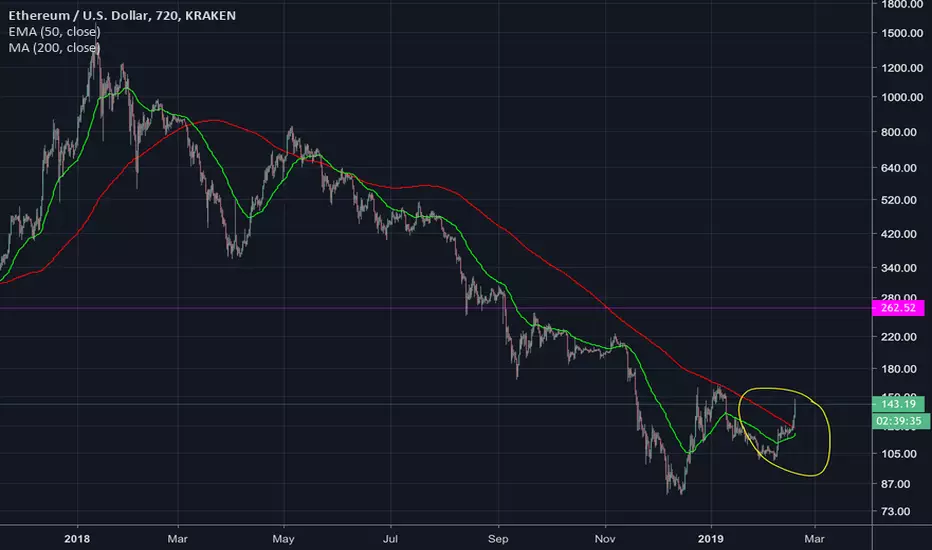
ETH/USD: Golden Cross on 12 hr ChartETH/USD is about to have a Golden Cross on the 12 hr chart. Let's see if this signals a major momentum change and we start to see ETH head upwards past $200 and beyond. This indicator if realized could identify a great time to add to LONG positions for ETH.
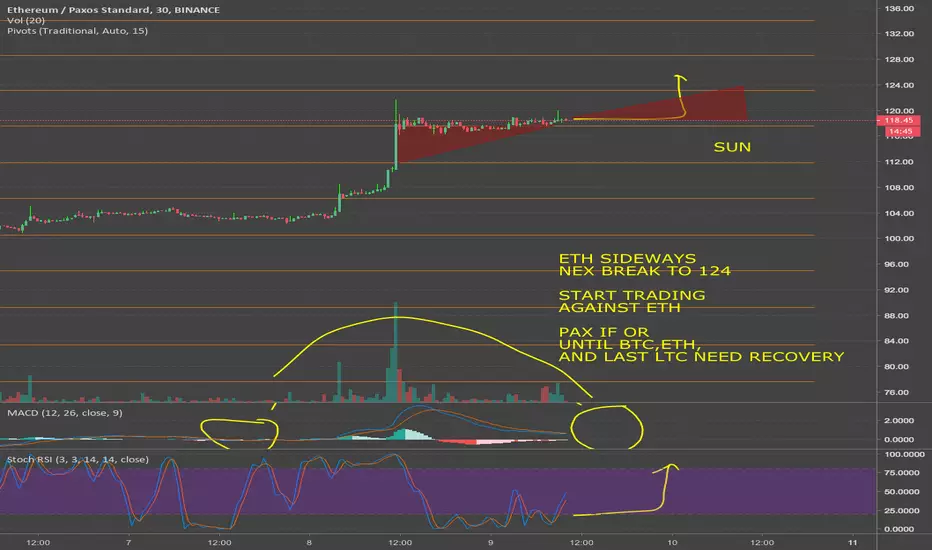
ETH/PAX (IDEA) NEXT BREAK 124?
TRADE SIDEWAYS NEX BREAK TO 124?
POTENTIALLY LOOKING FOR BETTER ENTRY PRICE AFTER HARDFORK.
THE TIME MAYBE CLOSER THAN THAT TO HOLD ETH FOR 2019 EOY
TRADESAFE. TRADESTABLE.
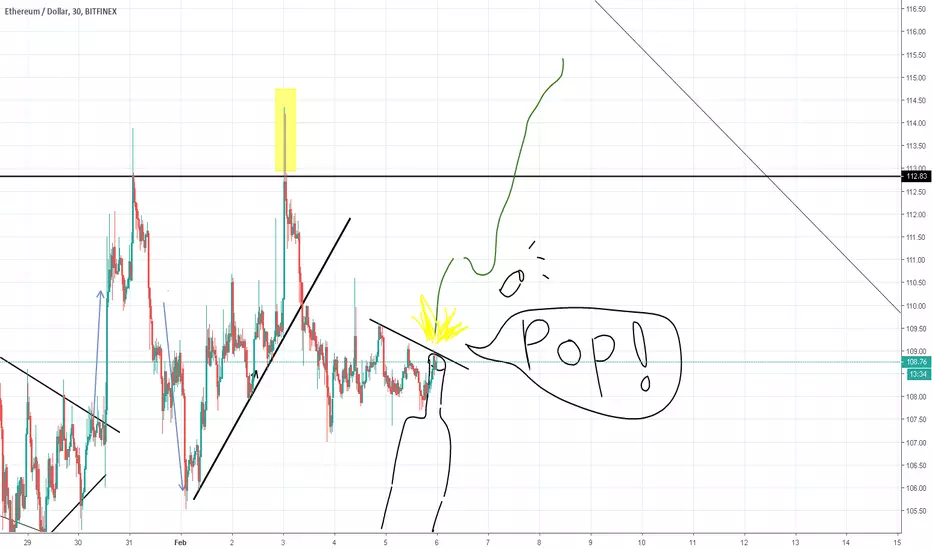
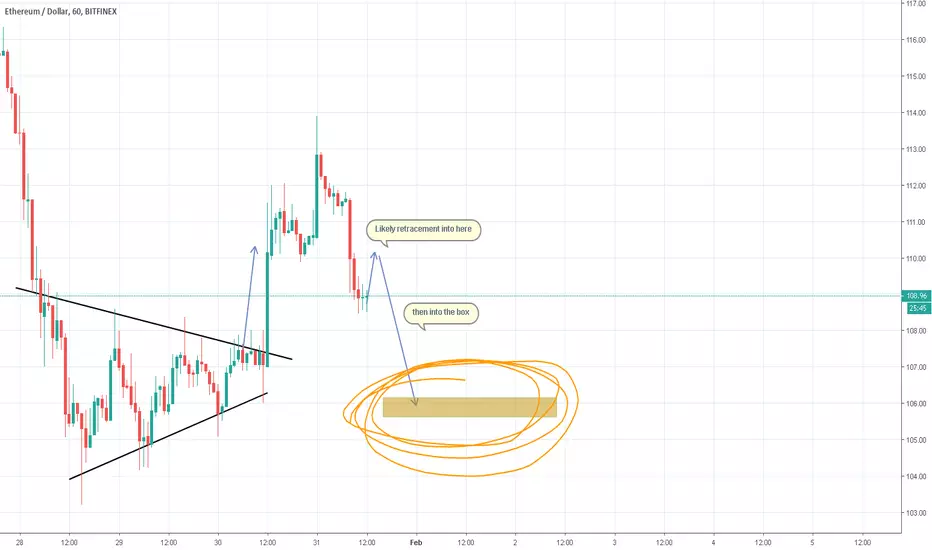
Short Ethereum | ETHUSD | The BoxSelling Ethereum into the box.
All my trades were very precise like no other. Have you seen anyone else better? Doubt it. (Have been working around the clock for you and barely slept.)
Likes are appreciated. Thank you!
If you don't want to miss a trade, follow me. (Or ask for my management & never miss a trade)
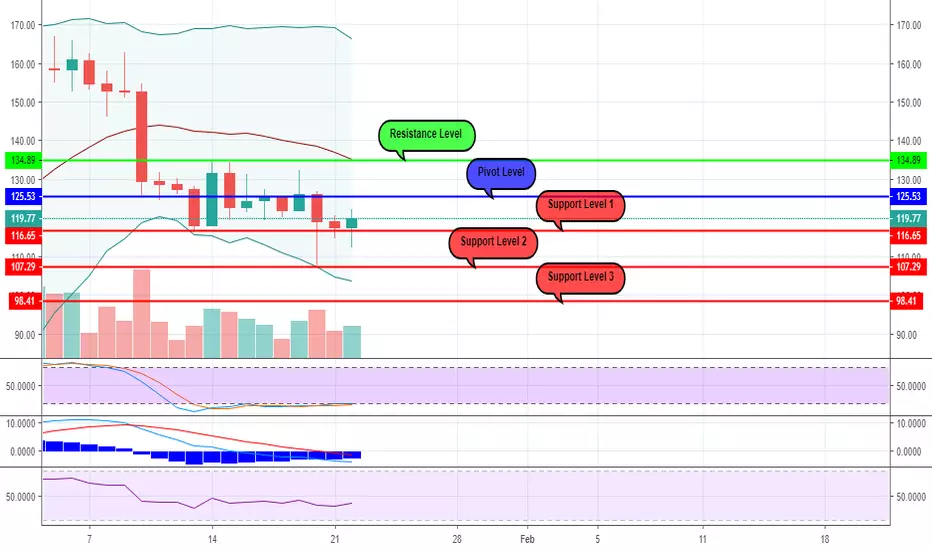
ETHUSD - 1D Chart AnalysisAs we have mentioned on the previous post about Ethereum, the price has registered a bearish trend since the 10th of January, once it crossed and stabilized below the 20 days Moving Average, with it's daily range movements decreasing as well.
Like before, the RSI and the Stochastic still have "oversold" positions and on top of this, we can also add the position of the price close to the lower standard deviation of the Bollinger Bands which is indicating the same possible "correction".
But, as long as the MACD will stay below the Signal it is possible to see a continuation of the sideways movements, rather than a consistent price increase, with an attempt of "breaking" the level of 100$ in the following days.
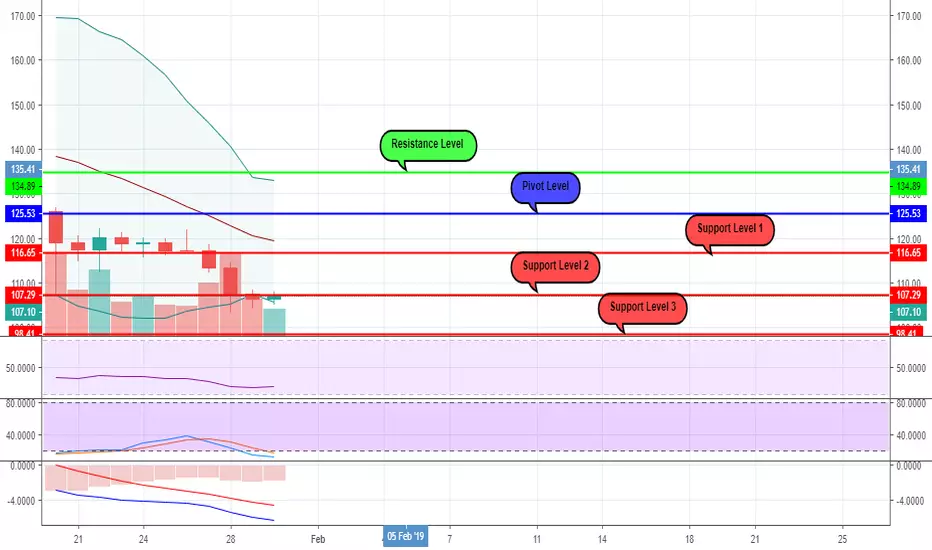
ETHUSD - 1D Chart AnalysisSince the 10th of January, once the price has crossed the 20 days Moving Average and the Bearish trend on a daily chart has begun, the price of Ethereum has registered 12 consecutive days in which it has been moved sideways with an average daily movement of 11.2$.
At this stage, it is traded below the Pivot Level (Average Price) of 125.53$ and it also had 2 consecutive failed attempts of finishing the day below the next support level of 116.65$.
On top of this, the RSI and the Stochastic have "oversold" positions which in these circumstances can be interpreted as a continuation of the sideways movement, confirmed as well by the MACD which is still below the Signal.
If the trading volumes will remain at the same level, we can consider 107$ as a possible target price for the following days.
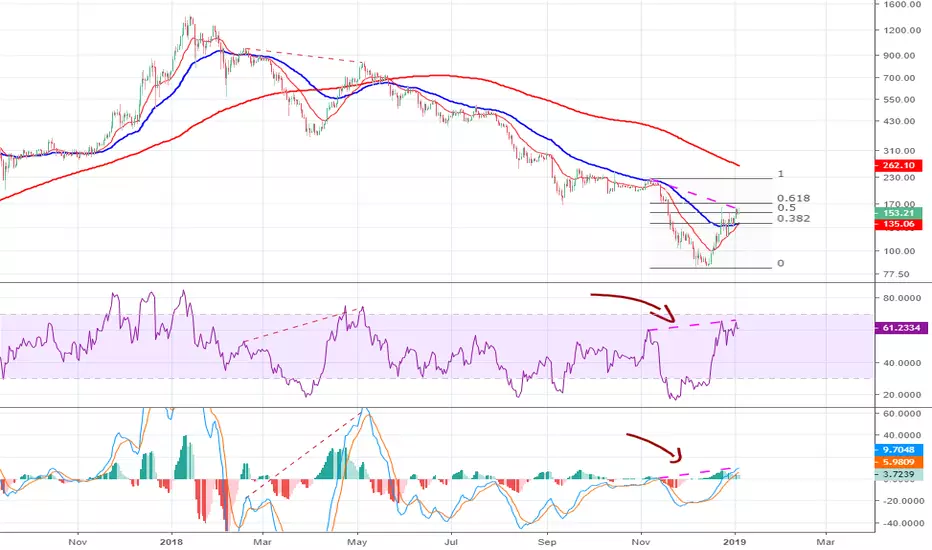
ETH.USD D1 SHORTAfter 20 days healthy correction it will continue its bearishness, still price has not tested Fib level 618 indicating that correction has not finished yet, but RSI and MACD showing divergence indicates that even though MA are crossing to mark a possible trend change, price action will continue down-trending. Time for shorting position or or closing to take profit.
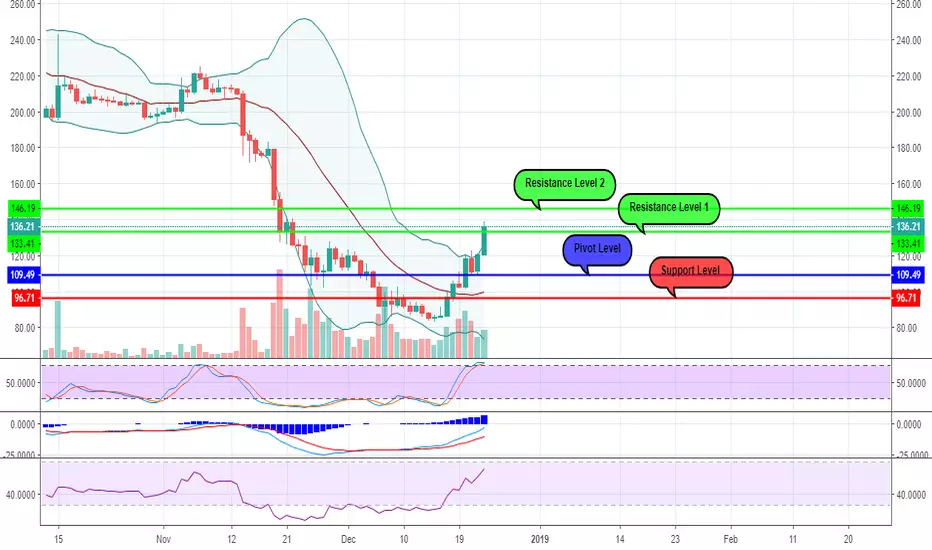
ETHUSD - 1D Chart AnalysisBased on the market capitalization which has started to recover from the ground which was lost, the Ethereum also followed the rest of the coins and it's price has increased with 64.21% since the 14th of December (from 82.99$ to 136.28$).
The bullish trend has "officially" started on the 18th of December, as soon as the price has crossed the 20 days Moving Average at the value of 109.49$ and in the meantime the price has also reached the upper standard deviation of the Bollinger Bands, meaning that the price got close to the "overbought" area.
Looking to the other technical indicators we can see that the RSI is only 61, the Stochastics are above the level of 80 but there is no crossover yet and also the MACD is still above the Signal, meaning that there is still more room for the price to increase.
In these circumstances, as long as the trading volumes will remain the same, the next level which can be considered a cautious target price for the following 1-2 days is the Resistance Level 2 at 146.19$.
ETHUSD - 1D Chart AnalysisOn the 14th of November, the Ethereum's price has started to decrease aggressively based on the massive sell-offs and it has also crossed the 20 days Moving Average, which from the technical perspective represented the beginning of a bearish trend.
It's important to notice that this trend change has been clearly signaled by 2 technical indicators :
* The "fast" line of the Stochastic has bounced back from the level of 55, showing a change of the price direction;
* The MACD went below the Signal, confirming the trend which was about to start.
Another important day was the 18th of December when the price has crossed back the 20 days Moving Average and the bullish trend has started. Like on the previous time, this crossover was signaled in advance by the same 2 technical indicators.
Today, Ethereum is traded around the Pivot Level which represents the average price for this interval.
But from the technical perspective, there are 4 reasons to consider a possible retrace of the price, as it follows :
* The Stochastic has registered a "Crossover" on the 6th of January and the price has started to decrease slowly since then;
* The MACD is about to go below the Signal, showing the possibility of another bearish trend to begin;
* The trading volumes are decreasing;
* Based on the principle according to which any aggressive "impulse" of the price is followed by a "correction" of around 45%, we can expect Ethereum to drop with another 32$.
If this scenario will get caught off, we can consider a target price of around 120$ for the following days.

ETH: Watch This Trend Line Before SHORT !!ETH Currently Supporting a trend line if this Trend Line Breakdown then we can do SHORT, Otherwise Continoue For LONG.
After Breakdown we can SHORT upto target 100$.
Otherwise Continoue LONG Upto 180$.
Let see what Will be Next Move.
Warning- I m Not a Financial Advisor this idea Only For Educational Purpose Only.
Thank You !!

ETH: Ethereum Trade Setup 125$ Possible !!Trade Setup Medium term Same as well as My Preveius Bitcoin Forecast -
Warning- Trade own Risk reward Ratio

ETH : Ethereum SHORT Trade Setup !!You Can Trade For SHORT if you are Doing Trade in ETH .
See Full Chart For Target Point and Enrty Points EveryThings.
Set Stop Loss own Risk Reward Ratio.
Warning- I m Not a Financial Advisor this idea Only For Educational Purpose Only.
Thank You !!

Ethereum : ETH First Buy at 100$ Then Sell 2000$ !!I m Bullish For Longer Term But We Need More Correction Around 100$.
Share Your Opinion in Comments.
if You Satisfied With My idea Then Dont Forgot To Hit Like.
Warning- I m Not a Financial Advisor this idea Only For Educational Purpose Only.
Thank You !!
