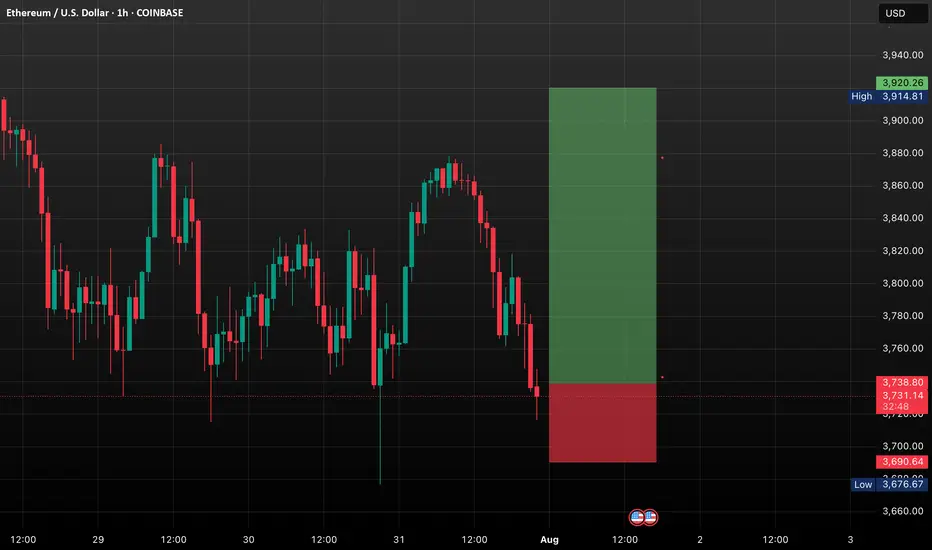
ETH BREAKOUT IMMINENT?Ethereum is currently trading around $3,726, holding just above key support levels, including the 50-day SMA and the psychological $3,700 zone. Despite a minor pullback, ETH continues to show signs of bullish strength and remains in a healthy uptrend.
Momentum indicators like RSI and volume show signs of recovery, and ETH is forming a bullish continuation pattern near resistance. If Ethereum can break above the $3,820–$3,850 zone, we are likely to see a quick push toward higher levels.
Ethereum is showing solid strength after consolidating above $3,700. The breakout attempt toward $3,850 will be critical. If bulls push through this level with volume confirmation, a move toward $3,900 and then $4000 becomes highly probable.
The market structure is constructive, and the presence of ETF-driven institutional demand adds further bullish pressure. While short-term volatility may create minor pullbacks, the medium-term setup favors upward continuation.
Ethreum
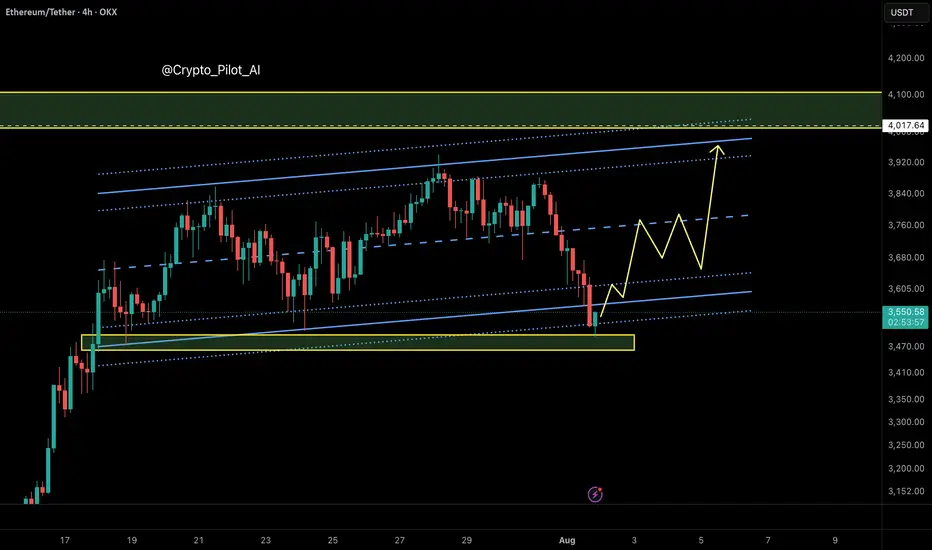
Ethereum: Smart Money Reversal After Stop Hunt?In the previous update, we warned that Ethereum might drop lower before any meaningful bounce — especially if it failed to hold the midline of the ascending channel. That scenario played out exactly as anticipated.
🟡 Price action summary:
ETH broke below the midline of the weak ascending channel, hunted the liquidity below recent lows, and tapped into the key bullish order block near $3,490 – $3,520. Price is now reacting to this zone with early signs of a reversal.
📌 Key observation:
Midlines of weak or low-momentum channels often act as liquidity traps in smart money models. Buying at these levels can be extremely risky — especially during corrective or distribution phases.
⸻
📚 Educational Note:
Never enter long positions solely at the midline of a weak ascending channel, especially when there’s a high probability of liquidity sweep below. Smart entries usually occur at order blocks formed after stop hunts.
⸻
🎯 Next steps:
Wait for confirmation (such as internal BOS or FVG closure) before entering longs. The structure suggests a potential move back toward the upper boundary of the channel if this OB holds.
⸻
🔗 Save this analysis and share it with fellow traders.
💬 Thoughts? Drop your view in the comments.
ETHUSDT.PIf you look at the chart, you will notice an uptrend that has somewhat lost its strength and we may not be able to hit higher highs like the next strength in the next move.
Support: 3.660 - 3.590 - 3.160
Resistance: 3.900 - 4.260
Entry: 3.700
SL: 3.500
TP: 4.240
Please control risk management.⚠️

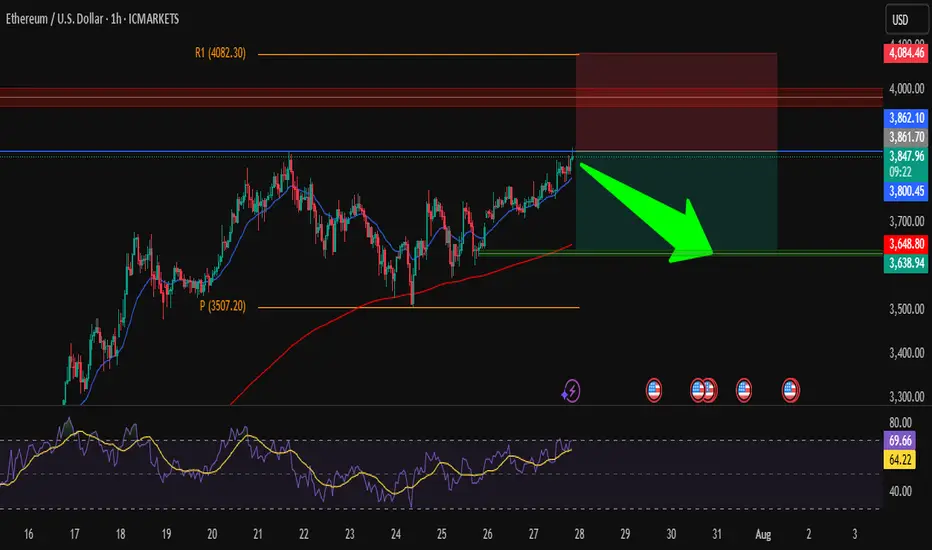
ETH/USD – Short from ResistanceHi traders ! , I opened a short position on ETH/USD as price is hitting a strong resistance zone.
Entry: 3850
SL: 4084.46
TP: 3638.94
📌 Why I took this trade:
Price is testing a strong resistance zone around 3860, RSI is overbought, and we could see a pullback toward the support area around 3640.
Nice risk/reward setup, keeping it simple.
This is just my analysis, not financial advice.
What’s your view — drop or breakout?
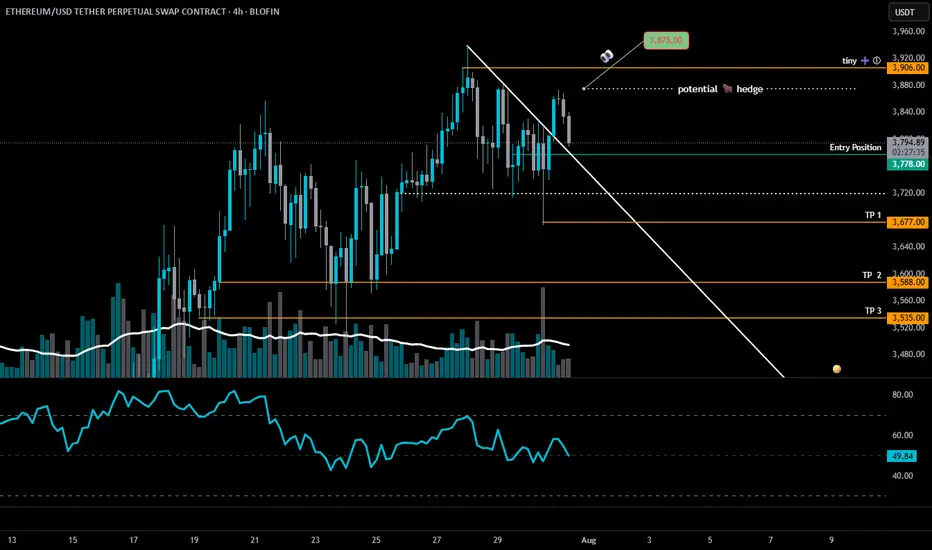
ETH is at a critical inflection pointETH 4H – Decision Time 🧠🐂🐻
Ethereum’s dancing on the edge of a blade.
📍 Entry: $3,778 (Short)
🧪 Next Add: Tiny at $3,906 (updated)
🚨 Major Add: Above $4,100 (TBD)
⚠️TP 1: $3,677 (updated)
We’ve broken the downtrend line — bullish on paper — but ETH is stalling right near resistance at $3,875. If bulls don’t show up with volume and conviction, this move fizzles out fast.
Here’s the playbook:
🔸 $3,875 = key battle zone
— Reclaim it clean (4H close + volume) = "short-term" bear bias invalid (◘reread◘)
— Failure = likely drop to $3,677 → $3,588
🔸 $3,720 = swing short confirmation if broken
🧩 If bulls win $3,875, I keep the short but hedge with a long. Because if the herd’s charging uphill, they might lead us to gra$$.
Momentum is king. No follow-through = fakeout top.
Let the chart breathe.
LOW LEVERAGE POR FAVOR!
Stay Sharp. Stay nimble. 🎯
100% not financial advice, for edutainment purposes only!
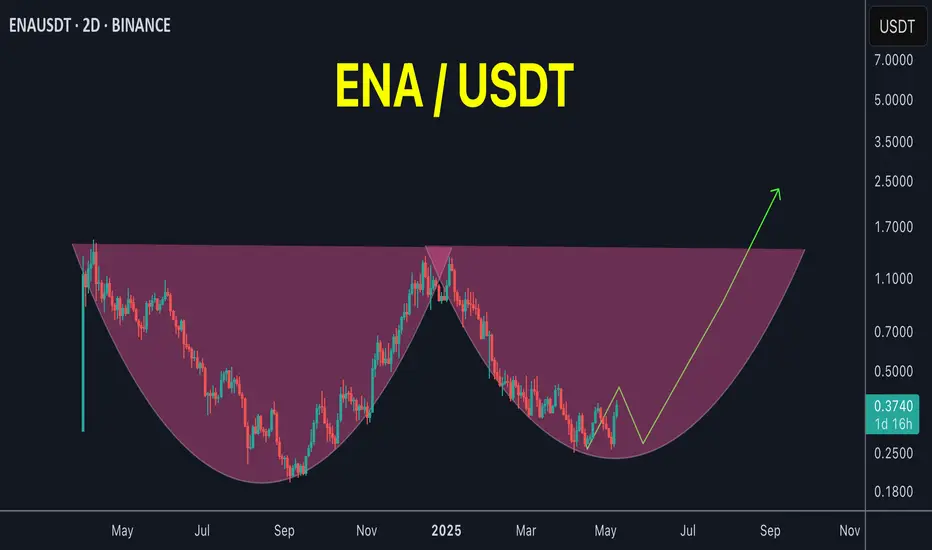
ENA / USDT#ENA / USDT
Iam expecting big returns from ETH and its related coins in this season
This chart is also looking good
Another Potential round bottom pattern under formation
Keep an eye
ETHUSD Long Setup: Targeting $4,000 After Bullish Reversal from ETH just swept the previous lows near $3,650–$3,700, clearing liquidity and flipping that zone into fresh support. This classic price action move often precedes expansion, and ETH looks primed for a continuation toward $4,000 in the coming sessions.
🧠 Technical Analysis
Previous Highs Swept: ETH took out the prior highs around $3,650–$3,700, trapping late shorts and grabbing liquidity.
Break of Structure: We've seen a clear bullish market structure form on the 4H and daily TFs, with higher highs and higher lows intact.
Support Zones:
$3,650–$3,700 (former resistance, now flipped support)
$3,550 (consolidation base before breakout)
Resistance Zones:
$3,950–$4,000 (psychological level + previous 2024 highs)
$4,100+ (weekly imbalance and potential extension zone)
Now that ETH has cleared short-term liquidity and confirmed demand on the retest, the path of least resistance appears to be up.
🔍 Fundamental Outlook
ETH ETF Narrative: Market anticipation for spot ETH ETF approval is heating up, boosting demand and institutional interest.
Reduced Sell Pressure: With the Shanghai upgrade long behind us, staking continues to increase, reducing circulating supply.
Macro Tailwinds: Risk-on sentiment in the broader market is aiding crypto momentum, especially for large-cap assets like ETH.
🎯 Target: $4,000
📉 Invalidated Below: $3,550 (if reclaimed by bears, invalidates bullish thesis)

3 Key Catalysts Driving the Next ETH Bull Run
A remarkable confluence of powerful market forces is brewing in the Ethereum ecosystem, fueling increasingly bold outlooks for its future valuation. A potent combination of historical price patterns, dramatic supply dynamics, soaring institutional interest, and resilient price action is painting a picture of a digital asset potentially on the verge of a historic expansion. While a target of $20,000 may seem audacious, a granular look at the underlying mechanics reveals a compelling, multi-faceted argument for a significant upward repricing of Ethereum (ETH).
This deep dive will explore the four key pillars supporting this optimistic outlook: a striking historical price pattern that mirrors Bitcoin’s monumental 2021 surge, a critical supply shock evidenced by a mass exodus of ETH from exchanges, record-breaking institutional engagement in the futures market, and a tenacious price strength holding firm at key technical levels.
Chapter 1: The Bitcoin Fractal: Is History Rhyming?
In financial markets, history rarely repeats itself exactly, but its patterns often rhyme. Market analysts are increasingly pointing to a "fractal"—a recurring geometric pattern in price action—that suggests Ethereum's current market structure is eerily echoing that of Bitcoin's in late 2020, just before its parabolic surge in 2021.
This analysis highlights that Ethereum's chart is displaying a nearly identical pattern of accumulation, re-accumulation, and price compression that Bitcoin exhibited before its own historic breakout. During that period, Bitcoin experienced a multi-fold increase in value, shattering previous records. The parallel suggests that, much like Bitcoin did, Ethereum has emerged from a prolonged consolidation phase and is now pressing against a long-term downtrend resistance line that has defined its market structure for several years.
Should this fractal play out as it did for Bitcoin, a decisive breakout above this critical resistance could trigger a rapid, exponential move upwards. The potential for such a climb is being fueled by a perfect storm of institutional adoption and favorable market shifts.
A critical catalyst underpinning this parallel is the recent launch and explosive growth of spot Ethereum Exchange-Traded Funds (ETFs). The 2021 Bitcoin bull run was significantly propelled by growing institutional legitimacy and new, regulated investment vehicles. Similarly, Ethereum ETFs are now providing a secure and accessible gateway for a fresh wave of institutional capital. These funds have already seen staggering net inflows, with major asset management firms accumulating billions in assets, signaling deep conviction from the titans of traditional finance. This institutional stamp of approval is a powerful parallel to the forces that drove Bitcoin's last major cycle, providing the foundational capital flows needed for a sustained rally.
Chapter 2: The Great Supply Squeeze: A Mass ETH Exodus from Exchanges
One of the most compelling bullish arguments for Ethereum is rooted in fundamental on-chain economics: a dramatic and accelerating supply squeeze. The "Exchange Reserve," a metric that tracks the total amount of ETH held in the wallets of centralized exchanges, has plummeted at an astonishing rate.
In a recent one-month period alone, well over one million ETH were withdrawn from these platforms. This mass exodus of coins is a profoundly bullish indicator. When investors move their assets off exchanges, it typically signals an intention to hold for the long term in self-custodial wallets, rather than keeping them liquid and ready for a quick sale. This behavior drastically reduces the immediately available supply on the open market. Consequently, even a steady level of demand can exert significant upward pressure on the price.
This trend has pushed the total supply of Ethereum on exchanges down to its lowest level in nearly a decade. The drivers behind these massive withdrawals are multifaceted and all point toward a tightening market:
• Long-Term Conviction and Staking: A growing number of investors are locking up their ETH in staking contracts to help secure the network and earn passive yield. Others are simply moving their holdings to secure "cold storage" with a long-term investment horizon, effectively taking them off the market for the foreseeable future.
• DeFi Integration: A significant and growing portion of ETH is used as the primary form of collateral within the sprawling Decentralized Finance (DeFi) ecosystem, where it is locked into smart contracts for lending, borrowing, and other financial applications.
• ETF Accumulation: The newly launched spot ETFs are required to purchase and hold real ETH to back their shares. This direct accumulation removes vast quantities of ETH from the circulating supply that would otherwise be available to retail and institutional buyers.
This fundamental imbalance between a shrinking available supply and growing demand is creating the perfect conditions for a potential "supply shock." The sustained decline in exchange reserves, even as prices have rallied, reinforces the idea that current holders are not rushing to take profits. This indicates a strong belief in future price appreciation and adds a powerful layer of underlying support to Ethereum's macro bullish structure.
Chapter 3: The Wall of Institutional Money: Futures and Open Interest Soar
The derivatives market, often seen as the playground for more sophisticated and institutional investors, is flashing its own set of glaringly bullish signals. Open Interest (OI) in Ethereum futures—representing the total value of all outstanding futures contracts that have not been settled—has surged to unprecedented levels.
On major regulated exchanges favored by institutional investors, Ethereum futures Open Interest has recently shattered all-time highs. This represents a massive and undeniable increase in institutional participation, as asset managers, hedge funds, and other large-scale players use these regulated products to gain exposure to ETH's potential upside and to manage their risk. This is not an isolated phenomenon; across the global landscape of exchanges, the total Open Interest for Ethereum futures has climbed to record-breaking heights.
Rising Open Interest that occurs in tandem with a rising price is a classic technical confirmation of a strong and healthy trend. It demonstrates that new money is actively flowing into the market, with participants expressing confidence in future price appreciation. This influx of capital adds significant fuel to the ongoing rally. The surge in derivatives activity highlights a maturation of the market, where both institutional and retail investors are increasingly using sophisticated financial instruments to speculate on Ethereum's price trajectory.
While the high levels of leverage inherent in futures trading can introduce volatility and the risk of cascading liquidations, the primary signal is one of immense and growing institutional conviction in Ethereum's medium-to-long-term outlook. The influx of capital into both spot ETFs and the futures market creates a powerful, self-reinforcing feedback loop, enhancing liquidity, legitimizing the asset class, and attracting even more conservative capital off the sidelines.
Chapter 4: The Immediate Battleground: Price Action Shows Resilient Strength
Zooming in from the macro-outlook to the short-term technical picture, Ethereum's price action has demonstrated notable resilience, reinforcing the broader bullish thesis. After a strong rally, the price has been consolidating its gains, establishing critical support zones that traders and algorithms are watching with keen interest.
Recent price action shows Ethereum starting a fresh increase above the $3,820 and $3,880 levels. The price is trading near the crucial $3,800 mark and the 100-hourly Simple Moving Average, an indicator that often acts as a dynamic line of support during uptrends. Although there was a brief break below a key bullish trend line that had formed with support at $3,800 on the hourly chart, the ability of the price to remain supported above the broader $3,720 zone is considered vital for a bullish continuation. Should the pair remain supported above this zone in the near term, it could start a fresh increase.
The price has recently faced resistance near the $3,900 and $3,920 levels. The psychological $4,000 barrier remains the next major target. A decisive and sustained break above the $4,000 mark could open the door for a rapid advance, as it would clear the last major resistance area before a potential retest of previous all-time highs.
Technical indicators on higher timeframes remain robust. The price is in a clear long-term uptrend, trading well above its key daily moving averages. While short-term indicators may show temporary overbought conditions or moments of waning momentum, the overall market structure remains decisively bullish as long as critical support levels continue to hold.
Conclusion: A Compelling Case for a New Era of Price Discovery
The prospect of Ethereum reaching a valuation of $20,000 is a monumental forecast, but it is one built on a solid and multi-faceted foundation. The convergence of a compelling historical fractal mirroring Bitcoin's most famous bull run, a verifiable and intensifying supply shock, unprecedented institutional adoption via both spot ETFs and futures markets, and a resilient technical posture creates a powerful case for a sustained bullish continuation.
Each pillar of this argument reinforces the others. Institutional inflows from ETFs directly contribute to the supply squeeze on exchanges. The resulting upward price pressure attracts more speculative interest in the futures market, and the resilient technical picture provides the stable base from which a larger market move can be launched. While no outcome in financial markets is ever guaranteed, and the risks of volatility and sharp corrections remain ever-present, the confluence of these potent factors suggests that Ethereum may not just be knocking on the door of its old all-time high, but preparing to smash through it and enter a new and explosive era of price discovery.

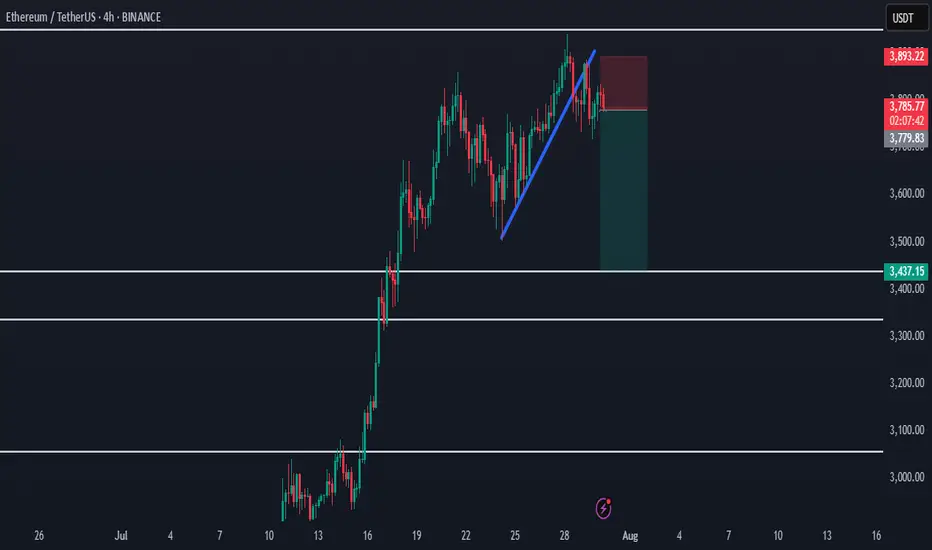
Ethereum Rejected from Supply - Bearish Shift in ProgressHello everybody!
Price has been rejected from a supply area.
The bullish trend has slowed down, and the market structure is slightly shifting bearish.
A polished upward trendline has been broken on the 1H timeframe.
We’re aiming for a target around the first untouched demand zone: 3437.
Manage your risk and trade safe!
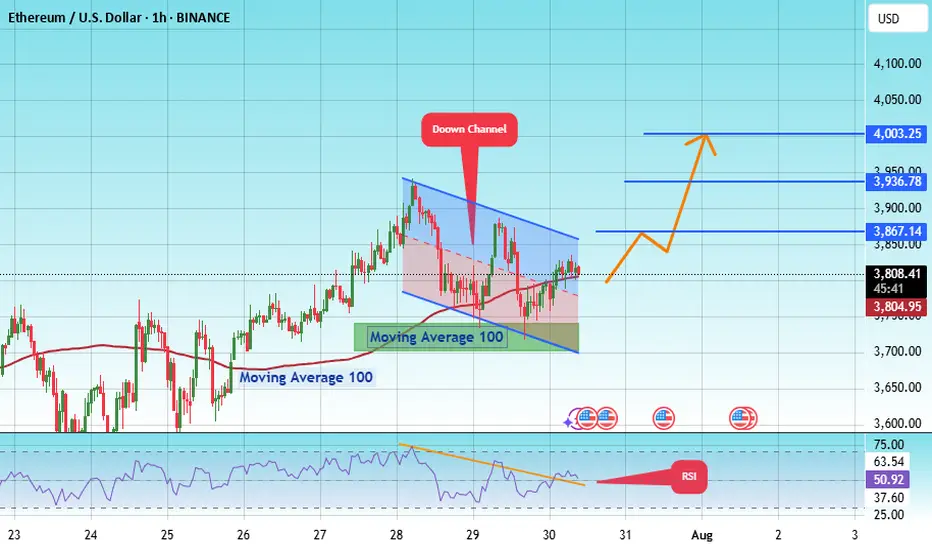
#ETH/USDT SETUP ,Bought From $4003#ETH
The price is moving within an ascending channel on the 1-hour frame, adhering well to it, and is on track to break it strongly upwards and retest it.
We have support from the lower boundary of the ascending channel, at 3700.
We have a downtrend on the RSI indicator that is about to break and retest, supporting the upside.
There is a major support area in green at 3711, which represents a strong basis for the upside.
Don't forget a simple thing: ease and capital.
When you reach the first target, save some money and then change your stop-loss order to an entry order.
For inquiries, please leave a comment.
We have a trend to hold above the 100 Moving Average.
Entry price: 3811.
First target: 3867.
Second target: 3936.
Third target: 4003.
Don't forget a simple thing: ease and capital.
When you reach your first target, save some money and then change your stop-loss order to an entry order.
For inquiries, please leave a comment.
Thank you.
#ETH/USDT SETUP ,Bought From $3696#ETH
The price is moving within a descending channel on the 1-hour frame, adhering well to it, and is on its way to breaking strongly upwards and retesting it.
We have support from the lower boundary of the descending channel at 3640.
We have a downtrend on the RSI indicator that is about to be broken and retested, supporting the upside.
There is a major support area in green at 3600, which represents a strong basis for the upside.
Don't forget a simple thing: ease and capital.
When you reach the first target, save some money and then change your stop-loss order to an entry order.
For inquiries, please leave a comment.
We have a trend to hold above the Moving Average 100.
Entry price: 3696.
First target: 3764.
Second target: 3826.
Third target: 3904.
Don't forget a simple thing: ease and capital.
When you reach your first target, save some money and then change your stop-loss order to an entry order.
For inquiries, please leave a comment.
Thank you.

ETH to $6500?Have had this chart created for a while since before 2020, now loading it back up looks like everything is going as planned. ETH has to reach its ATH again around 4800 then it shoots to prices discovery, it will forsure run through 5000$ so $6500 becomes a target afterwards.
Ethereum Price to Reach $4,000, but Market Top Suggests DelayBINANCE:ETHUSDT current price stands at $3,872, holding above its local support level of $3,742. While ETH is approaching the $4,000 mark , it has not yet managed to breach it. This resistance could continue to hold, limiting Ethereum's immediate potential for further gains.
Currently, 96% of BINANCE:ETHUSDT total supply is in profit. Historically, when the profitable supply surpasses 95%, it signals a market top . This has been followed by price corrections as investors begin to secure profits.
If the market top triggers a reversal, BINANCE:ETHUSDT price could drop to $3,530 or lower . A sharp decline to $3,131 is also a possibility, erasing much of the recent gains made in the past month.
On the other hand, if the influx of new addresses continues and strengthens, BINANCE:ETHUSDT may finally break through the $4,000 resistance. Should this happen, ETH could rise towards $4,425, with a renewed surge in price. This would invalidate the bearish thesis and push Ethereum into a new bullish phase.

ARKK: The Calm Before the Innovation Storm -ALTSEASON Is COMING🚀 ARKK: The Calm Before the Innovation Storm 🌪️
The markets are shifting, and disruption is about to go vertical. ARK Innovation ETF (ARKK) is quietly positioning itself for what could be the most explosive move of this decade. With high-conviction bets in AI, Bitcoin, genomics, and next-gen tech, this isn’t just a fund—it’s a launchpad for exponential growth.
This post breaks down exactly why ARKK could go parabolic—and why the smart money is already moving in. 👇
Explosive upside in 2026
ARKK is already up over 24% YTD , showing strong momentum compared to broader markets and signaling early stages of a potential parabolic move .
High-conviction concentration in game-changers
Top 10 holdings include Tesla, Roku, Zoom, Coinbase, UiPath, Block, Crispr Therapeutics, DraftKings, Shopify, and Exact Sciences. These are leaders in innovation sectors with massive upside potential .
Deep exposure to Bitcoin and digital assets
Heavy allocation to Coinbase and Block gives indirect exposure to Bitcoin . If BTC breaks into a new cycle high , ARKK stands to benefit significantly.
Positioned in exponential growth sectors
Focus on AI, genomics, EVs, fintech, robotics, and blockchain , all of which are entering accelerating adoption phases globally.
Aggressive smart-money accumulation
Cathie Wood’s team continues buying aggressively during dips, reinforcing institutional confidence in the fund’s long-term trajectory.
Technical breakout structures forming
Ascending triangle and multi-month consolidation breakouts suggest a technical setup primed for explosive upside .
Innovation supercycle aligning
ARKK's themes are aligned with major global shifts like de-dollarization, decentralized finance, and AI convergence .
High beta = massive upside leverage
With a beta above 2 , ARKK tends to outperform in bull runs , offering leveraged exposure to innovation without the need for margin.
Resurgence of top holdings
Names like Coinbase, Tesla, Shopify, and Roku are up 50%–100% YTD , driving ARKK’s NAV growth and fueling bullish sentiment .
Long-term vision with short-term catalysts
The fund projects 5x returns over the next five years , while Bitcoin halving cycles, tech innovation, and regulatory clarity serve as short-term ignition points .
Marty Boots | 17-Year Trader — smash that 👍👍, hit LIKE & SUBSCRIBE, and share your views in the comments below so we can make better trades & grow together!

Eth Targetseth short term trade but once the market breals obver 3960 and sustain the longs will work great to 4350 level

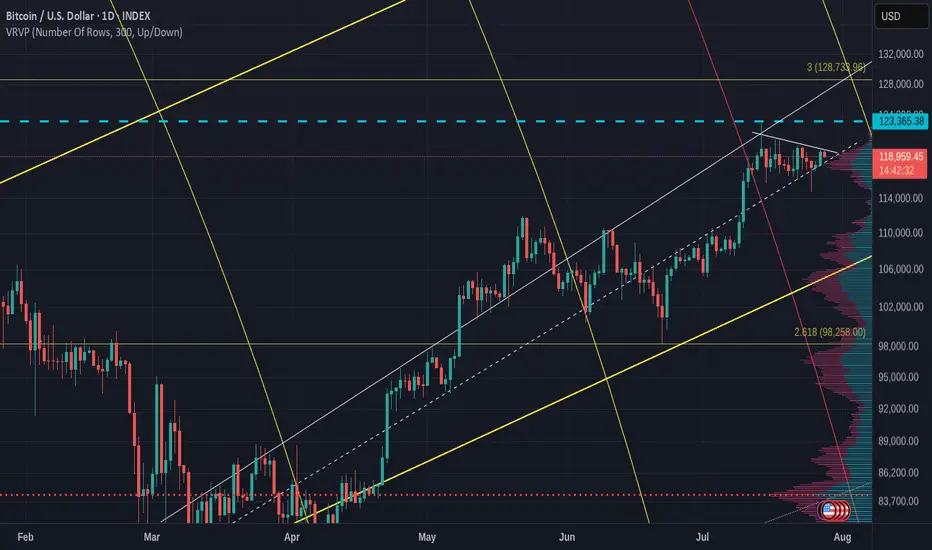
Bitcoin Versus ETH daily charts- one is VERY BULLISH
No Guesses which one.
Bitcoin printing a Bullish pennant on the daily with the Apex late this Wednesday, After the FED tell us what they are doing with interest rates
PA always reacts before the Apex.
ETh on the other hand, is under a Huge area of long therm resistance and running out of steam
If we zoom out to the weekly, we can see how long this line has rejected PA
My money remains in Bitcoin, whihc has also made gains over the weekend.
And is highly likley to remain there
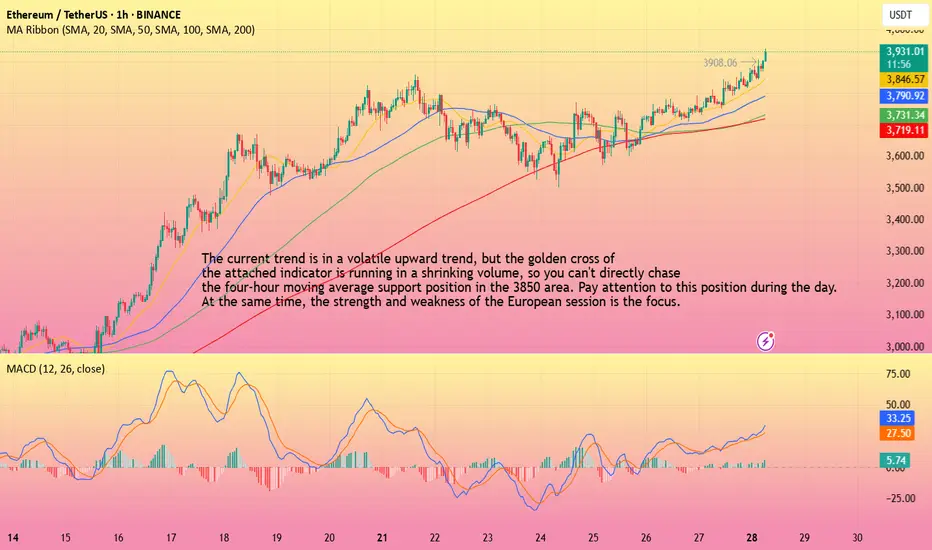
ETH-----Buy around 3850, target 3930 areaTechnical analysis of ETH contract on July 28:
Today, the large-cycle daily level closed with a small positive line yesterday, the K-line pattern continued to rise, the price was above the moving average, and the attached indicator was running in a golden cross. The general trend of rising is still very obvious. The current price has deviated from the moving average and returned to the moving average support position near the 3775 area, so you still need to pay attention to the risk trend of retracement in trading. The overall trend of the short-cycle hourly chart is in a volatile upward trend, but the price is relying on the support of the MA5 and MA10 daily moving averages to rise, and the general trend of rising is relatively obvious, so you still need to find obvious signals to enter the market during the day. The current four-hour moving average support position is near the 3850 area, and the hourly chart continues to fall.
Today's ETH short-term contract trading strategy:
Purchase at the 3850 area when retreating, stop loss at the 3820 area, and target the 3930 area;
You thinking of buying ETH ? read this first
There is a saying- "Charts NEVER lie"
And here it is
ETH USDT Weekly chart, suggesting that, right now, ETH is up against resistance that has rejected it more times than it has been support.
The RSI on this chart also suggests a pull back is coming
Again, RSI has been rejected in this range more times than it found support
Conclusion -WAIT before you buy and see if it crosses that line of resistance and tests it as support before you spend your money
Just saying

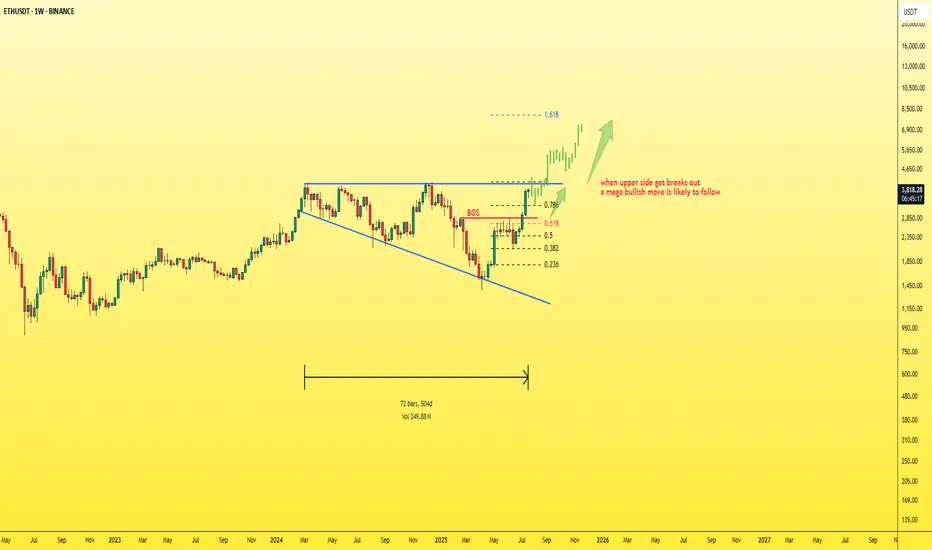
ETH - simple chart and mega moveEthereum is currently the strongest and most stable asset in the market, especially after many had lost hope in it.
Now, Ethereum is back with strength, and it’s just a few steps away from breaking out of the current pattern.
📈A breakout above the upper boundary will likely lead to a new all-time high (ATH) for ETH.
My projection: Ethereum could surpass $7,000 before the end of 2025.
Best regards:
Ceciliones🎯
$ETH Mid-TermLooking at Ethereum from a mid-term perspective, it’s currently sitting near its price ceiling, suggesting a potential need for a correction. Of course, it’s also possible that this level could be broken, depending on overall market conditions. However, the primary scenario is that it fails to break through and pulls back, with the potential reversal zone identified based on Fibonacci levels. On the other hand, the 55 EMA is also providing solid support.
If Ethereum manages to break above this resistance, then we'll wait for either a confirmation or a pullback before entering a long position

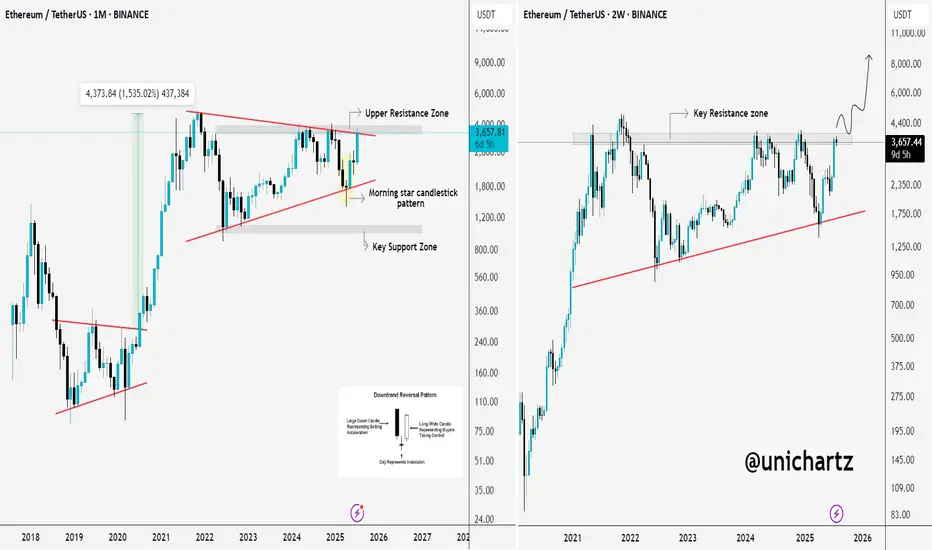
Ethereum Charts Aligning for a Major BreakoutI analyzed Ethereum on both the monthly and 2-week timeframes, and the structure looks strong.
On the right side, we have the monthly chart, where ETH has printed a bullish Morning Star pattern right off the key support trendline.
This is a classic reversal signal, and price is now approaching the upper resistance zone. A breakout from here could trigger a major rally, similar to what we saw in 2020.
On the left side, the 2-week chart shows CRYPTOCAP:ETH pressing into a critical resistance zone after a strong bounce. If price breaks and holds above this zone, it could open the doors to $6K–$8K targets in the coming months.
ETH is showing strength, now we wait for confirmation from the breakout.
Thanks for reading!
ETH/USDTHello friends, my analysis for Ethereum is bullish and I think it will continue its recent gains. What do you think?
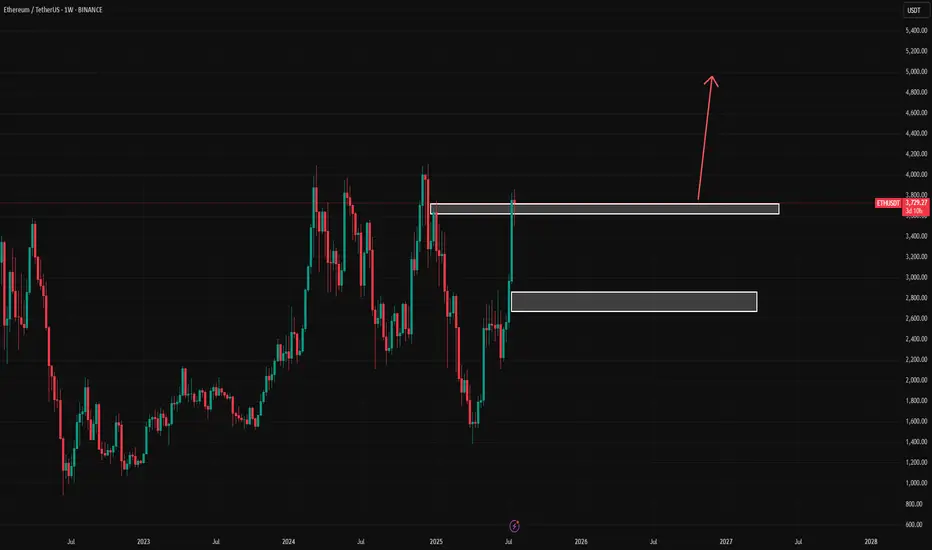
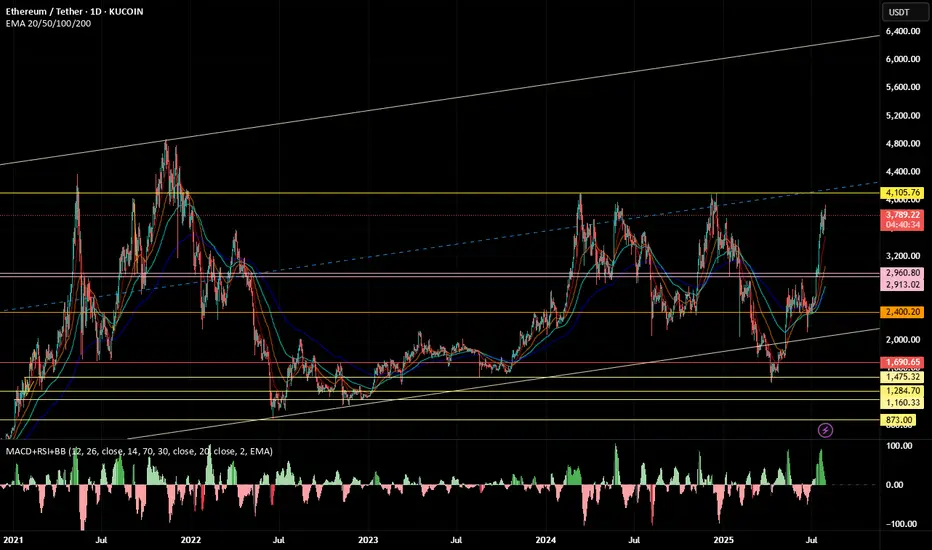
ETH (5 year of accumulation!)ETH / USDT
📌 Background: i shared an analysis about ETH/BTC chart and i predicted the ultimate bottom, from which ETH/BTC pumped 52% and ETH/USDT pumped 97% in few days !
you can check previous analysis: click here
📌 Today we have different chart against stable coin … Ethereum is being accumulated since 5 years in mega accumulation range with 2 major stop-loss hunt (long and short)
📌 What IF ?
What if ETH made a breakout throughout this accumulation ? i think we can see scenario like that in the green candles in my chart
DO YOU AGREE ?
