ETH-----Buy around 3000, target 3070 areaTechnical analysis of ETH contract on July 14:
Today, the large-cycle daily level closed with a small positive line yesterday, the K-line pattern continued to rise, the price was above the moving average, and the attached indicator was running in a golden cross. The general trend of rising was relatively obvious, but it was not as strong as the big cake. The previous historical high was in the 4877 area in November 2021, so in this way, the later rise may be more fierce than the big cake; the short-cycle hourly chart intraday starting point is in the 2970 area, and the current K-line pattern shows a trend of continuous negative retracement. The attached indicator is running in a golden cross, but the general trend is still strong. The four-hour chart retracement moving average support is in the 3000 area.
Today's ETH short-term contract trading strategy:
Purchase in the 3000 area, stop loss in the 2970 area, and target the 3070 area;
Ethreum

"Ethereum Is The New Bitcoin" - Tom Lee ETH / Stablecoins Are the ChatGPT of Crypto
Stablecoins are exploding in adoption — just like ChatGPT took over AI and Ethereum is the engine driving that revolution. In this post, we break down 10 reasons why Tom Lee is extremely bullish on Ethereum and why it could be the single most important digital asset in the future of finance . If you're sleeping on ETH, this might be your wake-up call.
Top 10 Bullish Points from Tom Lee on Ethereum:
• Ethereum is the backbone of stablecoins , which Tom Lee compares to the “ChatGPT of crypto” due to their viral adoption and massive utility.
• Over 51% of all stablecoins operate on Ethereum , contributing to around 30% of the network’s total fees.
• Ethereum network fees could 10x as stablecoin usage grows from $250 billion to $2 trillion.
• Ethereum is positioned to lead the tokenization of real-world assets , including stocks and real estate.
• ETH could reach $10,000 if asset tokenization becomes a mainstream financial practice.
• Ethereum has a regulatory edge in the U.S. , making it the preferred platform for compliant financial innovation.
• A $250 million ETH treasury strategy is underway , aiming to use Ethereum as a long-term reserve asset.
• Institutions will buy and stake ETH to secure stablecoin networks, making ETH the “next Bitcoin.”
• Ethereum dominates the crypto ecosystem , with nearly 60% of activity including DeFi, NFTs, and dApps built on its chain.
• HODL ETH for long-term growth , as its utility, demand, and institutional support continue to rise.
Conclusion:
Ethereum isn’t just a Layer 1 blockchain — it’s becoming the core financial infrastructure for the digital age . As stablecoins expand and institutions enter, ETH could be the most asymmetric opportunity in crypto right now.
📢 Drop a like, leave your thoughts in the comments, and don’t forget to follow for more powerful macro + crypto insights. 👍👍

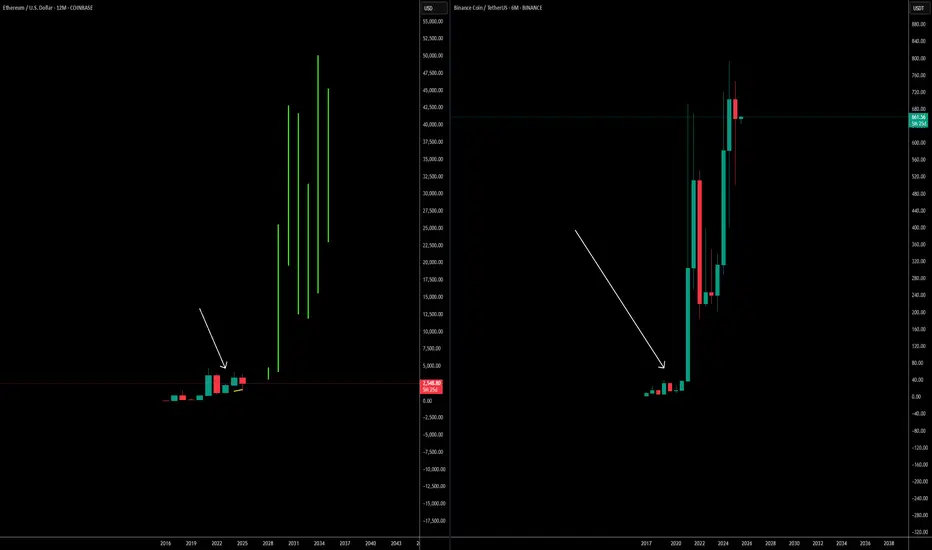
ethusd to 70 000 or 700 and 70 in two Months we seeEthereum in parallel channel and huge bull flag. if in next two months it will break out of the 4000 could go to 75000.
If not will range in channel till 700 and breaking down would mean even 70 and lower

ETHEREUM - ETH Weekly Recap & Projection 13.07.2025Current Structure
Ethereum is showing a clear bullish bias.
Last week’s price action broke above a significant weekly swing level with solid candle closures — suggesting continuation.
Short-Term Scenarios
We could see two potential outcomes:
• A consolidation range forming at current levels
• A short-term retracement influenced by Bitcoin’s movement
Due to ETH’s high correlation with BTC, traders should review Bitcoin’s chart to understand ETH’s likely path.
Trading Plan
Wait for Bitcoin to complete a retracement
Monitor ETH for LTF (lower timeframe) confirmation and bounce
Seek long setups below the CME Gap (pink line)
Step 2 will serve as the trigger to initiate any positions on ETH.
Macro Risk-On Catalyst – Powell Resignation?
There are growing rumors regarding Federal Reserve Chairman Jerome Powell potentially resigning.
If confirmed, this could result in a strong rally across risk assets, including ETH — likely pushing prices higher without traditional pullbacks.
Summary
• ETH broke major weekly structure
• Watch BTC for clues — correlation remains high
• Plan favors long entries after BTC retrace + ETH LTF confirmation
• Powell resignation rumors could accelerate bullish trend

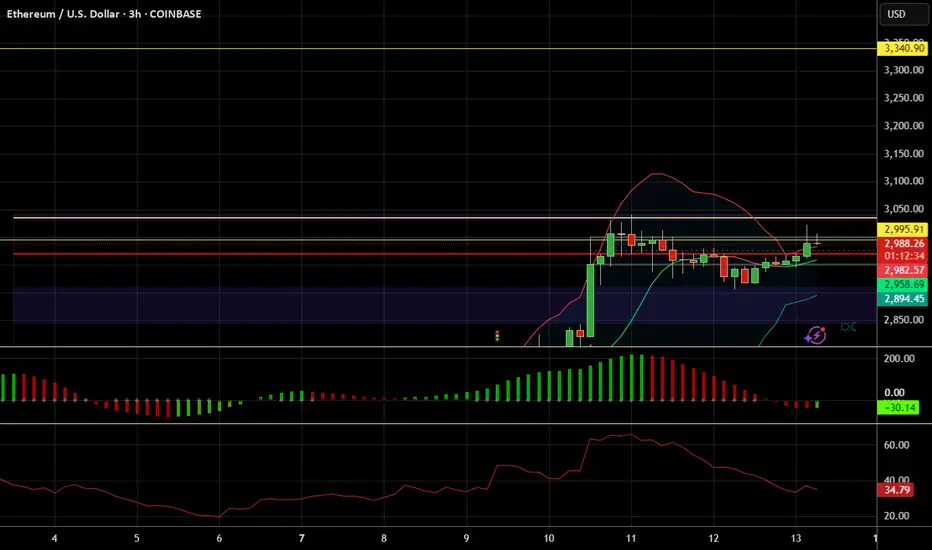
ETH / USDC Liquidity Pool RangeEthereum is climbing alongside Bitcoin, but it’s clearly outperforming. In many ways, ETH is the Microsoft of the crypto space—serving as a foundational platform on which countless networks and tokens are built, much like Windows supports a broad software ecosystem. In contrast to Bitcoin’s role as a digital currency, Ethereum functions more like a software operating system.
We broke out of the previous range for strong profits. The new range is tighter, with the lower boundary set just above the current ETH spot price at $2,995.91 and the upper boundary at $3,340.90, as marked by the horizontal yellow lines. On the 3-hour chart, momentum is beginning to turn upward. To enter the liquidity pool within this range, we must be fully allocated in ETH.
ETHEREUM READY TO SMASH 10K !!!AS per previous Ethereum update, CRYPTOCAP:ETH successfully tapped our Bat PRZ and making it's way to the top.
as per micro elliott wave count, we will see Ethereum slamming 7k, and could potentially smash 10k in coming months.

Ethereum Idea and Buying Plan⚪️ CRYPTOCAP:ETH
We mentioned earlier that our goal is 3290 - 3473 which is the gap formed in CME contracts
⭕️ Currently, for speculative thinking or looking to enter the support range after all this rise is between 2789.57 to 2685.87
🚨 The important thing is to stay above 2326 to support the continuation of the rise strongly
🔼 The key to the rise will be maintaining movement above 3000 on the 4h and 1d frames
📄 The closest targets for this model, upon meeting the conditions, are 3356 reaching the range of 3567 - 3857


[UPD] BTC / ETH / SOL / XRP / HYPE / SUPER / FLOKIUpdating my view on intermediate trend structures I am tracking in CRYPTOCAP:BTC , CRYPTOCAP:ETH , CRYPTOCAP:SOL , CRYPTOCAP:XRP , GETTEX:HYPE , BSE:SUPER and SEED_DONKEYDAN_MARKET_CAP:FLOKI highlighting key support and resistance zones to watch in the coming sessions
Charts featured in the video:
BTC
ETH
XRP
SOL
HYPE
SUPER
FLOKI
Thank you for your attention and I wish you successful trading decisions!
If you’d like to hear my take on any other coin you’re tracking — feel free to ask in the comments (just don’t forget to boost the idea first 😉).

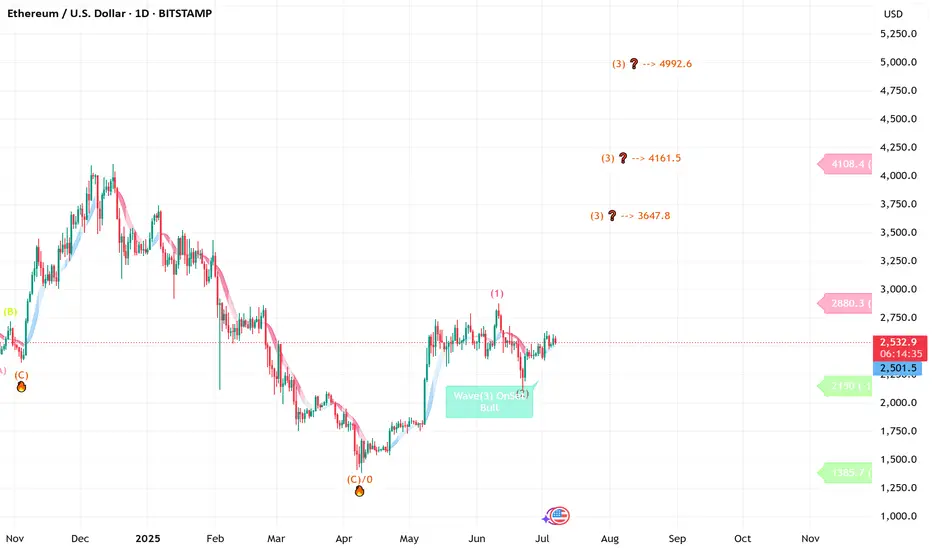
ETH ( Ethereum ) lovers looking strong for long term ETH -----Daily counts indicate Excellent bullish wave structure.
Both appear to be optimistic and this stock invalidation number (S L) wave 2 low
target short / long term are already shared as per charts
correction wave leg seems completed
Investing in declines is a smart move for short/ long-term players.
Buy in DIPS recommended
Long-term investors prepare for strong returns over the next two to five years.
one of best counter
Every graphic used to comprehend & LEARN & understand the theory of Elliot waves, Harmonic waves, Gann Theory, and Time theory
Every chart is for educational purposes.
We have no accountability for your profit or loss.
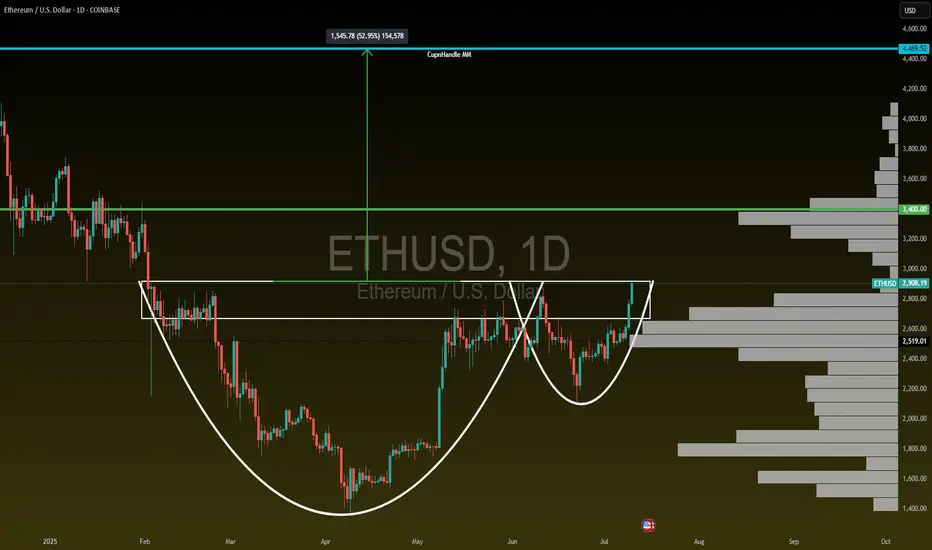
Ethusd next target 30kETH just painted the cup. Now comes the rocket. 🚀
Buy zone was $3,000 — now entering escape velocity.
🎯 Target: $30,000 within 12 months.
Crypto isn’t just logic — it’s human behavior + belief cycles.
This is art in motion. Don't blink. 👀
#Ethereum #Crypto #Altseason #BullMarket #UniproAI™

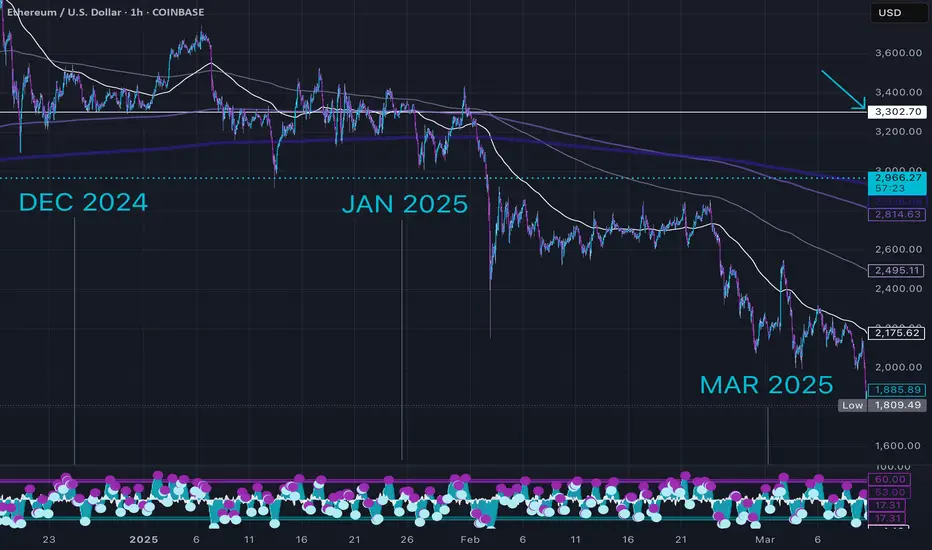
ETH - Back at the Level Everyone Forgot.Everyone’s watching ETH pump right now like it’s something new. It’s not. Look closer:
This is a look back in time to the breakdown that started to slide in Jan 2025.
That clean base around $3300 was holding for months in late 2024. It failed in January Q1, dragged us to sub-$2K by March, but now we’re right back under it.
This isn’t a random pump, it’s ETH revisiting the exact area it broke down from.
• White line = previous floor that gave out
• Dotted line = current price climbing back up into that structure
A move above $2960–$3300 flips the entire structure from resistance to reclaimed floor.
Market memory’s short, but price tends to remember everything.
$ETH - See you later!CRYPTOCAP:ETH - See you later!
CupnHandle breakout
Volume gap up to $3400
Cupnhandle MM up to $4400+
ETH Decision Zone: Breakout or Bull Trap?Ethereum (ETHUSD) just broke out of a tight symmetrical triangle on the 1H chart — but price is now stalling near the previous high, signaling a critical decision point.
📊 Key Technical Notes:
🔹 Triangle Breakout: Clean push above downtrend resistance, but no candle close above key high.
🔹 Previous High Acting as Resistance: Bulls need continuation to validate this move.
🔹 Two Scenarios in Play:
1️⃣ Bullish Continuation:
→ ETH breaks and holds above ~$2,865
→ Next resistance levels sit at $3,000+
2️⃣ Bearish Rejection / Fakeout:
→ Rejection from highs
→ Retest of triangle → Failure = drop toward previous low near $2,150
🎯 Risk-Reward Defined — both long and short setups are clearly outlined.

BTC / ETH / SOL / XRP / HYPE: Potential Trend StructuresIn this video, I share my current daily and weekly analysis on the trend structures of BTC, ETH, SOL, XRP, and HYPE, highlighting key support and resistance zones to watch in the coming sessions.
Charts featured in the video:
BTC
ETH
SOL
XRP
HYPE
Thank you for your attention and I wish you successful trading decisions!
If you’d like to hear my take on any other coin you’re tracking feel free to ask in the comments (just don’t forget to boost the idea first 😉).

Why Ethereum’s Will 10×🚀 Ethereum’s Next 10×: Why bank-grade adoption + the stable-coin avalanche make a moonshot look conservative
Big banks are building on-chain right now. JPMorgan & Bank of America began 2025 pilots for dollar-backed tokens that settle on Ethereum, while Societe Generale just unveiled its USD CoinVertible stable-coin on main-net.
Stable-coins already move more money than Visa + Mastercard combined. $27.6 trillion flowed through stable-coins in 2024—most of it routed over Ethereum block-space.
Ethereum clears four-fifths of that stable-coin volume. More than 80 % of all stable-coin transactions occur on ETH or its L2s, locking in network effects that rivals can’t match.
ETF wall-of-money is already hitting the gate. 2025 Ethereum ETFs posted a record $743 million month of inflows—the strongest vote of institutional confidence to date.
ETH supply keeps shrinking while demand spikes. Post-Merge burn has removed roughly 332 k ETH, flipping issuance negative; base-line inflation is now < –1.3 %/yr.
30 million ETH is locked in staking, slicing liquid float by 25 %. The yield engine tightens supply just as banks and ETFs need inventory.
Real-world assets are going token-native. Tokenized bond issuance jumped 260 % in 2024 to €3 billion, and virtually every pilot settles on ERC-standards.
Layer-2 roll-ups slashed average gas fees to <$4. Cheaper block-space makes day-to-day payments viable, driving still more stable-coin throughput (and fee burn).
User base is exploding toward mass scale. Active ETH wallets hit 127 million—up 22 % YoY—showing that retail, devs, and institutions are onboarding together.
Energy-efficient PoS removes the last ESG roadblock. With > 99 % less energy use than PoW chains, Ethereum checks the sustainability box that banks and asset managers need for wide-open deployment.
Bottom line: when TradFi giants plug directly into Ethereum rails and stable-coins dwarf legacy payment rails, every transfer torches a little more supply. Add the ETF flywheel and a vanishing float, and a 10× move shifts from “moon-boy” to math.
OTHER EXAMPLES
TSLA
tradingview.sweetlogin.com
Total 2
tradingview.sweetlogin.com
MartyBoots here—trading for 17 years, and I would like to hear YOUR take!
👉 Can Ethereum really 10× from here? Drop your best argument below, hit the 👍 if you learned something, and smash that Follow to stay in the loop on every crypto deep-dive I post.
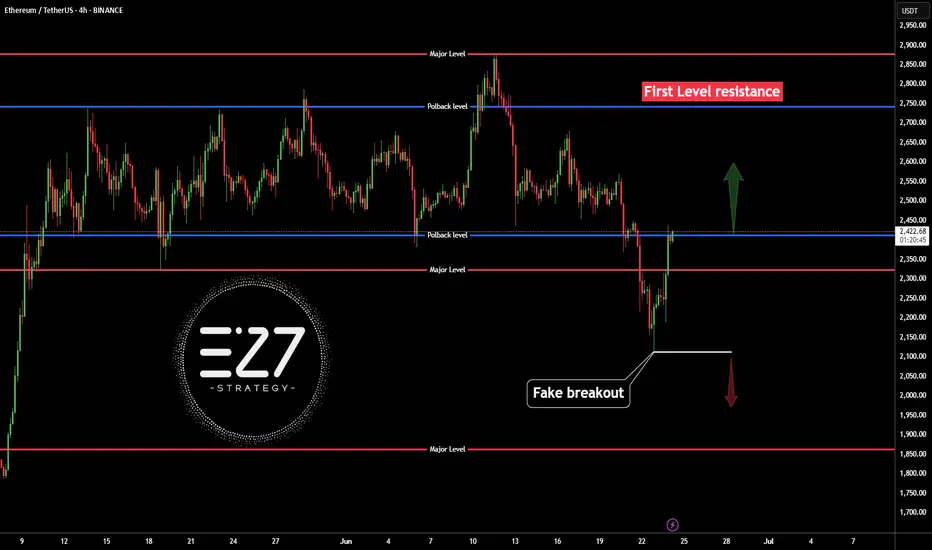
ETHUSDTThis is very easy...
best support level 2300 to 2500 for jump price. but was needed for jump price for get enrgy for movement to high levels by fake breakout.
First level of resistance 2800 to 3000.
⚠️Control Money Management in your capital.
ETH Just Reached the Floor — This Is the Starting Line.This isn’t hopium, it’s structure.
Using my custom 4 EMA setup, you can see how ETH spent weeks coiling around the thickest dark purple line which I treat as the macro floor. ETH dropped below it briefly, retested it, and now we’re reclaiming that level again.
Whenever these EMAs start to compress and flatten, we usually get sideways chop, pressure build, breakout.
Zoom out and you’ll notice:
• We’re not extended.
• We’re not overbought.
• We’re not in price discovery.
We’re just getting back to the floor after compression.
If this is the top, it’s doing a great job pretending it’s still early.

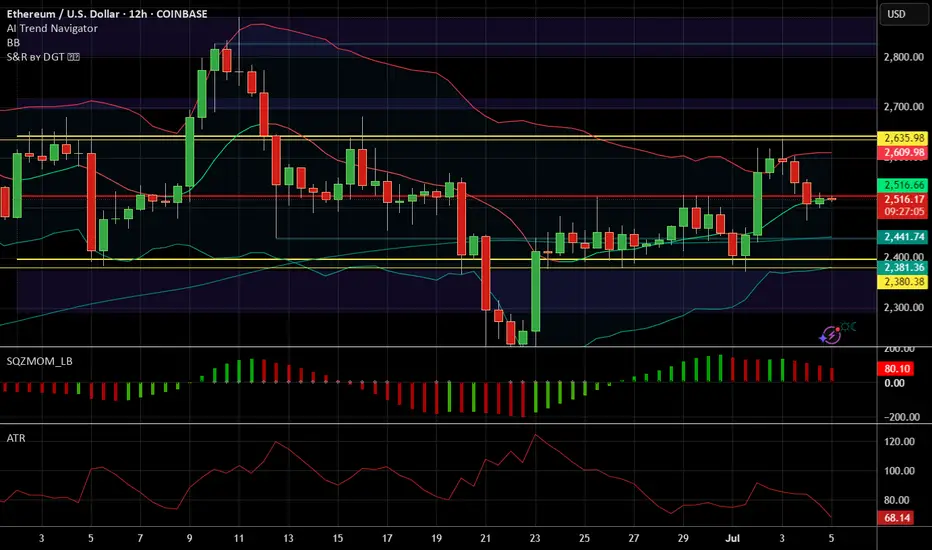
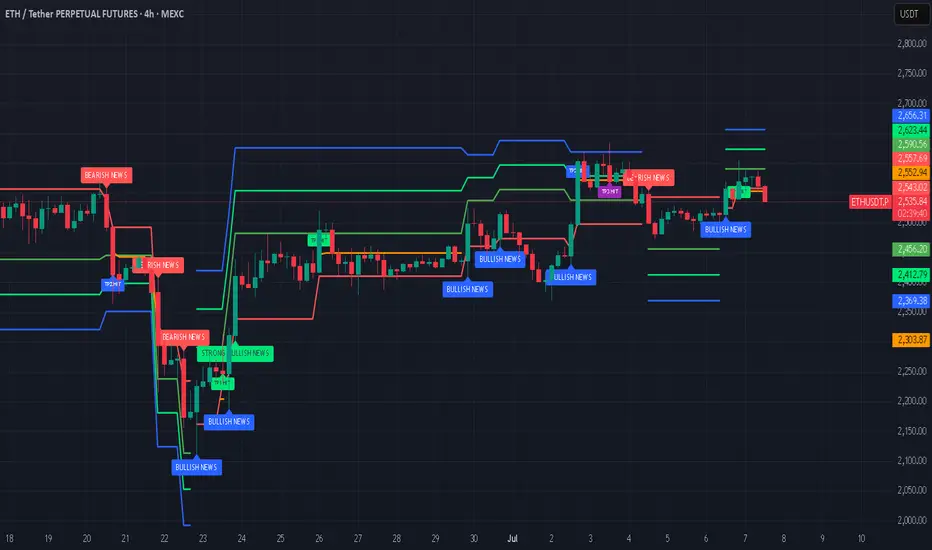
Ethereum (ETH) to U.S. Dollar (USD) 4-Hour Chart - Binance4-hour candlestick chart from Binance displays the price movement of Ethereum (ETH) against the U.S. Dollar (USD) from late June to early July 2025. The current price is $2,608.76, reflecting a +$65.53 (+2.58%) change. The chart includes buy and sell indicators at $2,608.76, with a highlighted resistance zone around $2,700-$2,760 and a support zone around $2,540-$2,600. The chart also shows a recent upward trend with fluctuating volatility.

ETHUSDT Long / Buy SetupMust take from the entry and USE tight SL. Can be a fakeout, if real breakout then tps are mentioned. In case sl hit, use the previous setup, it's still valid. While for short I'm still waiting for 3k or above.

ETH - Should I go long?Ethereum (ETH) is currently positioned at a critical juncture, with multiple technical and fundamental indicators suggesting the potential for a significant move ahead.
Current Price and Momentum: As of the latest real-time data, ETH is trading at $2,549.97, having recently started a fresh increase above the $2,520 zone. The price is above both the $2,550 level and the 100-hourly Simple Moving Average, indicating short-term bullish momentum.
Key Resistance Levels: The immediate resistance is near $2,600, followed by $2,620 and a major barrier at $2,650. A decisive break above $2,650 could open the path toward $2,720 and potentially $2,800 in the near term.
Support Levels: On the downside, $2,520 is a key support zone. A sustained drop below this could trigger declines toward $2,500 or even $2,420, but as long as ETH holds above $2,520, the bullish structure remains intact.
On-Chain and Institutional Signals: Long-term holders have been accumulating ETH, and institutional inflows have surged, with over $750 million invested recently. This accumulation, alongside strong ETF inflows and rising staking activity, points to growing confidence and could act as a catalyst for a major price move.
Technical Patterns: ETH is consolidating above critical moving averages and within bullish chart formations (such as ascending triangles and coiling structures). These patterns often precede significant breakouts, especially when accompanied by increasing trading volumes and improving momentum indicators.
Market Sentiment: While short-term indicators show some cooling, the broader trend remains bullish. Analysts note that if ETH can break above the current resistance cluster, it could ignite a new wave of bullish momentum and set the stage for a broader breakout.
In summary: Ethereum is at a pivotal resistance zone. If it can break and hold above $2,600–$2,650, analysts expect a strong move higher, with targets at $2,800. Institutional inflows, strong on-chain accumulation, and bullish technical setups all support the case for a significant upside move in the coming weeks or months, provided key support levels are maintained.
Note that a possible correction of Bitcoin (which essentially will result in a drop of the entire crypto market) is possible in the next weeks.
#crypto #eth #btc #bitcoin #ethereum #analysis #trading #portfolio #long #algorithm #buysellsignals #tradingsignals #bullrun
ETH : BUY...Hello friends
Due to the entry of buyers and the breakdown of the trading range, we can buy in the direction of the trend and with capital and risk management within the specified limits and move to the specified targets.
*Trade safely with us*
ETH / USDC Liquidity Pool RangeTightening up the range a little. Looking good with horizontal lines setting the new range.