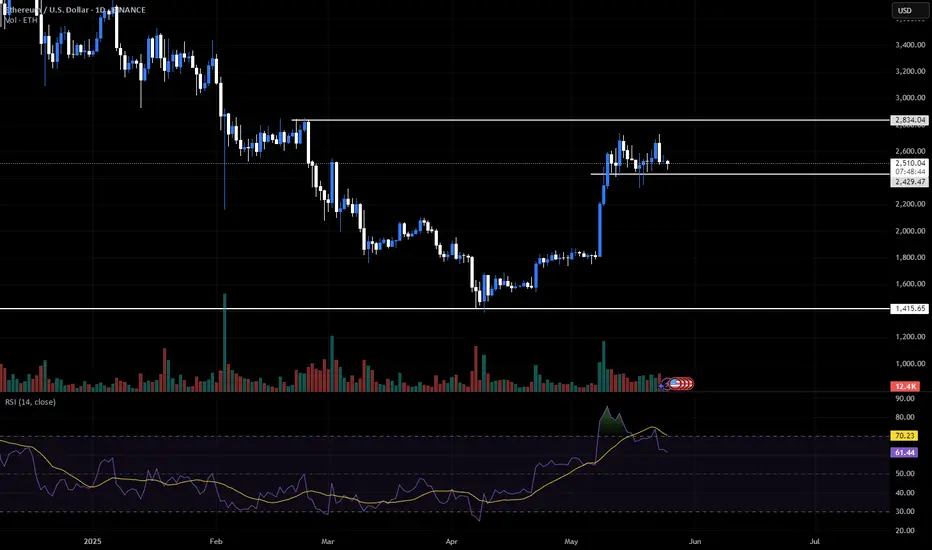
ETH Update — RSI Divergence & Double Top FormingEthereum is showing a clear RSI divergence paired with a developing double top, making this a key area to manage risk.
I’ve personally taken profit on my longs and am watching how price reacts in this range.
- Next resistance: $2,840
- Key support: $2,200
Right now, I don’t like the risk-to-reward of holding. There’s more downside exposure than upside potential from this level — at least until structure confirms otherwise.
Ethreum
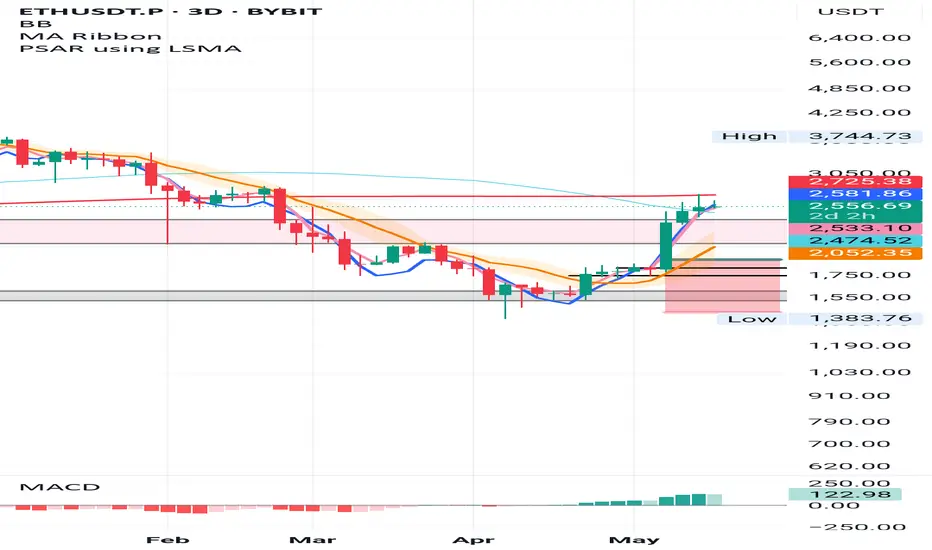
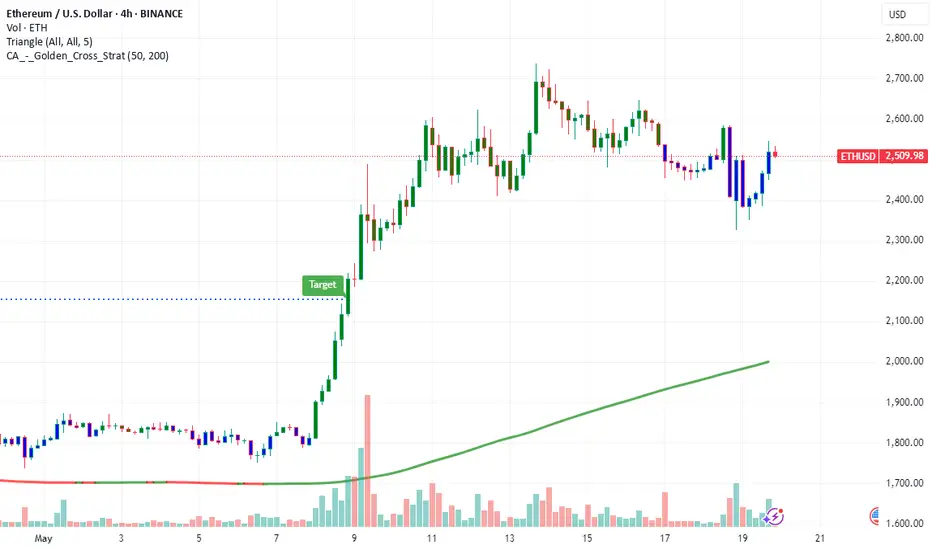
ETH 3D – System Trigger, 200MA Test & Death Cross Insight
This was the actual trigger for my ETH long.
The system gave the green light on 3D:
✅ PSAR flip
✅ MLR > SMA > BB center
Now ETH is testing the 200MA from below, which lines up with the 50/200 death cross — often seen as bearish, but here it likely confirms the bottom already built through March–April.
MACD is pushing up strong.
The signal came from this chart — and I'm still in the move.
ETHUSDT UpdateThe best reversal point for ETH, and now is time to close part of the trade...
Hope to see ETH in next reversal zone to trade with higher risk...
My first recording for ETHUSD - FxDollars - {25/05/2025}Educational Analysis says that ETHUSD may give countertrend opportunities from this range, according to my technical analysis.
Broker - bitstamp
So, my analysis is based on a top-down approach from weekly to trend range to internal trend range.
So my analysis comprises of two structures: 1) Break of structure on weekly range and 2) Trading Range to fill the remaining fair value gap
Let's see what this pair brings to the table for us in the future.
Please check the comment section to see how this turned out.
DISCLAIMER:-
This is not an entry signal. THIS IS FOR EDUCATIONAL PURPOSES ONLY.
I HAVE NO CONCERNS WITH YOUR PROFIT OR LOSS,
Happy Trading, Fx Dollars.

ETH long signalETH looks great for short term trade.
*Depends on how the market will behave during this week*
$ETHUSDT - Major Breakout Alert! CRYPTOCAP:ETH has officially broken out of a long-standing descending parallel channel on the daily chart — a key structural shift in market sentiment. This breakout is further supported by a successful close above the 50 EMA, which had acted as dynamic resistance throughout the downtrend.
Key Technical Developments:
- Broke out of a descending parallel channel
- Closed above 50 EMA for the first time in weeks
- Strong daily candle with 8% gain confirms momentum shift
Immediate Support: $1,790 (former resistance zone turned support)
Next Major Resistance: $2,393
This is the mid-zone before ETH challenges the broader supply area around $2,550–2,850.
This breakout mirrors Ethereum's typical behavior during previous cycle expansions — grinding accumulation followed by aggressive breakout moves. The confluence of the EMA breakout and channel structure suggests we could be looking at the beginning of a broader trend reversal.
Trading Plan:
Retests towards $1,850–$1,790 can offer high R:R entries.
Watch for continuation patterns or consolidation above $2,000 for the next push.
CRYPTOCAP:ETH is reclaiming momentum — if BTC remains stable, this move could expand quickly.
If you find this analysis helpful, please hit the like button to support my content! Share your thoughts in the comments, and feel free to request any specific chart analysis you’d like to see.

XRUSDT IDEAWe can see a consolidation on the daily time frame. Btc has reached to new highs but alternate coins have not moved along with same motivation. Why?

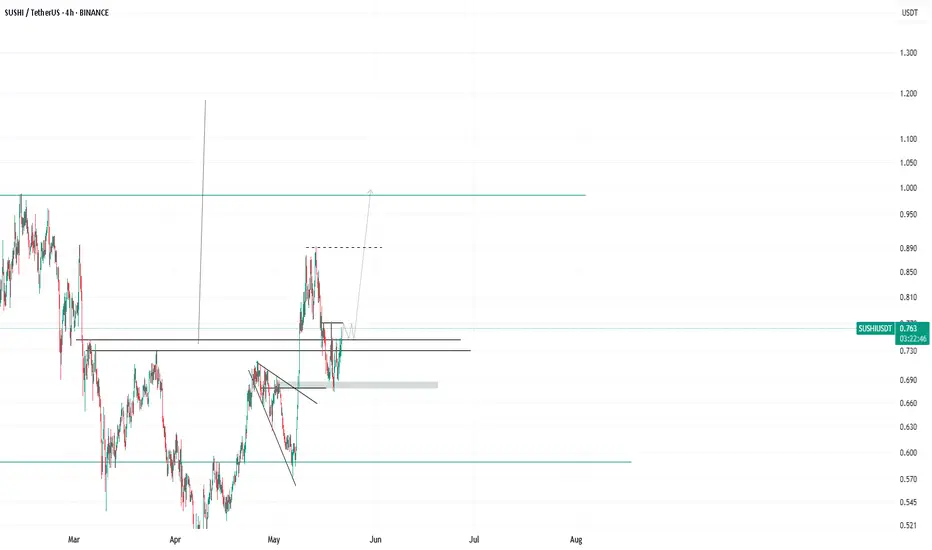
SUSHI Token: A High-Potential Setup You Shouldn’t IgnoreHello everyone!
A huge opportunity has emerged on the BINANCE:SUSHIUSDT chart. I’ll break down the technical analysis for SUSHI using both the Daily and 4H timeframes , highlighting key levels and potential trade setups.
On 1D timeframe
- Price has swept the liquidity below the November 2024 low , forming an inverse Head and Shoulders pattern , which is a strong bullish reversal signal.
- Price recently broke did the May high after that retraced approximately 24% . This pullback aligned perfectly with a retest of the neckline from the inverse Head and Shoulders pattern, reinforcing its validity as a bullish setup.
On 4H timeframe
- If price breaks above $0.775 , it would serve as a confirmation of bullish momentum, suggesting a likely move toward the liquidity zone above $1.00 .
- In my opinion, if market conditions remain bullish and Bitcoin continues its upward trend, SUSHI is likely to break above the $1.00 level with ease and potentially reach the inverse Head and Shoulders target around $1.20+ .
In conclusion, SUSHI is currently showing strong bullish signals, and if the broader market gives altcoins room to run, this token has the potential to rally aggressively.
Note: SUSHI is a low-cap token with high volatility, so exercise proper risk management when trading or investing.
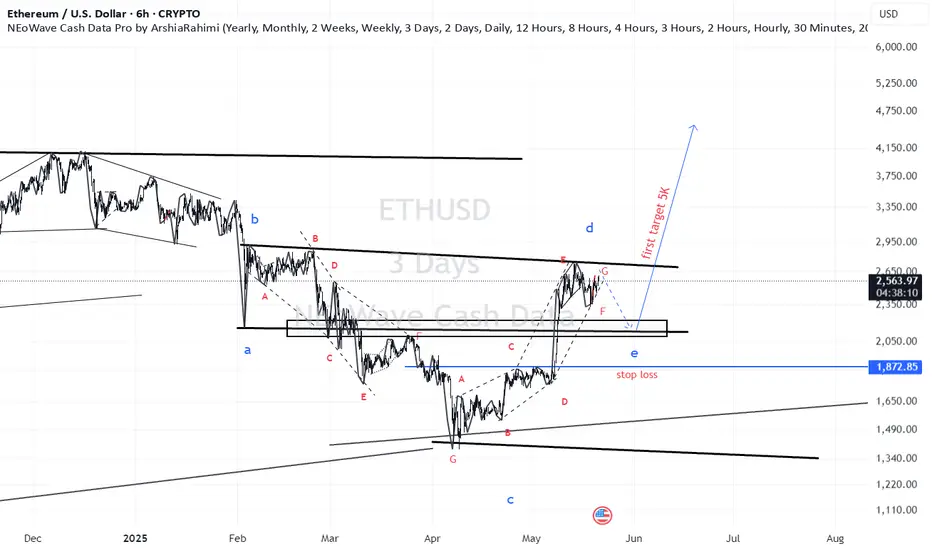
ETH(based on NEowave)now the E wave of that cycle triangle looks like also a triangle.(if you dont know what Im talking about check the last analysis of ETH)
if e wave of this triangle breaks the SL it turns to a diamond diametrical.
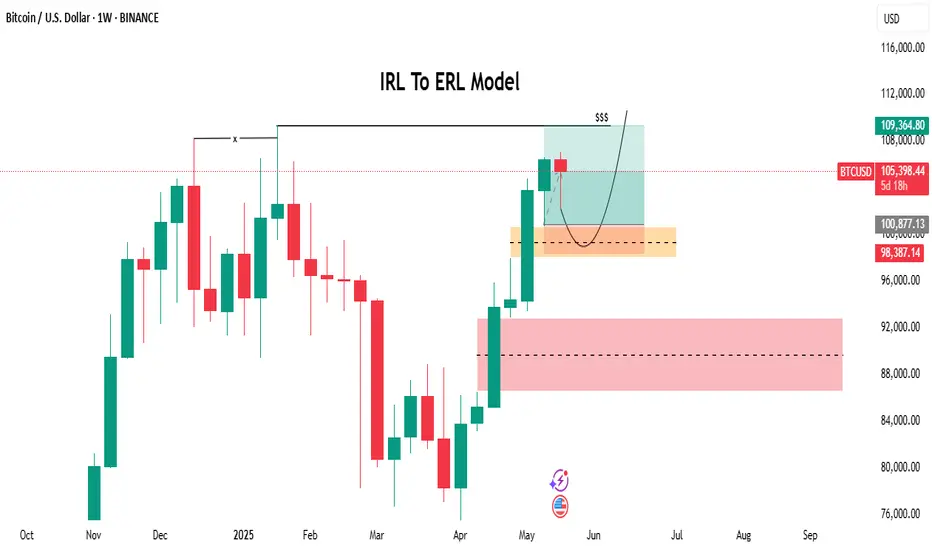
Bitcoin has recently touched its weekly Fair Value GapBitcoin (BTC) Market Update
Bitcoin has recently touched its weekly Fair Value Gap (FVG) and is now showing upward momentum. This price behavior is aligning with a potential transition from an Intermediate Reversion Level (IRL) to an Extended Reversion Level (ERL), suggesting the formation of a structured bullish model.
Given the current positive market sentiment surrounding BTC and the fact that the asset has already absorbed significant sell-side liquidity, the potential for further upward movement remains strong. There is a possibility that the market could aim for the 110K level in the near term if bullish conditions persist.
Investors and traders are advised to monitor the market closely as this structure develops, considering both technical indicators and macroeconomic influences to make informed decisions.
DYOR!
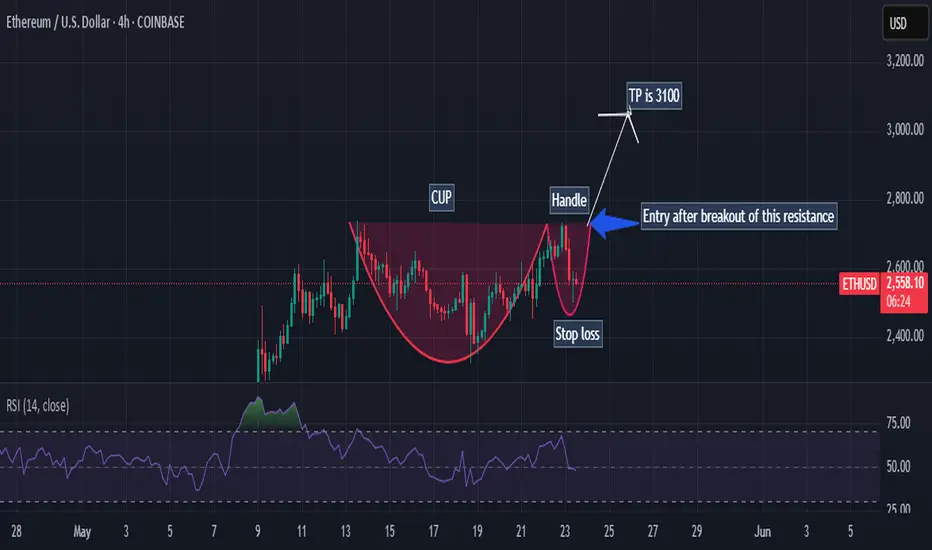
Ethereum Golden Cross: ETH Eyes $3,000 BreakoutEthereum Flashes Golden Cross: A Bullish Beacon or a Fleeting Glimmer for the $3,000 Target?
The cryptocurrency market is once again abuzz with technical signals, and this time, Ethereum (ETH), the second-largest cryptocurrency by market capitalization, is in the spotlight. Traders and analysts are keenly observing a "Golden Cross" that has recently manifested on Ethereum's price charts. This classic bullish indicator has historically been associated with potential upward momentum, igniting discussions and hopes among investors: could this be the catalyst that propels ETH bulls to conquer the coveted $3,000 price level?
Understanding the Golden Cross: A Primer
Before diving into Ethereum's specific prospects, it's crucial to understand what a Golden Cross signifies. In technical analysis, a Golden Cross occurs when a shorter-term moving average (MA) of an asset's price crosses above a longer-term moving average. Most commonly, this involves the 50-day moving average (50-MA) moving above the 200-day moving average (200-MA).
The rationale behind its bullish interpretation is straightforward: the 50-MA reflects the average price over the last 50 trading days, representing recent momentum. The 200-MA, on the other hand, represents the longer-term trend. When the shorter-term momentum (50-MA) surpasses the longer-term trend (200-MA) from below, it suggests that the recent buying pressure and positive price action are strong enough to potentially shift the overall market sentiment and initiate a more sustained uptrend.
However, it's vital to approach this signal with a degree of caution. The Golden Cross is a lagging indicator, meaning it confirms a trend that has already been underway for some time, rather than predicting a future one with certainty. By the time a Golden Cross appears, a significant portion of the initial upward move might have already occurred. Furthermore, like all technical indicators, it's not infallible. False signals can happen, where a Golden Cross appears but fails to lead to a sustained rally, sometimes even preceding a market downturn. Therefore, while a Golden Cross is a positive sign, it’s best used in conjunction with other indicators and a broader market analysis.
Ethereum's Current Landscape and the Significance of the Signal
For Ethereum, the appearance of a Golden Cross is a noteworthy development, especially considering its price action in recent months. After periods of consolidation and navigating broader market uncertainties, such a signal can inject a fresh wave of optimism. It often attracts trend-following traders and algorithms programmed to react to such patterns, potentially increasing buying pressure.
The journey towards $3,000 for Ethereum is not just a numerical target; it represents a significant psychological level. Reclaiming this mark would signify a strong recovery and could pave the way for further exploration of higher price territories. The Golden Cross, in this context, acts as a technical validation for bulls who believe in Ethereum's underlying fundamentals and its potential for growth.
Factors Fueling the Bullish Case for ETH to $3,000
Several factors, beyond the Golden Cross itself, could support a bullish push for Ethereum towards the $3,000 milestone:
1. Strong Network Fundamentals: Ethereum continues to be the dominant smart contract platform, hosting the vast majority of decentralized finance (DeFi) applications, non-fungible tokens (NFTs), and a burgeoning ecosystem of Layer 2 scaling solutions. Ongoing development, such as progress on future upgrades aimed at enhancing scalability and efficiency (like proto-danksharding with EIP-4844), bolsters long-term confidence.
2. The Impact of "The Merge" and Staking: The transition to a Proof-of-Stake (PoS) consensus mechanism (The Merge) has fundamentally changed Ethereum's tokenomics. It significantly reduced new ETH issuance and, coupled with the EIP-1559 fee-burning mechanism, has often made ETH deflationary during periods of high network activity. The growth in staked ETH, which secures the network and earns rewards for stakers, also reduces the liquid supply available on exchanges, potentially creating upward price pressure.
3. Layer 2 Scaling Solutions Gaining Traction: Solutions like Arbitrum, Optimism, zkSync, and StarkNet are increasingly handling a significant portion of Ethereum's transaction load. This alleviates congestion on the mainnet, reduces gas fees for users interacting with these Layer 2s, and improves the overall user experience, making the Ethereum ecosystem more attractive and scalable. As these solutions mature and gain wider adoption, they enhance Ethereum's value proposition.
4. Renewed Institutional Interest: While institutional adoption of crypto can be cyclical, a clear bullish signal like a Golden Cross, combined with improving macroeconomic conditions or regulatory clarity, could reignite interest from larger financial players looking for exposure to digital assets beyond Bitcoin. Ethereum's utility and its role as a platform for decentralized applications make it an attractive candidate for institutional portfolios.
5. Positive Market Sentiment: The cryptocurrency market is heavily influenced by sentiment. A Golden Cross can contribute to a positive feedback loop: the signal encourages buying, which pushes prices up, further reinforcing bullish sentiment and attracting more participants. If Bitcoin, the market leader, also shows strength, it often creates a favorable environment for altcoins like Ethereum to rally.
6. Growing NFT and DeFi Ecosystems: Despite market fluctuations, innovation within the NFT and DeFi sectors on Ethereum continues. New use cases, improved user interfaces, and greater mainstream adoption of these technologies can drive demand for ETH, which is used to pay for transactions and interact with these applications.
Potential Headwinds and Obstacles on the Path to $3,000
Despite the optimism generated by the Golden Cross, several challenges could hinder Ethereum's ascent to $3,000:
1. Macroeconomic Uncertainty: Broader economic factors, such as inflation rates, interest rate policies by central banks, and geopolitical events, can significantly impact risk assets, including cryptocurrencies. A deteriorating macroeconomic outlook could dampen investor appetite and stall any potential rally.
2. Regulatory Scrutiny: The regulatory landscape for cryptocurrencies remains a significant unknown in many jurisdictions. Unfavorable regulations or enforcement actions targeting Ethereum, DeFi, or staking could negatively impact its price.
3. Technical Resistance Levels: The path to $3,000 is likely to encounter several technical resistance levels where selling pressure might increase. Traders will be closely watching these zones, and failure to break through them decisively could lead to pullbacks.
4. Profit-Taking: As the price of ETH rises, especially after a significant signal like a Golden Cross, traders who bought at lower levels may decide to take profits, creating selling pressure that needs to be absorbed by new buyers for the uptrend to continue.
5. Competition: While Ethereum is the dominant player, it faces ongoing competition from other Layer 1 blockchains (e.g., Solana, Avalanche, BNB Chain) that also aim to offer scalable smart contract platforms. Significant advancements or adoption shifts towards competitors could impact Ethereum's market share and sentiment.
6. The "False Signal" Risk: As mentioned earlier, no technical indicator is perfect. The Golden Cross could prove to be a false signal if broader market conditions turn bearish or if unforeseen negative catalysts emerge.
Conclusion: A Promising Signal, But Prudence is Key
The appearance of a Golden Cross on Ethereum's charts is undeniably a positive development that warrants attention. It provides a technical basis for bullish optimism and could indeed be a contributing factor if ETH is to make a sustained push towards the $3,000 mark. The combination of this signal with Ethereum's strong network fundamentals, ongoing technological advancements, and the deflationary pressures from its tokenomics paints a compelling picture for potential price appreciation.
However, investors should approach this scenario with a balanced perspective. The Golden Cross is a piece of the puzzle, not the entire picture. Its predictive power is enhanced when considered alongside other market indicators, fundamental analysis, and the overall macroeconomic environment. While bulls may feel emboldened by this signal, the path to $3,000 will likely involve navigating volatility, overcoming resistance levels, and contending with potential external shocks.
Ultimately, whether Ethereum can leverage this Golden Cross to reach $3,000 will depend on a confluence of factors: sustained buying momentum, continued positive developments within the Ethereum ecosystem, a favorable broader market sentiment, and the absence of significant negative catalysts. For now, the Golden Cross serves as a beacon of hope for ETH holders, but diligent research, risk management, and an awareness of the inherent uncertainties in the crypto market remain paramount.
Last year Nov ETH $ETH VibesIf we See a $2800 Zone Breakout it will be Huge Week for Alts Ethereum
Will history repeat itself?

Possible $ETH shortPossible CRYPTOCAP:ETH short with tight invalidation
Approaching supply levels and forming a symmetrical triangle

ETH/USDT – First Support in the Blue BoxETH has been slowing down after its latest push, and the first real area to watch is that blue box below price. It’s where buyers will likely step back in, and a clean reaction there could spark a bigger move—especially if ETH/BTC starts to turn higher at the same time.
What you need before pulling the trigger
• A volume surge that outstrips the prior pullback and aligns with a bullish CDV divergence
• A quick break under the blue box on your one- or five-minute chart followed by a fast reclaim, showing order flow flipped to the buy side
• Genuine buying pressure, not just a wick into the zone
“If the levels suddenly break upwards and do not give a downward break in the low time frame, I will not evaluate it. If they break upwards with volume and give a retest, I will look long.”
Jumping in without those confirmations is the easiest way to get shaken out. But if ETH dips into that box, lights up on volume and CDV, and then retests cleanly on the low timeframe, that’s your signal. With ETH/BTC potentially gearing up to rise too, a solid bounce here could turn into something you don’t want to miss.
📌I keep my charts clean and simple because I believe clarity leads to better decisions.
📌My approach is built on years of experience and a solid track record. I don’t claim to know it all but I’m confident in my ability to spot high-probability setups.
📌If you would like to learn how to use the heatmap, cumulative volume delta and volume footprint techniques that I use below to determine very accurate demand regions, you can send me a private message. I help anyone who wants it completely free of charge.
🔑I have a long list of my proven technique below:
🎯 ZENUSDT.P: Patience & Profitability | %230 Reaction from the Sniper Entry
🐶 DOGEUSDT.P: Next Move
🎨 RENDERUSDT.P: Opportunity of the Month
💎 ETHUSDT.P: Where to Retrace
🟢 BNBUSDT.P: Potential Surge
📊 BTC Dominance: Reaction Zone
🌊 WAVESUSDT.P: Demand Zone Potential
🟣 UNIUSDT.P: Long-Term Trade
🔵 XRPUSDT.P: Entry Zones
🔗 LINKUSDT.P: Follow The River
📈 BTCUSDT.P: Two Key Demand Zones
🟩 POLUSDT: Bullish Momentum
🌟 PENDLEUSDT.P: Where Opportunity Meets Precision
🔥 BTCUSDT.P: Liquidation of Highly Leveraged Longs
🌊 SOLUSDT.P: SOL's Dip - Your Opportunity
🐸 1000PEPEUSDT.P: Prime Bounce Zone Unlocked
🚀 ETHUSDT.P: Set to Explode - Don't Miss This Game Changer
🤖 IQUSDT: Smart Plan
⚡️ PONDUSDT: A Trade Not Taken Is Better Than a Losing One
💼 STMXUSDT: 2 Buying Areas
🐢 TURBOUSDT: Buy Zones and Buyer Presence
🌍 ICPUSDT.P: Massive Upside Potential | Check the Trade Update For Seeing Results
🟠 IDEXUSDT: Spot Buy Area | %26 Profit if You Trade with MSB
📌 USUALUSDT: Buyers Are Active + %70 Profit in Total
🌟 FORTHUSDT: Sniper Entry +%26 Reaction
🐳 QKCUSDT: Sniper Entry +%57 Reaction
📊 BTC.D: Retest of Key Area Highly Likely
📊 XNOUSDT %80 Reaction with a Simple Blue Box!
📊 BELUSDT Amazing %120 Reaction!
📊 Simple Red Box, Extraordinary Results
I stopped adding to the list because it's kinda tiring to add 5-10 charts in every move but you can check my profile and see that it goes on..
ETH-----Sell around 2600-2630, target 2550-2580 areaTechnical analysis of ETH contract on May 16:
Today, the large-cycle daily level closed with a small negative line yesterday, and the K-line pattern was a single positive line with continuous negative lines. The price was consolidating at a high level. The attached indicator golden cross was running with a shrinking volume. Although the current trend signal of Ethereum is not as obvious as that of the big cake, we can see that the price rebounded yesterday and did not break upward, which shows that the price is still suppressed to a certain extent; the current pressure position of the short-term hourly chart is near the 2650 area, and the low point support is in the 2425 area. In terms of trend rules, the high point on the 11th was under pressure in the 2630 area, and the 12th was also under pressure in the 2630 area. Although the current price is at a high level, it does not continue the trend of breaking high, so it is easy to be under pressure and retreat.
Therefore, today's ETH short-term contract trading strategy: short in the 2600-2630 area, stop loss in the 2660 area, and target the 2550-2580 area;

Reploy (RAI) – Web3 x AI Revenue-Earning Project with 61x UpsideReploy (RAI) is a rapidly emerging project at the intersection of Web3 and artificial intelligence, designed to streamline how developers build, deploy, and monetize AI agents across blockchains. Unlike many speculative tokens, Reploy stands out for one critical reason: it already earns real revenue.
According to Reploy.ai, the platform offers a no-code/low-code experience that allows anyone to launch custom AI agents and integrate them into DeFi protocols, gaming environments, and decentralized applications. Their architecture combines an on-chain identity layer with decentralized agent hosting, positioning RAI as core infrastructure for the next evolution of intelligent Web3 tools.
The project is still under the radar, trading well below $2, but the fundamentals support a much larger valuation. My 12–18 month price target is $105, which represents a 61x increase from today’s levels. This forecast is based on:
Early revenue traction from agent deployment and API integrations
Strong market tailwinds for decentralized AI applications
Platform stickiness due to unique agent monetization tools and developer incentives
Token utility driving recurring demand (staking, gas, and access control)
RAI isn’t just another AI narrative coin, it's building real infrastructure, already being used, and gaining traction. As adoption grows and more AI agents are hosted through the protocol, the value capture for RAI token holders could be exponential.
Price Target: $105
Current Price: ~$1.72 (as of May 2025)
Upside Potential: +6,000%

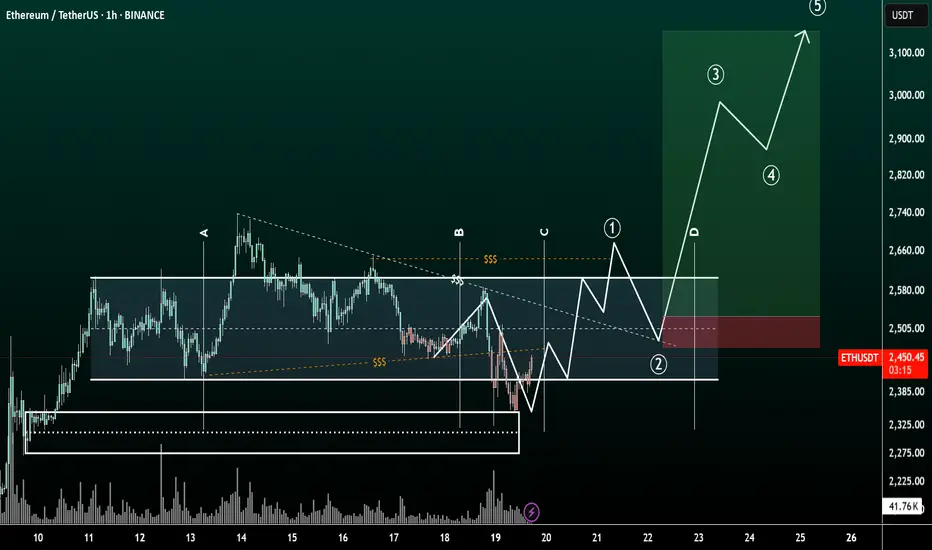
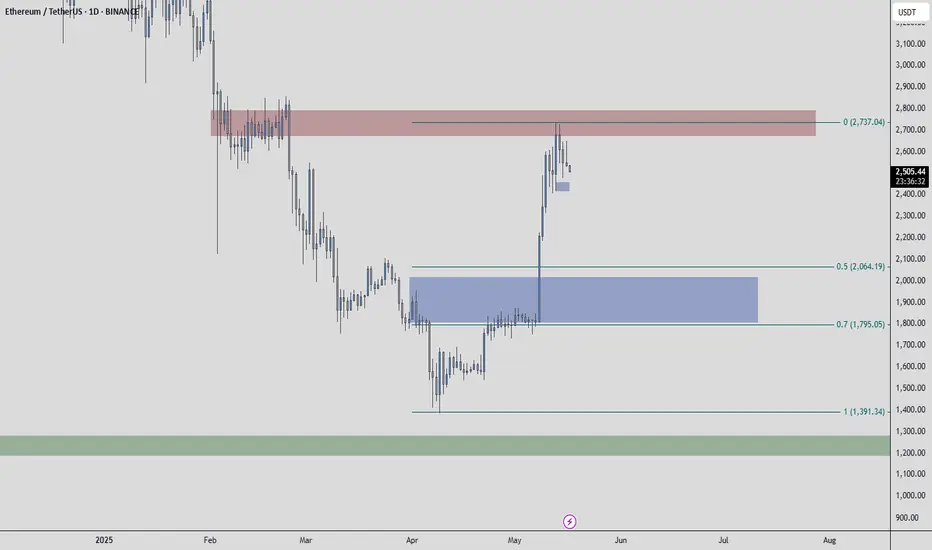
Ethereum Trap Play Complete – Time to Pump!Trap + deviation strategy in play!
Price faked out below structure, collected liquidity, and reclaimed trendline.
Expecting ETH to continue bullish inside the rising channel.
Target: $2738 | SL: Below $2500

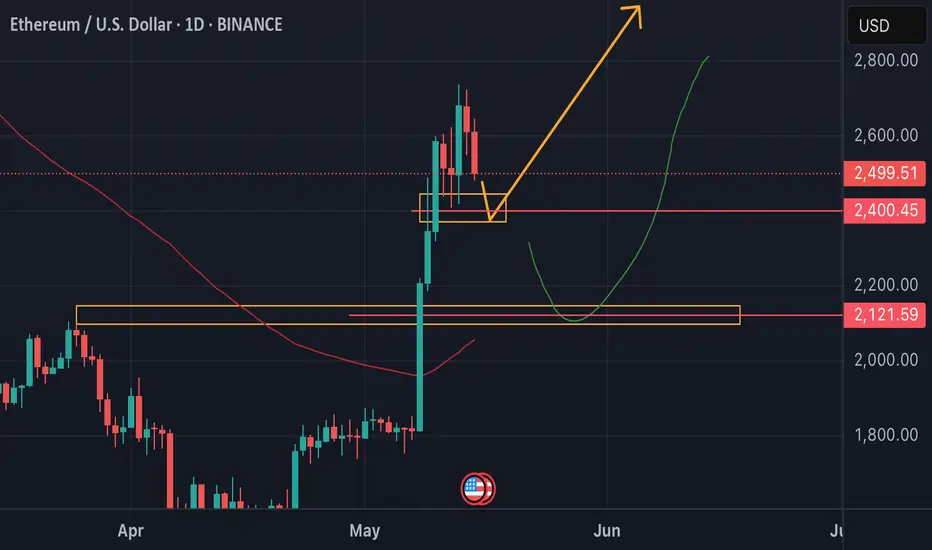
ETH ANALYSE We have two key levels to watch on ETH:
- Either the price reacts upwards on the $2401 level in H4,
- Or it falls further and reacts at the $2,121 Daily level.
Either way, the fall should not last too long.
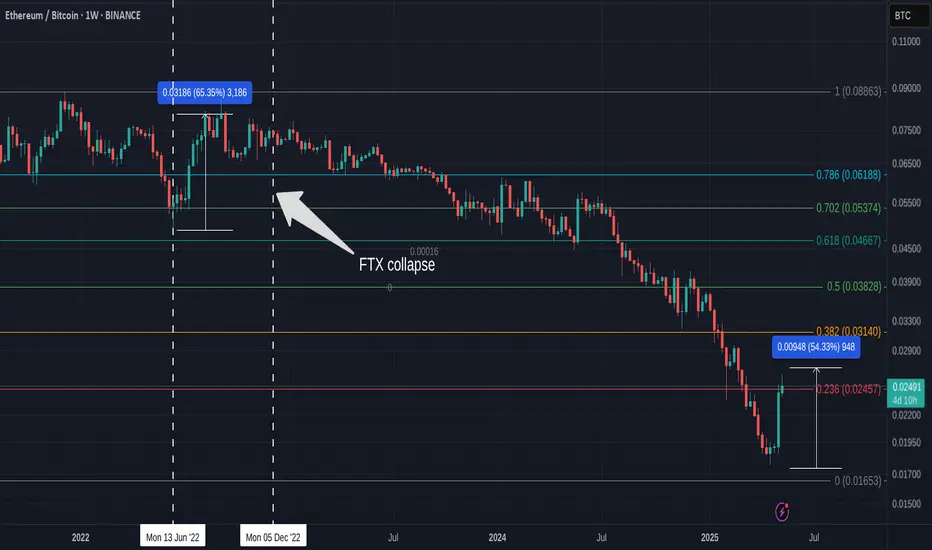
ETHEREUM push higher, previous push and FTX collapse connection
Anyone that knows me fully understands that I DISLIKE ETHEREUM A lot...Foe many reasons - So, please read this but understand, I am not going to paint many Rosey, Bright images about it....Mostly because there are NONE
For a start, the staking model giving Voting abilities DEPENDING ON HOW MUCH eth YOU HOLD..... is NOT decentralised Crypto
And the simple Fact that the American SEC refused to ever call ETHEREUM a Security while pointing its fingers at ALL others just leads me to feel that ETHEREUM is the Crypto of the American State...
Many think it was the 2nd Crypto to be released, the First ALT.
LITECOIN was the first..ETH arrived Late on the scene in 2013.
the ONLY thing that makes it 2nd is its Market Cap
SO, the Chart
The last Time ETH made a serious push was back in the middle of a BEAR market !
June 2022, while everything esle was dropping, dipping and crashing..... ETH made a push.
Suspicious from the start
With out to many details, FTX, another american Crypto "Baby" was likely responsible while manipulating the market as CZ from Binance stated at the time ( funny how the USA demanded he return and spend time in prison AT A LATER DATE huh )
Anyway, After this push, ETH Dipped sharply and recovered and then Ranged until the day that FTX collapsed.
And then look at what happened.
DROPPED while Every other Crypto in the world recovered some.
JAN 2023 - the beginning of the Recovery from a deep bear for crpyto.....
Except ETHEREUM - iT DROPPED AS MOST PEOPLE IN THE KNOW UNDERSTOOD JUST WHAT eth IS.
And now, With the President Trump Crypto loving American Dream coming alive, ETH decides to wake up after a Long Sleep....Why now ? Why not earlier ????
AND I STILL DO NOT TRUST IT
You can buy it, trade it, Just do not hold it is my opinion.
And it is at 54% right now...
Can it go higher ?
All depends on what the next phase of the USA CRYPTO DREAM has in store.
ETH last push in 2022 was 64% then ranged while being manipulated.....
Smells the same to me
BUY BITCOIN - HOLD BITCOIN
TRULY DECENTRALISED
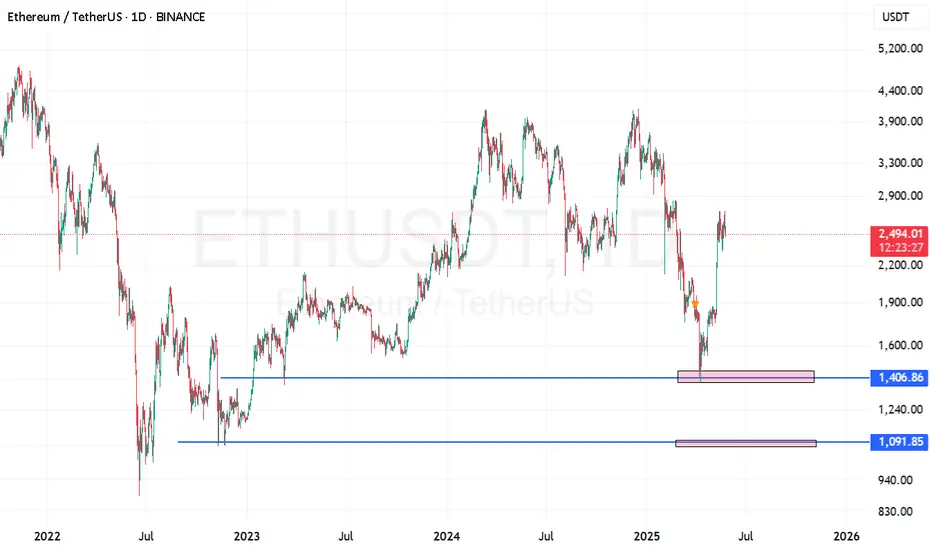
ETH/BTC bear market since 2021.. bounce time ?ETH / BTC
If you checked this chart you will notice that ETH was in downtrend and bear market against BTC since 2021 !
Now we have reached a very important multi years support (price action on 2020 - 2019 - 2016 )
Time for bounce soon ?

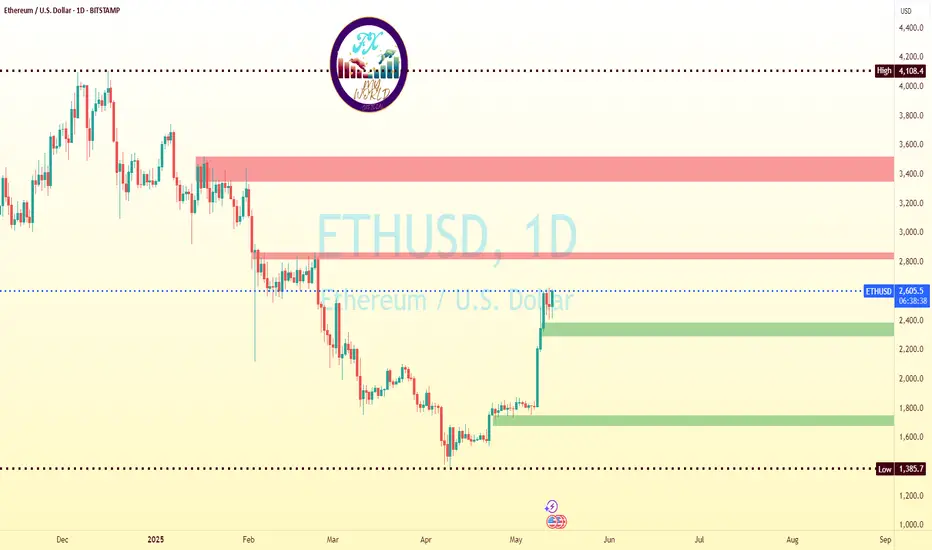
ETHUSD Multi Time Frame Trend Analysis, Profit Surging InsightsDaily Chart (1D) Overview
The daily chart reflects a powerful bullish breakout, where ETHUSD surged past prior resistance levels, now potentially turning into support. Key observations:
Support Zones:
The $2,300 to $2,400 zone has emerged as a strong demand area. This zone was previously resistance and has now flipped into support after the breakout.
A deeper retracement could potentially revisit the $1,750 to $1,850 demand area, though that would suggest a breakdown of current bullish momentum.
Resistance Zones:
The price is currently testing minor resistance around $2,600 and $2,650, with historical supply and reaction zones visible from previous consolidation.
A broader supply zone exists between $2,800 to $3,400, marked in red, which could be the next major target area if the bulls maintain momentum.
Structure:
ETH formed a higher low in late April followed by a higher high in early May, confirming a trend reversal from the earlier bearish structure.
The clean breakout from consolidation signals a fresh bullish leg, with increasing volume and momentum indicators likely aligning with upward bias.
Trend Direction: Bullish on both Daily and 4H
✅ Market Structure: Higher highs and higher lows
✅ Key Short-Term Support: $2,350 to $2,450
✅ Key Resistance Zones: $2,620 to $2,650 → $2,800 → $3,400
✅ Upside Targets:
1. Short-Term: $2,650 → $2,800
2. Medium-Term: $3,400 → $4,108
✅ Potential Retracement Levels:
3. Shallow: $2,420
4. Deeper: $2,200 and $1,850
If the price holds above $2,400, the bullish outlook remains intact, with increasing likelihood of testing higher resistance levels. However, a sustained move below $2,300 could trigger deeper retracements.
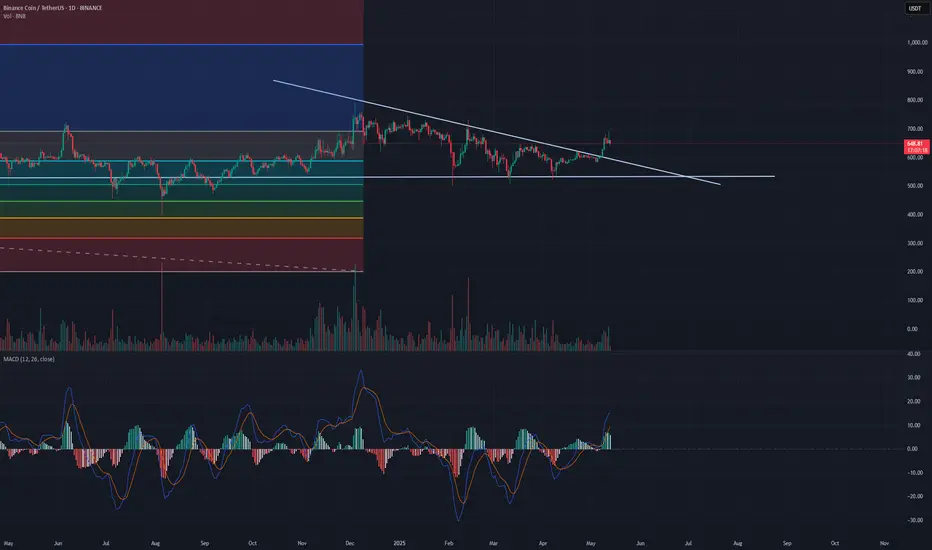
Very critical position for BNB long-term levelFrom a structural perspective, BINANCE:BNBUSDT BNB's daily and weekly charts, along with long-term indicators, appear to be at a critical inflection point.
If it can successfully break through this level—especially with support from macro fundamental developments—a new trend may emerge.
However, technical analysis can only serve as a reference and should not be relied upon as a predictor of long-term value realization.