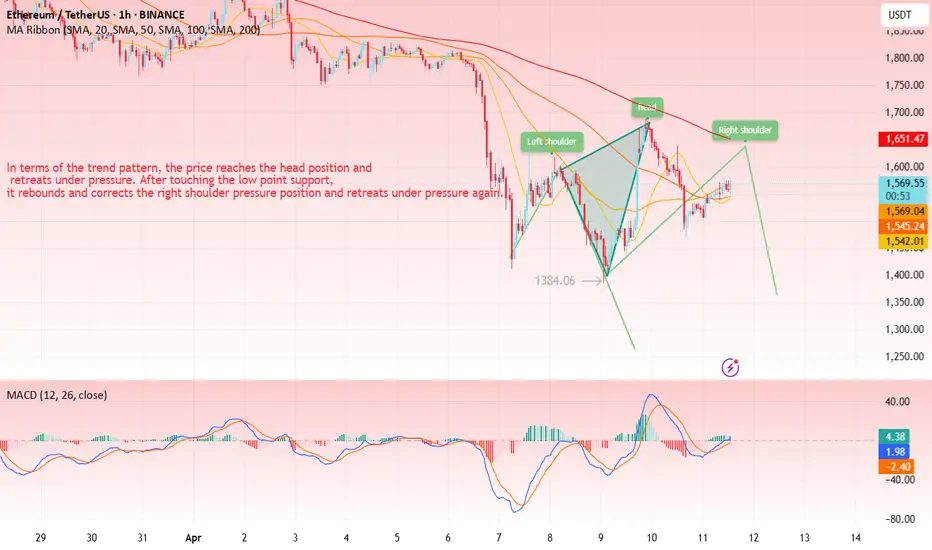
ETH(20250429) market analysis and operationTechnical analysis of ETH contract on April 29: Today, the large-cycle daily level closed with a small positive line yesterday, and the K-line pattern was a single negative line. The price was consolidating at a high level. The attached indicator was in a golden cross operation. The overall trend of rising is still obvious. However, it should be noted that the price seems strong but the rebound did not break the high and did not continue. Instead, it quickly retreated under pressure after touching the high pressure level. At the same time, the low point moved up. In this way, the price will maintain a range of fluctuations before it breaks through the pressure position and support position; the short-cycle hourly chart was also in a range trend yesterday, with a high of 1850 and a low of 1750. The current price is in correction.
Therefore, today's ETH short-term contract trading strategy: buy in the 1750 area when it retreats, stop loss in the 1720 area, target the 1815 area, sell in the 1815 area when it rebounds, stop loss in the 1845 area, target the 1750 area; give real-time trading strategies based on real-time trends during the session
Ethreum

ETH/USDT 1H: Bearish Structure with Potential Bounce ETH/USDT 1H: Bearish Structure with Potential Bounce – Long Setup from Discount Zone
🚀 Follow me on TradingView if you respect our charts! 📈 Daily updates!
Current Market Conditions (Confidence Level: 8/10):
Price at $1,796.97, currently bearish after breaking equilibrium zone.
Hidden bearish divergence visible on RSI, suggesting weakening bullish pressure.
Smart Money likely accumulating positions in the $1,740 – $1,760 discount zone.
Trade Setup (Long Bias):
Entry: Optimal between $1,795 – $1,805 range.
Targets:
T1: $1,840
T2: $1,860
Stop Loss: $1,765 (below recent low).
Risk Score:
8/10 – Smart Money accumulation supports the setup, but confirmation bounce from support is crucial for entry.
Key Observations:
Resistance at $1,820 (previous high) acting as local cap.
Support solid at $1,760 (discount zone), strong reaction expected.
Premium zone between $1,840 – $1,860 ideal for scaling out profits.
Smart Money potentially setting up shorts from premium zone for later liquidity grab below $1,740.
Recommendation:
Wait for clear confirmation of support hold before entering longs.
Manage risk carefully; consider partial scaling at $1,840 and securing full profits at $1,860.
Monitor price action at $1,820 resistance for possible early signs of rejection.
🚀 Follow me on TradingView if you respect our charts! 📈 Daily updates!

ETHUSD SHORT 1PercentFundedTICKER: ETHUSD
ENTRY 1: 1810
ENTRY 2: 1795
SL: 1865
TP1: 1720
TP2: 1680
Trade Active

ETH/USDTHello friends
Given the price growth we had, it is now natural for the price to correct and we will buy in steps during the correction.
The purchase and target points have also been specified...
Follow capital management.
*Trade safely with us*
ETHThe chart looks like Bitcoin’s movement in 2020. I think it will rise to $4,000 by autumn. If it breaks that level, we could see $8,000–$10,000 by 2026, and and possibly even reach $14,000.
At the moment, it’s hard to believe this forecast, but the market can move any way, and there’s always a chance this scenario could happen.
"ETH Breakout Watch: Holding Support for a Push Toward $1900+"ETH 4H chart par price apne key support (purple box) ke upar consolidate kar raha hai. Jab tak yeh support hold karta hai, $1900 - $1920 ka target active rahega.
Agar support toot jata hai to next major demand zone 1660-1680 ke aas paas hai. Tab tak structure bullish hai.
Trading plan simple hai:
✅ Support hold = Buy dips for $1900+
❌ Support breakdown = Wait for lower entries.
Chart clear path dikhata hai, risk manage karte raho! 🚀

A Reversal on ETH/BTC is already on its way.With 80% probability, ETH will soon become stronger than Bitcoin.
Many factors are now on the side of Ether.
I have already written about them, a huge plus is ETH - ETF Staking for the guys from Wall Street.

ETH-----Sell around 1770, target 1700 areaTechnical analysis of ETH contract on April 24: Today, the large-cycle daily level closed with a small positive line yesterday, the K-line pattern continued to rise, the price was at a high level, and the attached indicator was running in a golden cross. The general trend of rising is relatively obvious, but there are two points we should pay attention to. First: After the current four-hour chart is under pressure, the K-line pattern is continuous and negative, the price is below the moving average, and the fast and slow lines of the attached indicator have signs of sticking and dead cross; Second: Yesterday's high did not continue, so a retracement and decline within the day is a high probability event; the short-cycle hourly chart did not continue to break upward after yesterday's price continued to fluctuate at a high level. Today, it began to retreat under pressure. The current price is below the moving average, and the attached indicator is running in a dead cross, so let's take a look at the strength of the decline within the day.
Today's ETH short-term contract trading strategy: Sell directly at the current price of 1770 area, stop loss in the 1800 area, and target the 1700 area;
ETH-----Buy around 1715, target 1800 areaTechnical analysis of ETH contract on April 23: Today, the large-cycle daily level closed with a big positive line yesterday, and the K-line pattern continued to rise. The price stood above the moving average, and the attached indicator was running in a golden cross. The current rise in the big trend is obvious. The previous high pressure position of 1700 is currently converted into the support position below, so the main idea is to keep retracement and do more; the short-term four-hour chart K-line pattern continued to rise, and the attached indicator was running in a golden cross, but the price deviated from the moving average and returned to the moving average support area of 1715. The hourly chart hit the high point in the morning and then came under pressure. From this point of view, it is likely to be a correction trend during the day, and the strength mainly focuses on the strength of the European session.
Therefore, today's ETH short-term contract trading strategy: sell at the current price of 1790, stop loss in the 1820 area, target 1735-1715 area, buy at the 1715 area, stop loss in the 1685 area, target 1800 area;

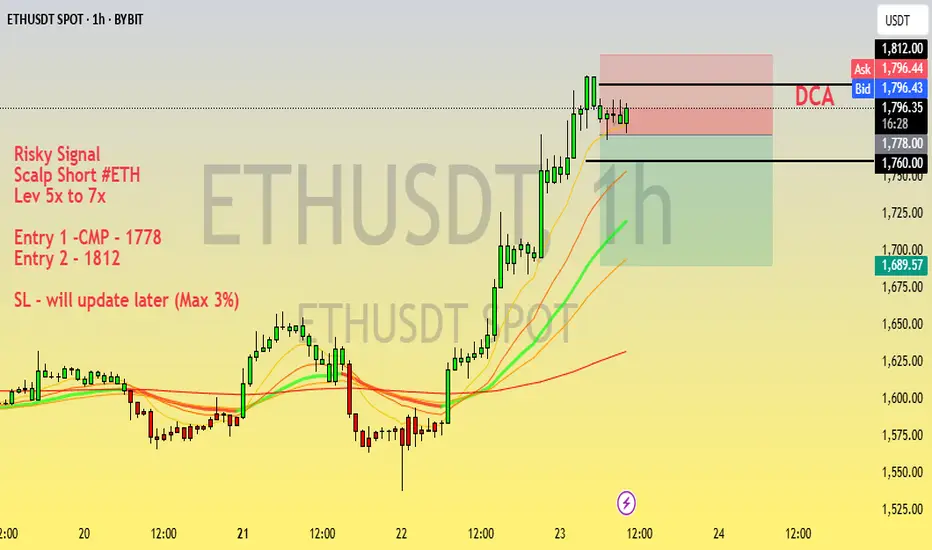
Risky Scalp Short | $ETH @ CMP 1778 | 5x–7x LeverageHigh-risk scalp short on ETH based on intraday price action and overextension signs.
Trade Plan:
Entry 1: CMP ~1778
Entry 2: 1812
Leverage: 5x to 7x
SL: To be updated (Max 3% risk)
Quick scalp — watch closely for volatility & potential fakeouts.
⚠️ High-risk trade. Not financial advice. For educational purposes only. Use proper risk management.
#ETH/USDT#ETH
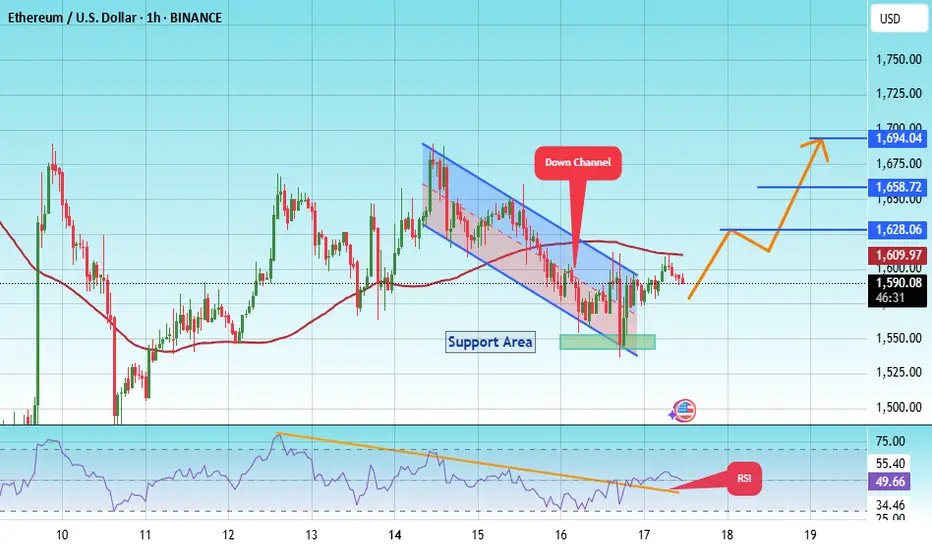
The price is moving within a descending channel on the 1-hour frame, adhering well to it, and is heading for a strong breakout and retest.
We are seeing a rebound from the lower boundary of the descending channel, which is support at 1555.
We have a downtrend on the RSI indicator that is about to be broken and retested, supporting the upward trend.
We are looking for stability above the 100 moving average.
Entry price: 1591
First target: 1628
Second target: 1658
Third target: 1695
Macro ETH/BTC Bearish Adam & Eve (Double Top)Not looking good for ETH bag holders. The worst merge since the Philadelphia Experiment. Target 0.005 and below.

FET/USDT - Trendline Breakout (22.04.2025)The FET/USDT Pair on the M30 timeframe presents a Potential Selling Opportunity due to a recent Formation of a Breakout Pattern. This suggests a shift in momentum towards the downside in the coming hours.
Possible Short Trade:
Entry: Consider Entering A Short Position around Trendline Of The Pattern.
Target Levels:
1st Support – 0.553
2nd Support – 0.516
🎁 Please hit the like button and
🎁 Leave a comment to support for My Post !
Your likes and comments are incredibly motivating and will encourage me to share more analysis with you.
Best Regards, KABHI_TA_TRADING
Thank you.

ETH USDTCRYPTOCAP:ETH price remains extremely compressed, showing minimal movement for nearly 3 days. This type of consolidation often comes before a significant move — now it's just a matter of waiting for the breakout in either direction.

ETH: NEW UPDATEHello friends
Given the price decline we had and the lower lows that the price made in a support area, you can see that buyers entered and broke the downtrend and made higher lows, which is expected to move the price to the specified targets.
*Trade safely with us*
ETH-----Sell around 1610, target 1550 areaTechnical analysis of ETH contract on April 16:
Today, the large-cycle daily level closed with a small negative line yesterday, and the K-line pattern was a single negative and a single positive, but the price was still below the moving average. The attached indicator dead crosses and the fast and slow lines are golden crosses, but the pressure is below the zero axis. In this way, the current pullback trend can only be regarded as a correction, because the price has not stood on the moving average and has not broken the previous high. It is easy to fall under pressure for the second time when the indicators are not unified; the current K-line pattern of the four-hour chart has fallen continuously, and the attached indicator dead crosses. The price is below the moving average, and the pressure position of the pullback moving average is near the 1610 area. The short-cycle hourly chart was under pressure in the US market yesterday and was corrected in the Asian time today. The trend pattern is still the same, and the correction pullback cannot be large.
Therefore, today's ETH short-term contract trading strategy: sell at the pullback 1610 area, stop loss at the 1640 area, and target the 1550 area;
Is Ethereum DEAD ?🚨🚨🚨Important Video 🚨🚨🚨
MartyBoots here , I have been trading for 17 years and sharing my thoughts on ETH here.
.
Is COINBASE:ETHUSD DEAD?
Very interesting chart but Tariffs could do more damage
Important Video
Watch video for more details

Caution on Crypto, Tech, SPXI know its a mess, this is just for me anyway.
I tend to overcomplicate things so now then, lets over simplify for my monkey brain:
Trend line broken = Warning, thing are likely to change ( even though you didnt get the bull market you wanted)
Watch said trend retest, look for weakness, struggling price action
selling on the retest of the top lows last time would offer you 5% off the peako top, (Thats really good!! stop being a perfectionist)
I am very much frustrated with this market, never got the crazy part I was waiting for. But the lack of euphoria is really not that unreasonable when you think about what has been goin on the past 5 years. Everyone is poorer liquidity has been super tight to curb inflation and we still got NASDAQ:NDX up 150% Coinbase NASDAQ:COIN did a 10x and I still am not happy(likely due to the max pain trade of my life COINBASE:ETHUSD ). I have realized that I have been hoping for another 2018 bull run. It may or may not happen, but I can't expect any market to reflect that in any significant way. Markets are much more dynamic than I give them credit for sometimes. They will rhyme but often in ways you do not expect and will not be made clear until that little bastard hindsight kicks in, showing you how obvious it was.
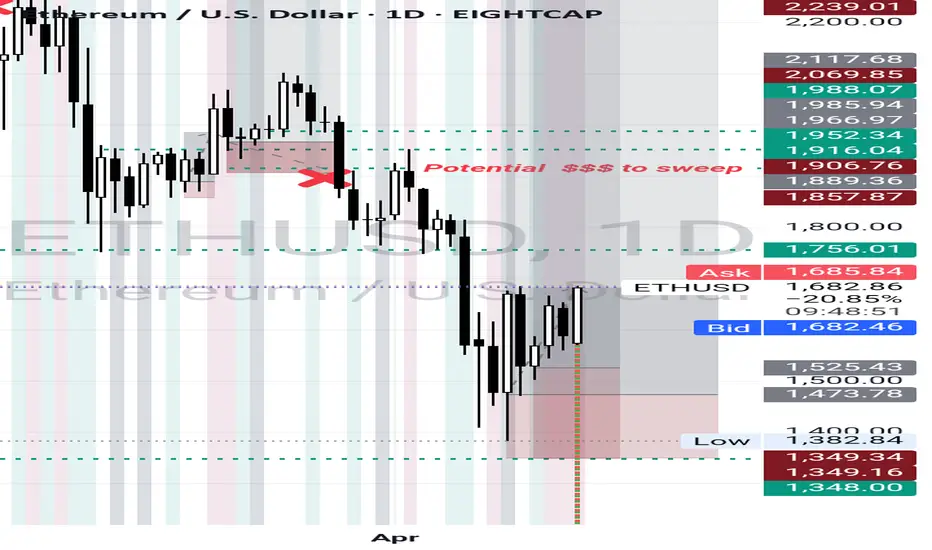
$ETHUSD Buy After the recent drop in prices of major crypto currencies, BITSTAMP:ETHUSD seemed poised to rally and 1,756 to 2000 remains a crucial zone to see watch because price moving above would mean a solid recovery and possibly a new all time high
EHT/USDT:BUY...Hello friends
Due to the heavy price drop we had, the market fell into fear and at the specified support, buyers supported the price, which is a good sign that we should buy within the support ranges with capital management and move with it to the specified targets.
(Always buy in fear and sell in greed)
*Trade safely with us*
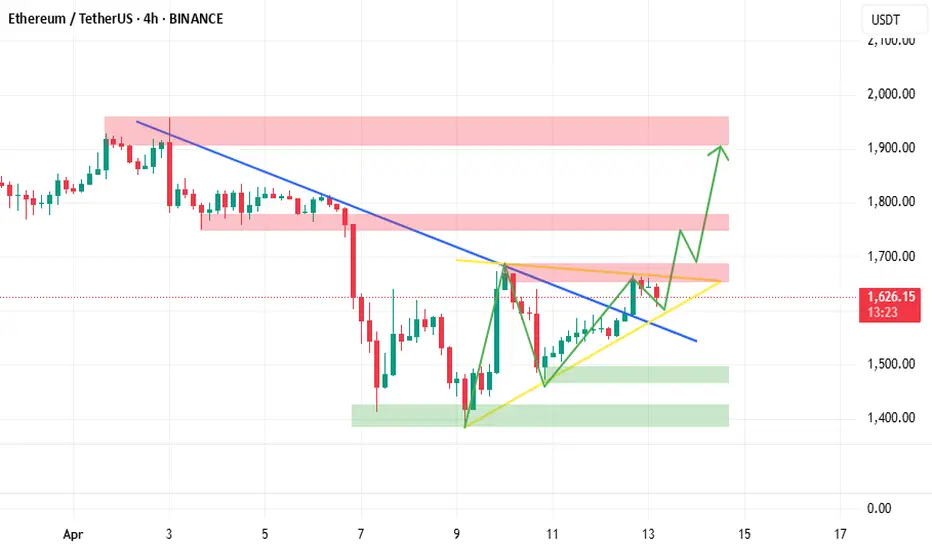
ETH back to 1900$ soon?ETH has broken the downtrend line and just completed a successful retest. Price is now moving within a new compression triangle, showing signs of consolidation before the next move.
Meanwhile, BTC is showing positive signals, adding momentum to the market.
📊 Breakout loading? Stay sharp.
The analysis provided reflects personal opinions only and does not constitute investment advice.
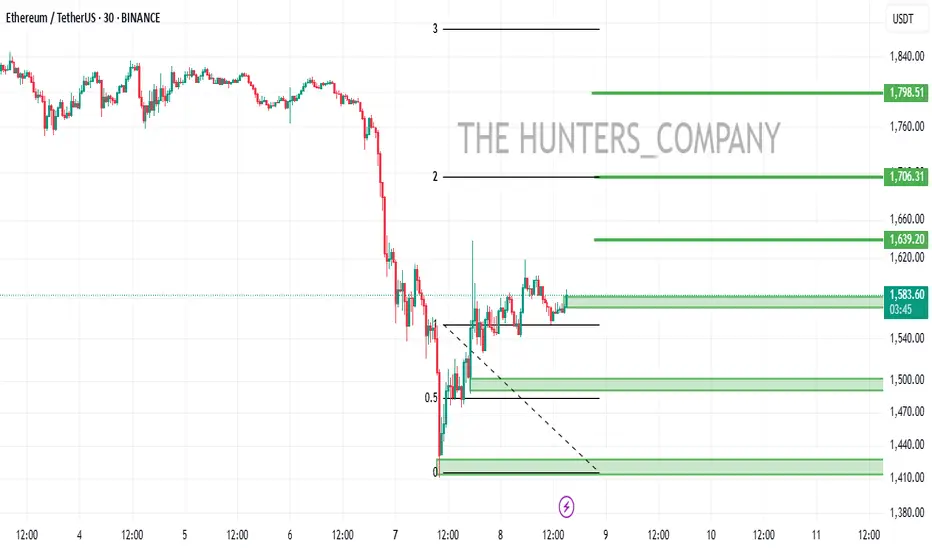
ETH-----Sell around 1600, target 1530-1505 areaTechnical analysis of ETH contract on April 11:
Today, the large-cycle daily level closed with a small negative line yesterday, and the K-line pattern was a single positive line with continuous negative lines. The price was below the moving average, and the attached indicator was dead cross. The downward trend in the big trend is still very obvious. Yesterday, we also explained that the suppression at the weekly level was very obvious, so it is difficult to break the high, continue, and form a trend. This is what we need to clarify first; the short-cycle hourly chart yesterday continued to fall in the European session and the US session, and the price support rebounded in the early morning. This is also expected. The right shoulder pressure of the head and shoulders top pattern is near the 1600 area. Yesterday, it reached the low point and rebounded to the right shoulder peak and then fell to complete the head and shoulders top pattern. Isn’t this very clear?
Therefore, today’s ETH short-term contract trading strategy: sell at the rebound 1600 area, stop loss at the 1630 area, and target the 1530-1505 area;
Warning: Low Ethereum Target LoomsThe Unthinkable Target: Is $1,000 ETH Really in Play?
Suggesting Ethereum could fall back to $1,000 might seem hyperbolic to those who remember its peak near $5,000. However, the crypto market is notorious for its brutal volatility and deep drawdowns. Bitcoin itself has experienced multiple corrections exceeding 80% from its all-time highs throughout its history. While Ethereum has matured significantly, it's not immune to severe market downturns or shifts in narrative dominance.
A $1,000 price target represents a roughly 65-70% decline from prices seen in early-to-mid 2024 (assuming a starting point around $3,000-$3,500) and an approximate 80% drop from its all-time high. While drastic, such a move could become plausible under a confluence of negative circumstances:
1. Severe Macroeconomic Downturn: A deep global recession, coupled with sustained high interest rates or a major credit event, could trigger a massive risk-off wave across all assets, hitting speculative investments like crypto particularly hard.
2. Regulatory Crackdown: Punitive regulations targeting DeFi, staking, or specific aspects of Ethereum's ecosystem could severely damage sentiment and utility.
3. Technological Stagnation or Failure: Major setbacks in Ethereum's scaling roadmap or the discovery of a critical vulnerability could erode confidence.
4. Sustained Loss of Narrative: If competing blockchains definitively capture the dominant narrative for innovation, speed, and cost-effectiveness, ETH could lose its premium valuation.
5. Technical Breakdown: A decisive break below key long-term support levels (like the previous cycle highs around $1,400 or psychological levels like $2,000) could trigger cascading liquidations and stop-loss orders, accelerating the decline towards lower supports, including the $1,000 vicinity which acted as significant resistance/support in previous cycles.
While not a base-case prediction for many, the $1,000 target serves as a stark reminder of the potential downside if the current negative pressures persist and intensify, particularly within a broader bear market context. The factors currently driving ETH's weakness provide fuel for this bearish contemplation.
Reason 1: The Underwhelming Arrival of Spot Ethereum ETFs
Following the monumental success of Spot Bitcoin ETFs in the US, which attracted tens of billions in net inflows within months of launch, expectations were sky-high for their Ethereum counterparts. The narrative was compelling: regulated, accessible vehicles would unlock a floodgate of institutional capital, mirroring Bitcoin's ETF-driven price surge.
However, the reality has been starkly different and deeply disappointing for ETH bulls. Since their launch, Spot Ethereum ETFs have witnessed tepid demand, characterized by weak inflows and, at times, even net outflows. The initial excitement quickly fizzled out, failing to provide the anticipated buying pressure.
Several factors contribute to this underwhelming debut:
• Pre-Launch Regulatory Uncertainty: The SEC's approval process for ETH ETFs was far less certain and more contentious than for Bitcoin. This lingering ambiguity, particularly around Ethereum's classification (commodity vs. security) and the handling of staking, may have made some large institutions cautious.
• Lack of Staking Yield: Unlike holding ETH directly or through certain other investment products, the approved US Spot ETH ETFs do not currently offer holders exposure to staking yields – a core component of Ethereum's tokenomics and a significant draw for long-term investors. This makes the ETF product inherently less attractive compared to direct ownership for yield-seeking capital.
• Existing Exposure Channels: Institutional players interested in Ethereum already had established avenues for gaining exposure, including futures markets (CME ETH futures), Grayscale's Ethereum Trust (ETHE, although less efficient pre-conversion), and direct custody solutions. The incremental demand unlocked by the spot ETFs may have been smaller than anticipated.
• Market Timing and Sentiment: The ETH ETFs launched into a more challenging macroeconomic environment and a period of cooling sentiment in the broader crypto market compared to the Bitcoin ETF launch window. The initial risk-on euphoria had faded, replaced by concerns about inflation, interest rates, and geopolitical tensions.
• "Sell the News" Event: As often happens in markets, the period leading up to the ETF approval saw significant price appreciation. The actual launch may have triggered profit-taking by traders who had bought in anticipation of the event.
The impact of these weak ETF flows is significant. It signals a lack of immediate, large-scale institutional appetite for ETH through this specific channel, removing a key bullish catalyst that many had banked on. It also contributes to negative market sentiment, reinforcing the narrative that Ethereum is currently out of favor compared to Bitcoin or other trending assets. Without this expected wave of ETF-driven buying, the price is more susceptible to selling pressure from other sources.
Reason 2: Derivatives Market Flashing Red - Low Interest, Negative Funding
The derivatives market, particularly perpetual futures, provides crucial insights into trader sentiment and positioning. Two key metrics are currently painting a bearish picture for Ethereum: Open Interest (OI) and Funding Rates.
• Low Open Interest (OI): Open Interest represents the total number of outstanding derivative contracts (longs and shorts) that have not been settled. While OI naturally fluctuates, consistently low OI relative to historical peaks or compared to Bitcoin's OI suggests a lack of strong conviction and reduced speculative interest in Ethereum. When traders are uncertain or bearish, they are less likely to open large, leveraged positions, leading to subdued OI. This indicates that fewer market participants are willing to bet aggressively on ETH's future price direction, especially on the long side.
• Negative Funding Rates: Funding rates are periodic payments exchanged between long and short position holders in perpetual futures contracts. They are designed to keep the futures price tethered to the underlying spot price.
o Positive Funding: When the futures price trades at a premium to spot (contango) and bullish sentiment dominates, longs typically pay shorts. This incentivizes shorting and disincentivizes longing, helping to pull the prices back together.
o Negative Funding: When the futures price trades at a discount to spot (backwardation) and bearish sentiment prevails, shorts pay longs. This indicates a higher demand for short positions (either speculative shorting or hedging long spot holdings). Consistently negative funding rates, as observed for ETH during periods of weakness, are a strong bearish signal. It means traders are actively paying a premium to maintain short exposure, reflecting widespread pessimism about the price outlook.
•
The combination of low Open Interest and negative Funding Rates creates a negative feedback loop. It shows reduced speculative appetite, a dominance of short positioning, and a lack of leveraged longs willing to drive the price higher. While extremely negative funding can sometimes precede a "short squeeze" (where rising prices force shorts to cover, accelerating the rally), the persistent nature of these conditions recently suggests underlying weakness rather than an imminent explosive reversal. This bearish derivatives landscape acts as a significant headwind, absorbing buying pressure and making sustained rallies difficult.
Reason 3: The Relentless Rise of Competing Layer-1s
Ethereum's primary value proposition has long been its status as the dominant, most secure, and most decentralized platform for smart contracts and decentralized applications (DApps). However, its reign is facing its most significant challenge yet from a growing cohort of alternative Layer-1 (L1) blockchains, often dubbed "ETH Killers."
While Ethereum still dominates in terms of Total Value Locked (TVL) in DeFi and overall network value, competing L1s like Solana, Avalanche, Cardano, and newer entrants are rapidly gaining ground in crucial areas of network activity:
• Transaction Throughput and Fees: Many competitors offer significantly higher transaction speeds (transactions per second) and dramatically lower fees compared to Ethereum's mainnet. While Ethereum's Layer-2 scaling solutions aim to address this, the user experience on some alternative L1s can feel faster and cheaper for certain applications, attracting users and developers.
• Active Users and Daily Transactions: Chains like Solana have, at times, surpassed Ethereum in metrics like daily active addresses and transaction counts, particularly fueled by specific niches like meme coins, high-frequency DeFi, or certain NFT projects. This indicates a migration of user activity seeking lower costs or specific functionalities.
• Developer Activity and Ecosystem Growth: While Ethereum retains a vast developer community, alternative L1s are aggressively courting developers with grants, simpler tooling (in some cases), and the allure of building on the "next big thing." This leads to vibrant DApp ecosystems growing outside of Ethereum.
• Technological Differentiation: Competitors often employ different consensus mechanisms (e.g., Proof-of-History, Avalanche Consensus) or architectural designs that offer trade-offs favoring speed or specific use cases over Ethereum's current approach (though Ethereum's roadmap aims to incorporate many advancements).
The impact of this intensifying competition is multifaceted. It fragments liquidity and user attention across multiple platforms. It challenges the narrative of Ethereum's unassailable network effect. Crucially, it reduces the relative demand for ETH itself, which is needed for gas fees and staking on the Ethereum network. If users and developers increasingly opt for alternative platforms, the fundamental demand drivers for ETH weaken, putting downward pressure on its price relative to these competitors and the market overall. Ethereum is no longer the only viable option for building or using decentralized applications, and this increased competition is clearly impacting its market position and price performance.
The Path to Reversal: What Needs to Change for Ethereum?
Despite the current headwinds and the looming shadow of lower price targets, Ethereum is far from dead. It possesses a resilient community, the largest developer base, significant first-mover advantages, and a comprehensive roadmap for future upgrades. However, a sustainable trend reversal requires tangible progress and shifts across several fronts:
1. ETF Flows Must Materialize: The narrative needs to shift from disappointment to tangible success. This requires sustained, significant net inflows into the Spot ETH ETFs, potentially driven by broader institutional adoption, clearer regulatory frameworks globally, or perhaps future ETF iterations that incorporate staking yields (though regulatory hurdles for this are high).
2. Derivatives Sentiment Needs to Flip: Open Interest needs to build substantially, indicating renewed speculative conviction. More importantly, funding rates need to turn consistently positive, signaling a shift towards bullish positioning and leveraged longs re-entering the market.
3. Successful Execution of Ethereum's Roadmap: Continued progress and successful implementation of Ethereum's scaling solutions are paramount. Wider adoption and tangible impact from upgrades like Proto-Danksharding (EIP-4844) reducing Layer-2 fees, and clear progress towards future milestones like Verkle Trees and Statelessness, are needed to demonstrate Ethereum can overcome its scalability challenges and maintain its technological edge.
4. Reigniting Network Activity and Demand: Ethereum needs compelling new applications or upgrades to existing protocols that drive genuine user demand and increase the consumption of ETH for gas. This could come from innovations in DeFi, NFTs, GameFi, decentralized identity, or other unforeseen areas. The narrative needs to shift back towards Ethereum as the primary hub of valuable on-chain activity.
5. Favorable Macroeconomic Conditions: Like all risk assets, Ethereum would benefit significantly from a broader shift towards risk-on sentiment, potentially fueled by central bank easing (lower interest rates), controlled inflation, and stable global growth.
6. A Renewed, Compelling Narrative: Ethereum needs a clear and powerful story that resonates beyond its existing user base. Whether it's focusing on its superior security and decentralization, its role as the foundational "settlement layer" for the digital economy, or a new killer application, a refreshed narrative is needed to recapture investor imagination and justify a premium valuation.
Conclusion: Ethereum at a Critical Juncture
Ethereum's recent price struggles are not arbitrary; they are rooted in tangible factors: the lackluster performance of its spot ETFs, bearish signals from the derivatives market, and the undeniable pressure from faster, cheaper Layer-1 competitors. These elements combine to create an environment where contemplating a fall towards $1,000, while bearish, is a reflection of the significant challenges the network faces.
However, Ethereum's history is one of resilience and adaptation. It has weathered bear markets, technical hurdles, and competitive threats before. The path back to sustained growth and potentially new all-time highs is challenging but not impossible. It hinges on reigniting institutional interest via ETFs, flipping derivatives sentiment, successfully executing its ambitious technological roadmap to counter competitors, and benefiting from a supportive macro environment. Until these positive catalysts materialize convincingly, Ethereum may continue to lag, and the possibility of further downside, even towards the $1,000 mark in a severe downturn, will remain a topic of discussion among market participants navigating the crypto giant's uncertain future.
