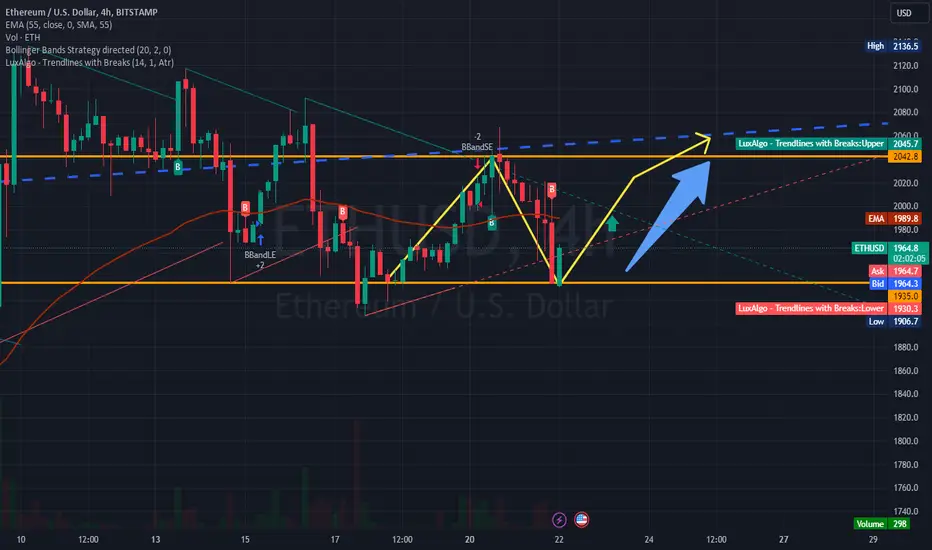
"Ethereum Price Targets a 5% Increase, Testing $2,141 High"The price of Ethereum (ETH) is poised for a 5% increase, aiming to test the highest level within the $2,141 range before a potential correction. The trend-breaking tool continues to play a supportive role as a key level, with immediate support standing at $2,029, maintaining its position above the ETH peaks. Similar to Bitcoin, the RSI indicator is on the verge of crossing above the signal line, indicating the potential for an upward move.
However, if sellers take control, Ethereum's price could fall into the supply zone, acting as a trend-breaking tool, confirming a continuation of the southward movement by breaking and closing below the midpoint of this order block at $1,935.
The downturn may extrapolate, causing Ethereum's price to bring the trend-breaking tool back into the supply zone below the support level of $1,864.
Ethusdanalysis

ETH Looks Bearish; ☁️ Hovering Over - 24 DowntrendBearish clouds ☁️ linger over the global crypto market in the next 24 hours, signaling a downward trend for Bitcoin, Ether, and altcoins. Only Dogecoin sees a slightly bullish ☀️ break, hinting at upside potential, per ATTMO.
Over a one-week horizon, the ☀️ will return, shining over much of the crypto universe. Altcoins like Avalanche, Ripple’s XRP, Polkadot, and Polygon face lingering bearish clouds. ☁️
Follow us for more crypto weather reports!

ETH Ethereum Price Target If you haven`t bought the dip on ETH:
Then you need to know that Binance, along with its CEO 'CZ,' has confessed to federal charges and committed to settling fines amounting to $4.3 billion.
The crypto exchange “admits it engaged in anti-money laundering, unlicensed money transmitting and sanctions violations"!
The question arises: from where will these substantial funds be derived?
One possible source is Binance's Proof-Of-Reserves, which reportedly exceeds 100%.
Among the tokens impacted is ETH Ethereum.
I've set a short-term price target for ETH Ethereum at $1950.
Looking forward to read your opinion about it!

Ethereum ($ETH) Market Situation
The overall market situation for Ethereum remains consistent. The asset is still trading on an upward trend, closely mirroring Bitcoin's movements.
Presently, ETH is hovering around the resistance zone of $2,090-$2,142. If this resistance is broken, it could enable buyers to quickly elevate the ETH price to new highs, possibly reaching the $2,200-$2,300 range.
On the flip side, if Bitcoin undergoes a correction, it's likely to similarly impact Ethereum's price, potentially driving it down to support levels around $1,852-$1,915, $1,791, $1,705, and even $1,630-$1,672.
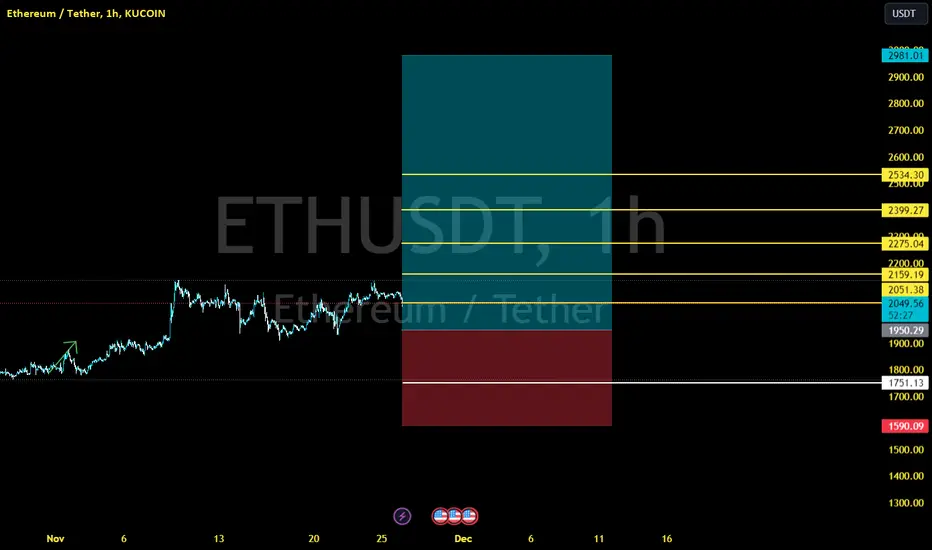
Ethereum Price Struggles to Maintain $1,935 Support LevelThe price of Ethereum (ETH) is at risk of losing a crucial support level at $1,935, marking the midpoint of the supply zone that has become a breaking point for the extended bullish trend ranging from $1,864 to $2,004. If the $1,935 level fails to hold firm, it could spell disaster for token holders, with ETH potentially sliding down to the psychological level of $1,800 or, in severe cases, rendering the bullish argument ineffective below $1,753.
Both the RSI and AO indicators support this outlook, trending southward as momentum continues to weaken. On the flip side, increasing buying pressure is substantial enough to demonstrate Ethereum's ability to overcome the supply barrier mentioned above at $2,009, fostering optimism and potentially propelling ETH back onto the upward trend. This could result in a price increase to $2,136, representing a 10% gain from the current level.
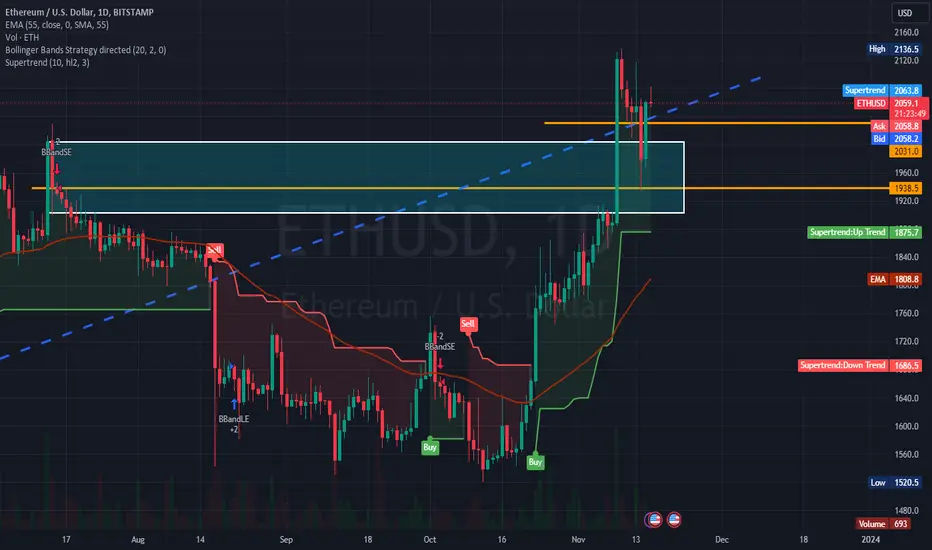
Ethereum Price Signals Potential 60% Surge Ethereum is showing signs of a significant breakout, forming an ascending triangle pattern with three higher lows and three nearly equal highs since June 2022. A decisive weekly close above the $2,000 horizontal resistance could trigger a 43% surge to $2,943.
Currently, Ethereum is holding above the support of the Momentum Reversal Indicator (MRI) at $1,936, indicating potential strength. If Bitcoin's price remains stable, Ethereum is expected to rally towards $2,943, facing resistance at $2,539.
While the target is theoretically $2,943, Ethereum could surpass this and reach $3,186, implying a 60% increase. Conversely, a failure to maintain support above $1,936 may lead to a correction towards $1,795. A weekly close below $1,547 would invalidate the bullish scenario, potentially pushing Ethereum down to $1,309.

ETHUSDT Ascending Triangle Pattern!!ETHUSDT (1h Chart) Technical analysis
ETHUSDT (1h Chart) Currently trading at $1973
Buy level: Above $1970
Stop loss: Below $1941
TP1: $1990
TP2: $2030
TP3: $2075
TP4: $2140
Max Leverage 10x
Always keep Stop loss
Follow Our Tradingview Account for More Technical Analysis Updates, | Like, Share and Comment Your thoughts

"Ethereum Maintains Strong Position Above $1,935 Support Level" Ethereum's price maintains its position above the crucial $1,935 support level, which could spell doom for ETH if breached. With the RSI tilting upwards and AO staying in the positive zone, ETH may extend its upward trajectory, recovering above the $2,029 support to follow the upward trend. This could propel the second-largest cryptocurrency by market capitalization to reach its highest point at $2,136. However, in the face of increased selling pressure, Ethereum's price might dip below the $1,935 support. A decisive move below this level would confirm a downtrend, with ETH potentially testing the 25-day or 50-day EMA at $1,892 and $1,806, respectively.
In a more bearish scenario, Ethereum's price could target the 100-day EMA at $1,763, and breaking and closing below this level would invalidate the bullish argument below the $1,753 support.
Read also: Ethereum Price Prediction: Ascending Triangle Pattern Evaluates $4,000 Target for ETH in 18 Months.
ETH trade setup for 15th Nov 2023My setup yesterday was bullish, I only caught a 1:2rr. I didn't see other factors telling me to go bearish.
I was bent on being bullish, so I know and believe, setups can change. So learning to be dynamic is key and not holding to one belief of how the trade should pane out. However, it was a good day.
Today being, 15th Nov 2023, I'll be expecting a bearish scenario as outline on the chart. So I'll be expecting price to enter into the areas highlighted above and also the rectangle above for a reason to go short at specific time.
This is not a trade advice, please dyor

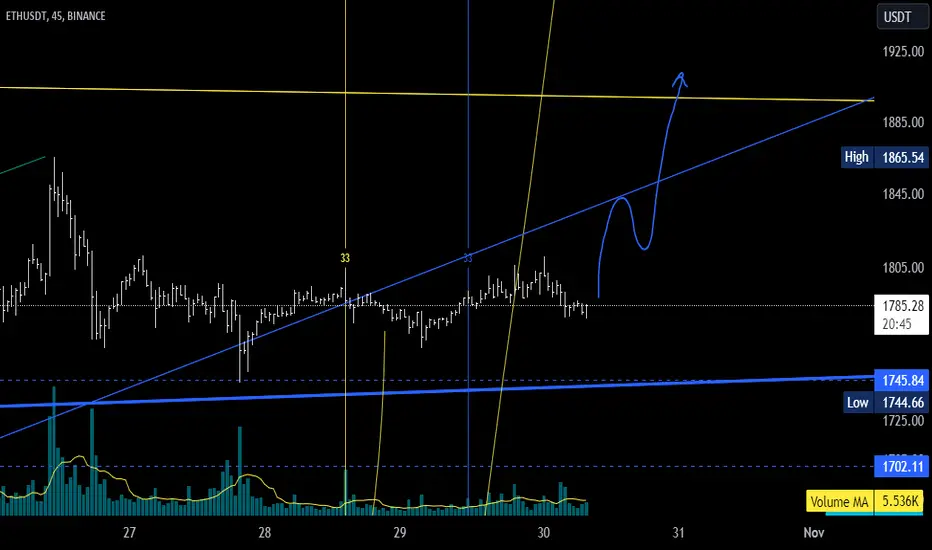
ETH Trade setup for 14th Nov 2023Eth has been bullish compared to BTC, so for me to trade this pair because it refused to make lower low but it also still took out some lows as an inducement to go short however, that's not the actually direction. It's direction is bullish to offset short traders. My possible scenario is for the market to trade into my zone at about 9:30am NY time today, then I can see what price is doing. If there be reasons to go long or short.

ETH: Potential Consolidation Before Targeting $2000ETH might be gearing up for a brief period of consolidation before setting its sights on the $20,000 price mark. This strategic pause can be seen as a part of the natural price journey for Ethereum, allowing it to gather momentum and prepare for the next potential bullish move.
#ETH - thoughts out loud#9Good evening from Ukraine!
Dear colleagues, I am glad to welcome you!
Work plan.
Thank you all for your attention, I wish you success.
Sometimes you win/sometimes you learn.
- thoughts out loud
- thoughts out loud
- thoughts out loud
P.S.
...Think positive
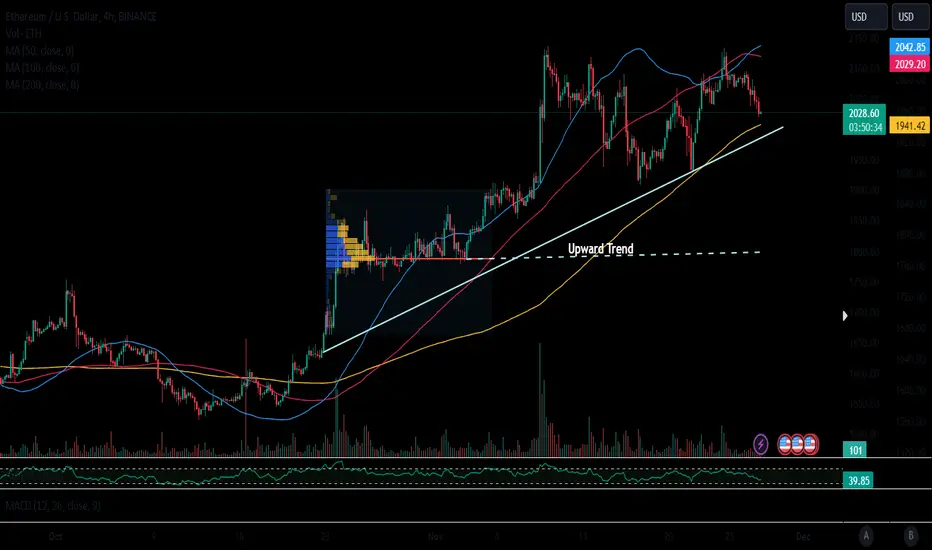
Ethereum's Potential to Reach $2000 TargetEthereum has potential to reach the $2000 target. While it is important to approach such predictions with caution, there are several factors that suggest this milestone could be within reach. This idea aims to provide you with an overview of these factors and encourage you to consider a long position on Ethereum.
1. Market Momentum: Over the past few months, Ethereum has displayed remarkable resilience and has consistently demonstrated an upward trend. Despite occasional volatility, the overall market sentiment towards Ethereum remains positive. This consistent growth is a promising sign for traders who are looking to capitalize on potential long-term gains.
2. Institutional Adoption: Ethereum has gained significant traction among institutional investors, with major financial players showing a growing interest in this digital asset. The increased institutional adoption not only adds credibility to Ethereum but also paves the way for further growth and stability. This trend indicates that Ethereum's potential is being recognized by established financial institutions, which could potentially drive up its value.
3. DeFi and Smart Contracts: Ethereum's blockchain serves as the foundation for a multitude of decentralized applications (dApps) and smart contracts. The explosive growth of the decentralized finance (DeFi) sector has significantly increased the demand for Ethereum, as it remains the preferred platform for most DeFi protocols. As the DeFi space continues to expand and mature, Ethereum is likely to experience increased utility and demand, potentially driving its value higher.
Considering these factors, it is crucial to approach this potential opportunity with a cautious mindset. While Ethereum's growth has been impressive, the cryptocurrency market is inherently volatile, and past performance does not guarantee future results. It is essential to conduct thorough research, assess your risk tolerance, and consider consulting with a financial advisor before making any investment decisions.
If you are interested in exploring a long position on Ethereum, I encourage you to carefully analyze the market, monitor the latest news and developments, and consider setting stop-loss orders to mitigate potential risks. Additionally, staying updated with market trends and being prepared to adapt your strategy accordingly will be key to maximizing your chances of success.
As always, please remember that this idea is not financial advice, and you should conduct your own due diligence before making any investment decisions.

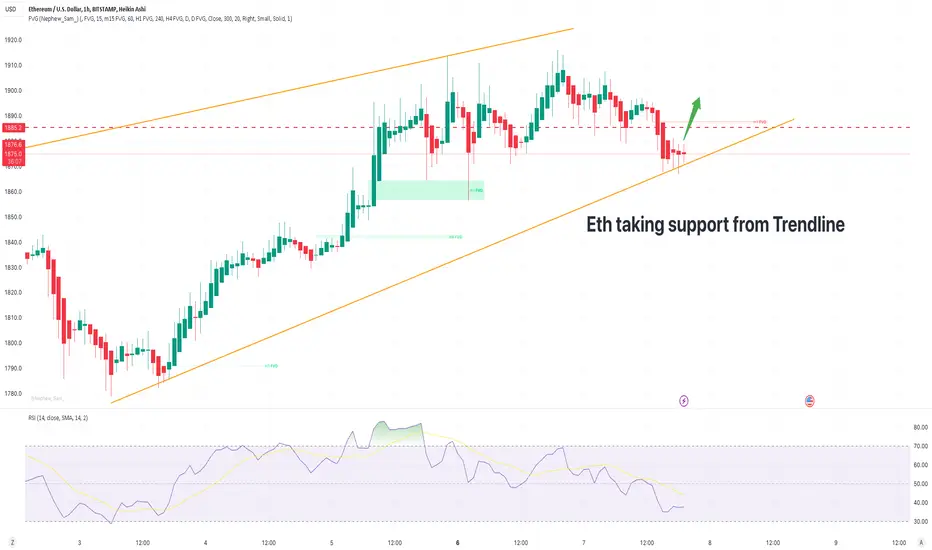
ETHUSD on Trendline SupportEth is on 1hr trendline support, so there is a buy opprtunity.
Manage your risk accordingly.
ETHLeading cryptocurrencies Bitcoin (BTC), Ethereum (ETH) and XRP are showing significant gains, according to data from CoinStats. Today, BTC was up 0.91%, trading at $35,171, with expectations of breaking the $35,612 resistance. If this level is surpassed, BTC is likely to reach $36,000 by the end of this week.
On the other hand, ETH outperformed other cryptocurrencies with a gain of 1.73% and is currently trading at $1,909. If ETH surpasses yesterday's peak, it is predicted to hit the critical $2,000 zone by mid-November.

BTCPossible HTF count if conditions are met. Would be looking for the 3 to top before 1/2ing around SWB:69K

ETHUSD SELL | Day Trading Analysis Hello Traders, here is the full analysis.
Watch strong action at the current levels for SELL . GOOD LUCK! Great SELL opportunity ETHUSD
I still did my best and this is the most likely count for me at the moment.
Support the idea with like and follow my profile TO SEE MORE.
Traders, if you liked this idea or if you have your own opinion about it, write in the comments. I will be glad 🤝
Patience is the If You Have Any Question, Feel Free To Ask 🤗
Just follow chart with idea and analysis and when you are ready come in THE GROVE | VIP GROUP, earn more and safe, wait for the signal at the right moment and make money with us💰


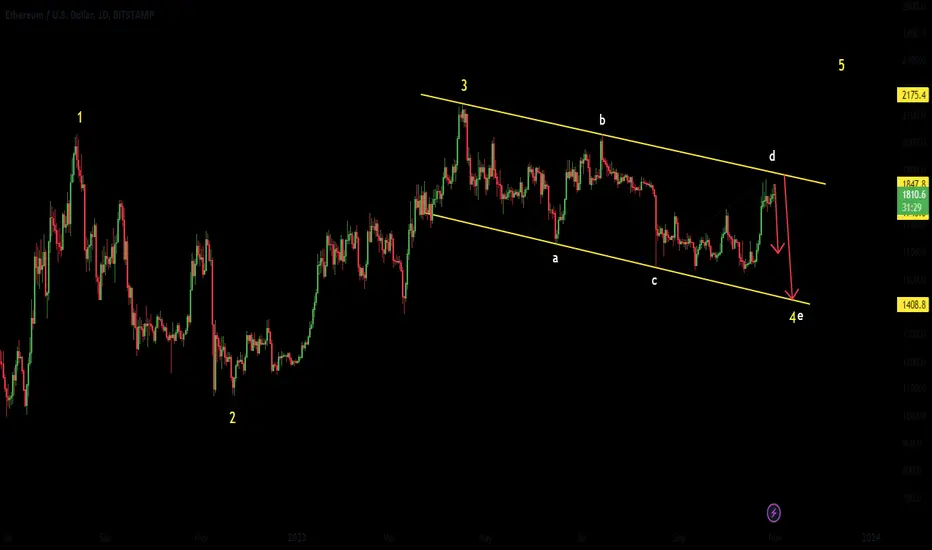
EthereumPair : ETHUSD ( Ethereum / U.S Dollar )
Description :
Bearish Channel as an Corrective Pattern in Short Time Frame and Rejection from the Upper Trend Line or S / R Level. Completed " 1234 - abcd " Impulsive Waves at Fibonacci Level - 38.20%
Entry Precaution :
Wait until it Rejects or Breaks the UTL
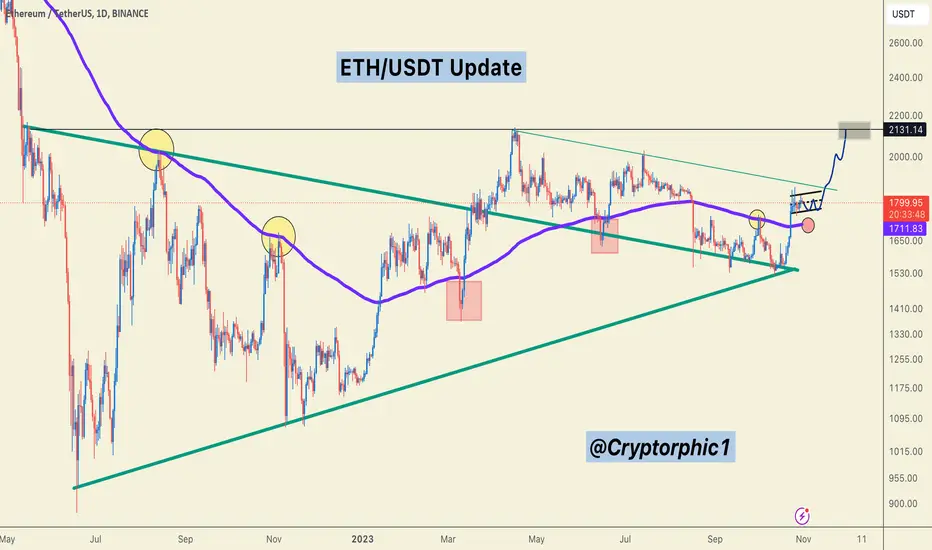
#ETHERIUM Trading Strategy!🚀 #ETHEREUM : A Closer Look 📊
Examining two exciting scenarios:
1️⃣ A retest of the Blue MA, potentially shaking out weak hands and paving the way for a push to $2000-$2130.
2️⃣ A successful breakout and retest of the Blue Flag.
In both cases, bullish sentiment prevails. The Blue MA has a strong track record in previous rallies.
Trading Actions:
For spot holders, HODL strong.
Futures traders, consider entering at $1710 for a long position with a target of $2000+ and a stop-loss below $1635.
#Altcoins may offer better risk-reward ratios thanks to ETH.
Remember to DYOR. This isn't financial advice.
Share your thoughts on ETH! 💬
#Crypto
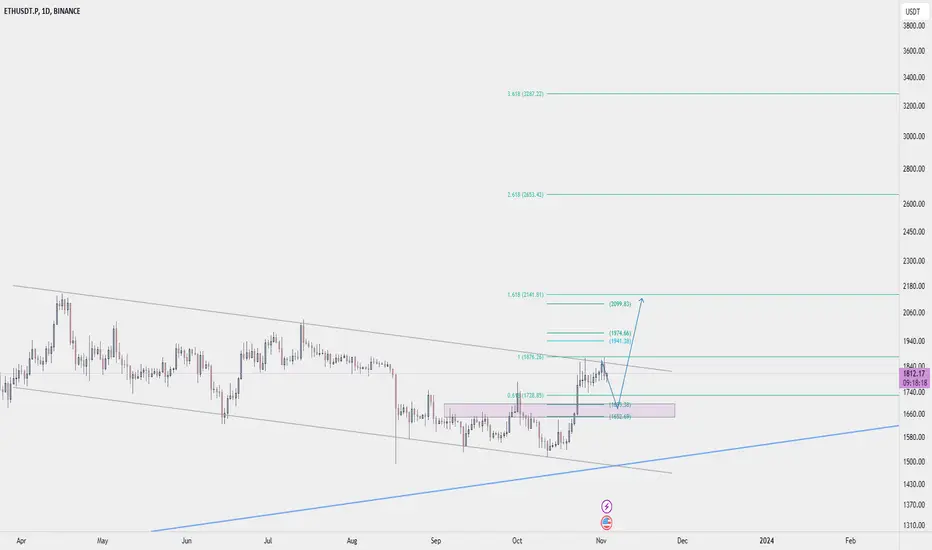
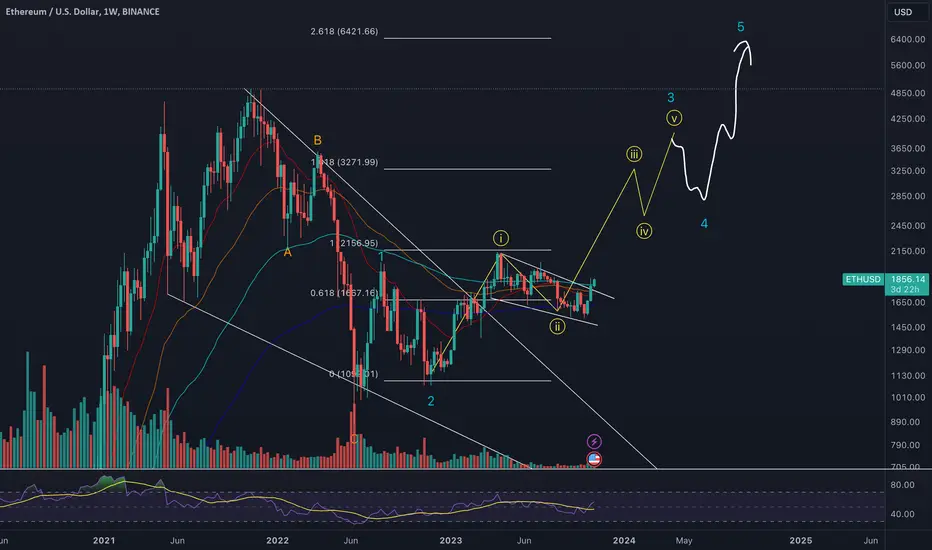
A small dip in ETHEREUM and the a rally towards 3000!!The crypto is seen making impulse waves from June 2022 and has completed a structure of 1-2-I-II till now, meaning it completed the wave II of 3 and started off in the wave III of 3.
The recent oct 2023 rally is the first leg to the bigger III wave that is forming.
It would be a wise to wait for a meaningful retracement to this oct wave for a good entry. The 50% retracement of wave i of wave III of wave 3(i.e. current oct rally) is at 1687 and 61.8% retracement is at 1646. The B wave dip can take the crypto to these levels and that should be considered a good entry to go long towards 3K mark.
Note*- this post is for educational purpose only
