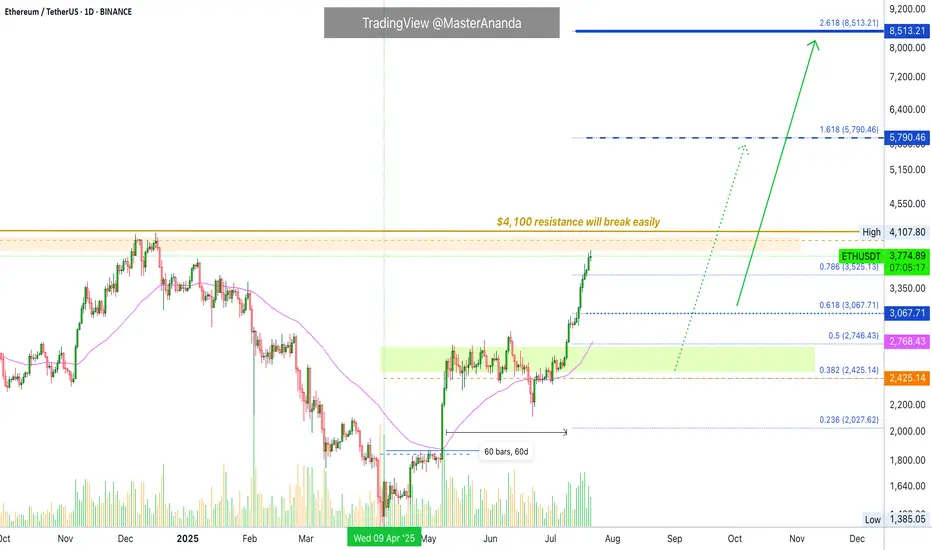
Ethereum Update · Minor Break Below $4,000, Nothing ChangesOk. Straight up has been confirmed but as you already know, the market never moves straight down neither straight up. It seems Ethereum is about to take a small break. This shouldn't alarm you nor be a concern, we are set for sustained long-term growth. When bullish momentum dies down, the market tends to take a break, a pause, before additional growth.
Please remember that these breaks are very tricky, they can last just a few days, say 3-6 days, just as they can go for weeks. It is very hard to predict. In fact, we don't try to predict the duration of those, we simply focus on the bigger picture and know that a new all-time high will be hit in the coming months. This new all-time high will be followed by additional growth.
The short-term can be tricky though. Ethereum will continue rising, but watch out, it can make a pause and this time can be used wisely to profit beautifully from smaller altcoins. Don't let your capital just sit around when it can grow.
Ethereum is awesome but it is also a giant. The smaller altcoins is where the true opportunities lie. The opportunity to quadruple in a matter of months. And this process can be repeated several times for the duration of the bullish cycle.
Namaste.
ETHUSDT
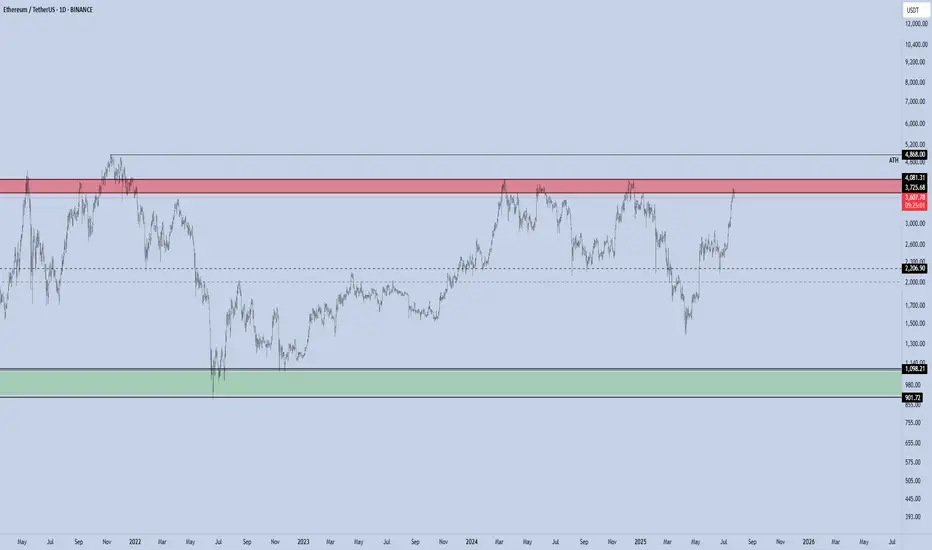
ETH - Altseason ??ETH has rallied sharply and is now entering the major resistance zone between $3,725 and $4,081, which has repeatedly acted as a local top during previous cycles.
This red zone represents a high-supply area, and historically ETH has struggled to break and hold above it without a significant catalyst.
Rejection here could lead to a pullback toward the $2,300–$2,000 range.
A clean breakout and weekly close above $4,081 would flip this resistance into support and open the path toward the all-time high (ATH) at $4,868.
If ETH reclaims this red zone and flips it to support, it will act as a major trigger for a broad Altseason.
Historically, such ETH strength is a key confirmation that capital is rotating from BTC into the altcoin market.
Currently, momentum is favoring bulls unless this red supply zone causes a strong rejection.
Ethereum Ready for Breakout Above $3850?📊 Ethereum Quick Analysis | Breakout or Breakdown?
✅ As long as ETH stays between $3400 - $3600, the bullish outlook remains intact.
🚨 A confirmed close below $3200 could mark the end of the bull market.
🚀 A clean, shadowless candle close above $3850 may push price toward $4100.
⚠️ However:
📉 Expect retail sell-offs around those highs
💸 But heavy institutional buying could send ETH to $6230 in the short term.
🔥 Altseason is officially here — get ready for explosive moves!
🎯 I'm here to track and update all major targets in real-time 💥
#BullRun#altseason#ETH

Check if HA-High indicator is forming at 3587.13
Hello, traders.
If you "Follow", you can always get the latest information quickly.
Have a nice day today.
-------------------------------------
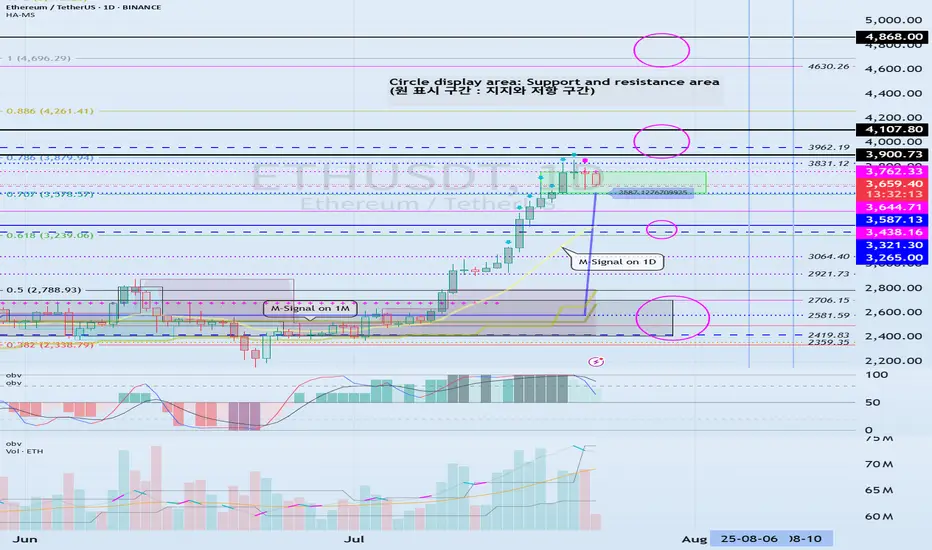
(ETHUSDT 1D chart)
HA-High indicator is showing that it is about to form at 3587.13.
Accordingly, if the HA-High indicator is newly created, the support in the 3587.13-3762.33 section is an important issue.
If it falls below 3587.13, it is likely to touch the M-Signal indicator on the 1D chart.
Therefore, we should check whether it touches the area around 3265.0-3321.30 and rises.
-
This can be seen as a time to test whether it will continue the first step-up trend while rising in the important section of 2419.83-2706.15.
ETH's volatility period is around August 6-10, but we should check what kind of movement it shows after passing the volatility period of BTC.
-
Thank you for reading to the end.
I hope you have a successful transaction.
--------------------------------------------------
- This is an explanation of the big picture.
(3-year bull market, 1-year bear market pattern)
I will explain more details when the bear market starts.
------------------------------------------------------
Look First, Then LeapIn trading, how you prepare matters more than how you react. The phrase “Look first, then leap” reminds traders to avoid impulsive decisions and instead focus on proper analysis, planning, and risk control. Whether you're trading stocks, forex, crypto, or commodities, this principle can save you from painful losses and build a foundation for long-term success.
Let’s break down what it really means to “look first,” and how applying this mindset can improve your trading discipline.
✅Preparation Beats Emotion
Before entering any trade, a trader should ask: What is this trade based on? Logic or emotion?
🔹 Control Impulsive Decisions
Most losing trades happen when people act on gut feelings, FOMO, or after seeing a sudden price spike. But excitement is not a strategy; analysis is.
🔹 Check the Basics First
-What is the market trend? (uptrend, downtrend, or sideways?)
-Are you trading with or against the trend?
-Are there any upcoming news events that might impact the market?
Taking a moment to “look first” gives clarity and filters out low-probability trades.
✅ Trade Only When There’s a Setup
The best trades often come from waiting for the right moment, not forcing entries.
🔹 Identify Clear Patterns
Before jumping in, confirm your strategy setup:
-Is it a breakout or a fakeout?
-Are key support/resistance levels respected?
-Is volume supporting the move?
🔹 Use Confirmation Tools
Indicators like RSI, MACD, and moving averages can support your decision. Price action and patterns like triangle, channel, and flag also provide valuable clues.
Look first means not reacting to the first move; wait for the follow-through.
✅ Always Define Risk and Reward
Entering a trade without a defined stop-loss or target is like jumping into water without checking its depth.
🔹 Use a Risk-Reward Ratio
Before leaping into a trade, ask yourself:
-What am I risking?
-What can I gain?
Aim for a minimum risk-reward ratio of 1:2 or 1:3 to stay profitable even with a lower win rate.
🔹 Position Sizing Matters
Know how much of your capital to allocate. Using 1-2% of your capital per trade helps manage losses and avoid emotional pressure.
✅ Adjust for Market Conditions
Just because you’ve seen success in one type of market doesn’t mean your strategy will always work.
🔹 Trending vs. Ranging Markets
-Trend-following strategies work well in strong trends.
-Mean-reversion or breakout-fade strategies work better in sideways markets.
🔹 Check for Major News or Events
Earnings reports, central bank meetings, or geopolitical events can change everything in seconds. Before entering a trade, look at the calendar.
Adapting to market conditions is part of looking first.
✅ Use a Trading Plan, Not Just a Feeling
Every trade should follow a plan, not just “I think this will go up.”
🔹 What Should Your Plan Include?
Entry and exit rules
-Stop-loss and take-profit levels
-Criteria for valid setups
-Timeframes and trading hours
A plan brings structure and consistency, reducing emotional decisions.
✅ Journaling and Reviewing Trades
Looking first also means learning from the past.
🔹 Keep a Trading Journal
Log every trade entry, exit, reason, emotion, and outcome. This helps you spot mistakes and patterns in your behavior.
🔹 Review Regularly
After a drawdown or losing streak, review your last 10–20 trades. Was your strategy sound? Were you disciplined? Did you look before you leaped?
Improvement comes from reflection and correction.
✅ Be Mentally Ready Before Every Trade
Looking first also means checking your internal state.
🔹 Ask Yourself Before Trading:
-Am I calm and focused?
-Am I trying to recover a loss?
-Am I trading because I’m bored or emotional?
If your mindset is off, step away. A bad state leads to bad decisions—even with a good strategy.
✅Backtest and Practice Before Going Live
Before risking real money, test your setup thoroughly.
🔹 Why Backtesting Helps
It lets you see how your system performs on historical data. This builds confidence and filters out weak strategies.
🔹 Demo Trading Is Smart, Not Weak
Trading in a demo account before going live helps you learn execution, order management, and emotional control—without financial damage.
✅ Protect Capital First, Trade Second
Your first goal isn’t to make money, it’s to stay in the game.
🔹 Survive First, Then Thrive
Big losses can take weeks or months to recover. That’s why looking first is critical—it prevents careless trades that damage your capital.
✅Final Word: Be the Trader Who Waits
The market rewards those who are patient, disciplined, and prepared. Anyone can open a trade, but only those who look first truly understand what they’re doing.
Before your next trade, ask yourself:
“Do I have a clear reason, a defined risk, and the right mindset? Or am I just reacting?”
Because in trading, it’s not how many trades you take, it’s how many good trades you wait for.
In trading, success doesn't come from speed; it comes from clarity, preparation, and discipline. The principle “Look first, then leap” serves as a constant reminder to slow down, observe, analyze, and plan before taking action. It’s a mindset that separates the disciplined trader from the emotional speculator.
Every trade you take should be backed by logic, not impulse. Whether it’s identifying the right setup, managing your risk, or simply being patient enough to wait for confirmation, looking first gives you control in a world that thrives on chaos.
In the end, trading isn’t about making quick money—it’s about making the right decisions consistently. So before your next trade, take a breath, do your research, and ask yourself:
“Am I truly ready to leap, or do I need to look one more time?”
That one extra moment of reflection could be the difference between a lesson and a profit.
Cheers
Hexa🧘♀️
Chart Image Credit: TradingView

ETHUSD SEEMS TO RETEST SUPPORT LEVEL OF 3,500.00ETHUSD SEEMS TO RETEST SUPPORT LEVEL OF 3,500.00
The ETHUSD has hit some resistance at around 3,850.00 this week. But it's since pulled back from that level, which might be a sign of a cooling trend. That's backed up by the RSI going bearish.
Right now, the price is below the 50 SMA on the 1-hour chart, indicating a mid-term downtrend.
We could see the price find some support at 3500.00 or so. Additionally the SMA 200 lays nearby, providing extra support here.

Ethereum Breakout Could Spark the Next Altseason!A Massive Altseason Is Brewing… 🚀
Ethereum just flashed a major monthly breakout after printing a clean Morning Star reversal right at key support.
Now it's pushing against the upper resistance zone, a structure that held it back for over two years.
If CRYPTOCAP:ETH breaks and closes above this level, it won’t just be bullish for Ethereum — it could ignite the biggest altcoin season since 2021.
Why it matters:
📌 ETH is the heart of the altcoin ecosystem.
📌Historical breakouts like this led to 1500%+ moves.
📌The pattern and price action are lining up perfectly again.
Once Ethereum breaks cleanly above $4,000, expect altcoins to explode across the board — Layer 2s, DeFi, AI tokens, and even the meme coins could all start flying.
Keep your eyes on ETH. Its breakout is the spark… the altseason fire is coming.
DYOR | Not Financial Advice

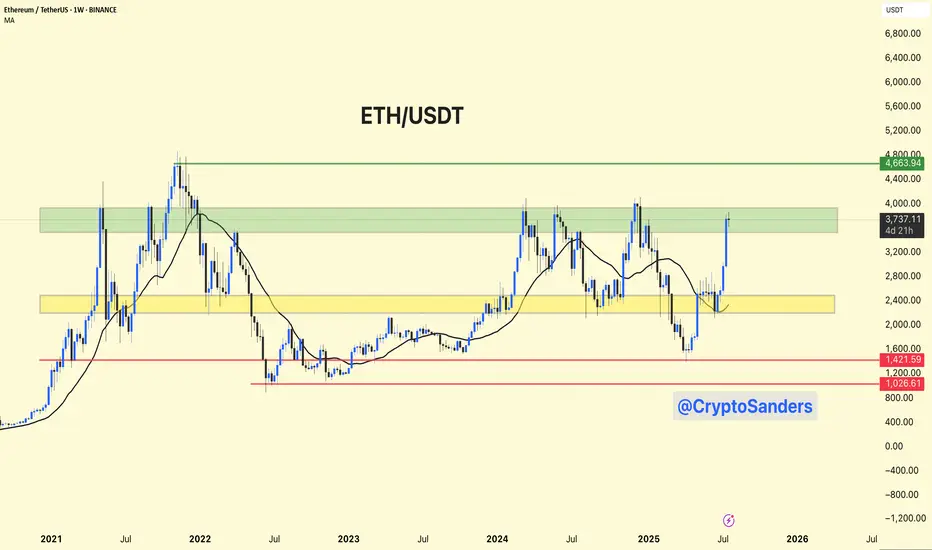
ETH/USDT – Weekly Chart Analysis !! ETH/USDT – Weekly Chart Analysis
ETH is testing a major historical resistance between $3,700 – $4,000 (highlighted green zone).
A clean breakout above this level could push price toward the next key resistance at ~$4,660.
Previous accumulation zone around $2,400 – $2,800 (yellow box) now acts as strong support.
Long-term floor at $1,420 and $1,025, though currently far below.
Bullish Breakout Potential: If ETH sustains above the green resistance, it may retest $4,660+.
A failure to break above $4K could lead to a healthy pullback toward the yellow zone (~$2,800).
Stay updated and manage your risk accordingly.
DYOR | NFA
Ethereum to $8000On the monthly chart, Ethereum has reached major resistance at $3,800 again and, in my opinion, can break through this time. This is the final leg to $8,000 soon.

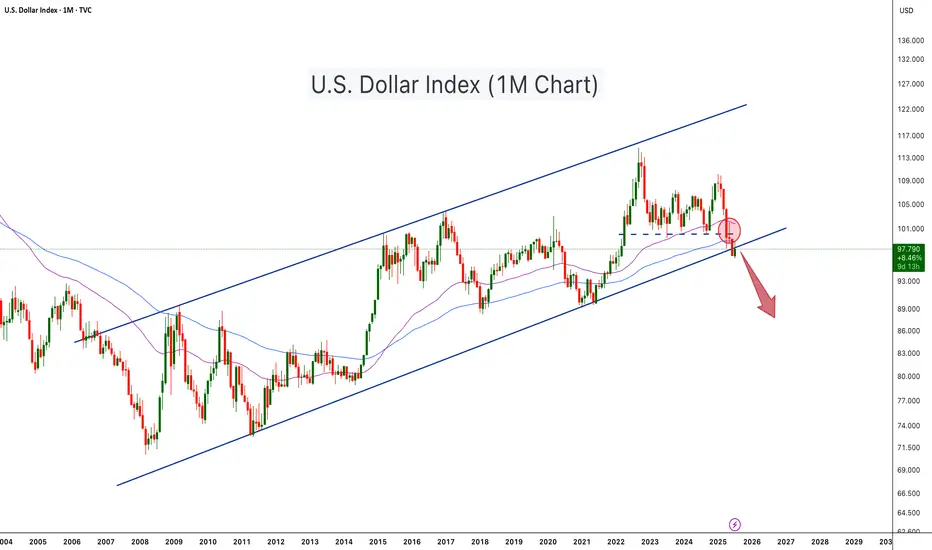
U.S. Dollar Index Loses Key Support – Crypto Bull Run Loading?The U.S. Dollar Index (DXY) has just broken below a long-term ascending channel, which has held since 2008. After losing the key horizontal support (~100 level), DXY retested and rejected from it (red circle), confirming a potential trend reversal. The move is technically significant and hints at further downside, possibly toward the 88–90 zone or lower.
This breakdown aligns with classic macro cycles, where a weaker dollar often fuels bullish momentum in risk assets, especially crypto. Historically:
-DXY downtrends in 2017 and 2020–2021 coincided with major Bitcoin and altcoin bull runs.
-DXY strength during 2018 and 2022 contributed to crypto bear markets.
With DXY now below both horizontal and diagonal support, Bitcoin and the broader crypto market may be entering the next expansion phase, especially if the dollar continues its downward trajectory
-DXY has broken below a 17 year rising channel – a macro bearish signal.
-Rejection from former support turned resistance confirms breakdown.
-A falling DXY historically corresponds with Bitcoin rallies and altseason expansions.
-Declining dollar strength could be the fuel that propels Bitcoin past $140K and Ethereum above $6K.
-A dollar bear trend may fuel total crypto market cap breakout beyond $4T+.
As DXY weakens, liquidity tends to rotate into risk-on assets like crypto. This setup mirrors pre-bull run environments seen in 2017 and 2020. A structural breakdown in the dollar could act as a catalyst for Bitcoin’s next major leg up.
Cheers
Hexa
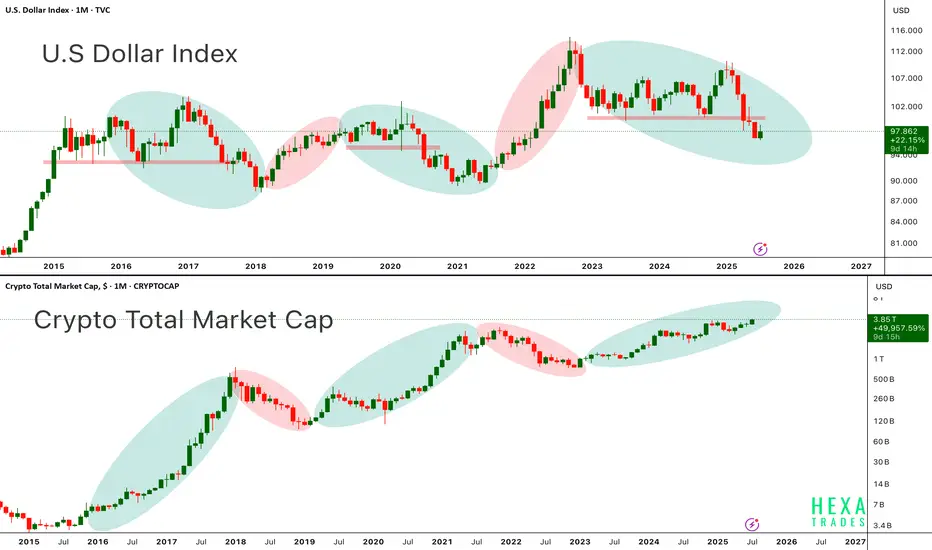
DXY vs. CryptoAbove chart highlights the long standing inverse correlation between the U.S. Dollar Index and the Crypto Total Market Cap a relationship that has guided the macro trend for Bitcoin and altcoins since 2015.
in the first chart, When the dollar weakens (green ovals), crypto tends to rally. When the dollar strengthens (red ovals), crypto markets usually experience corrections or prolonged bear markets.
In the second chart, each period of dollar weakness aligns almost perfectly with explosive crypto upside seen in 2017, 2020–2021, and now potentially again in late 2024 through 2025. Conversely, periods of DXY strength (2018, 2022) coincide with crypto market downturns.
Currently, DXY is entering a downward phase, while the crypto total market cap is pushing higher, now above $3.8 trillion suggesting that a new leg in the crypto bull cycle may be underway. Bitcoin and Ethereum have historically performed best when DXY trends lower, as liquidity shifts into risk-on assets.
Key Points:
-DXY and crypto market cap show a strong inverse macro relationship.
-DXY in a clear downtrend from 2024 highs supportive of further crypto upside.
-Crypto Total Market Cap approaching all-time highs suggesting broad market strength.
-Potential for BTC > $150K and ETH > $6K+ if this macro divergence continues.
-This setup resembles early 2020, right before the massive crypto bull run.
If the dollar continues to weaken structurally, crypto markets led by Bitcoin and Ethereum could see accelerated momentum, pushing into parabolic territory by late 2025.
Cheers
Hexa🧘♀️
ETH Ready to Pop!ETHUSD is once again testing the upper boundary of a long-term symmetrical triangle on the monthly chart. This pattern has been forming since the 2021 peak, showing consistently higher lows and lower highs. Previous breakouts from similar consolidation patterns (2017 and 2020) led to massive rallies. With the current monthly candle showing strong bullish momentum, a confirmed breakout above this structure could mark the beginning of Ethereum's next major bull run. Keep an eye on the breakout level for confirmation.
Cheers
Hexa

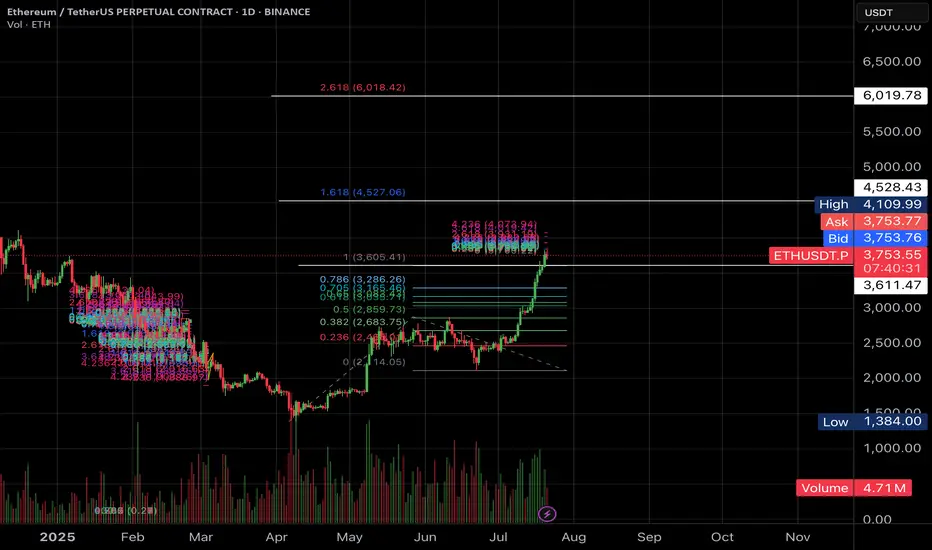
$6000 worth ETH?Hi Padawans,
ETH is showing strong bullish momentum, currently trading around $3,766. If it breaks above the resistance near $4,500–$4,900, the 2.618 Fibonacci extension points to a potential target around $6,000.
Best Regards,
CryptoObi
Bullish ETH Setup: $7,000, $10,000, and $13,000 TargetsHello✌
Let’s analyze Ethereum’s upcoming price potential 📈.
BINANCE:ETHUSDT , I expect a long-term upward bullish trend.
There are three main targets in this analysis: $7000, $10,000, and a final target of $13,000, which could be reached within 2 to 6 years.
The price may form parallel channels at times, which are clearly shown on the chart.
✨We put love into every post!
Your support inspires us 💛 Drop a comment we’d love to hear from you! Thanks , Mad Whale🐋
🐋Many of the points and levels shown on the chart are based on personal experience, feeling, and over 7 years of research and daily study of crypto charts.
Some of the lines, channels, and price zones are drawn to make the chart easier to understand and to help imagine possible future price movements.
I’ve also included one very big drop in price even bigger than the others because in the crypto market, it’s common for prices to suddenly fall hard and push out small investors and traders with positions.
The targets on the chart are not guaranteed; they might be reached, or they might not.📚
📜Please make sure to do your own research before investing, and review the disclaimer provided at the end of each post.

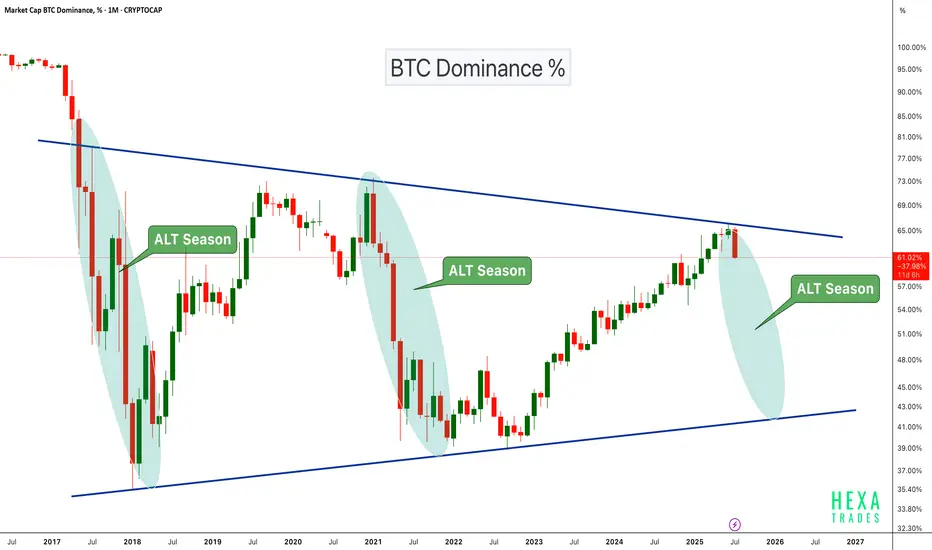
Altseason Loading?BTC Dominance chart has once again respected the long-term descending trendline resistance, showing a sharp monthly rejection. Historically, similar rejections have marked the beginning of ALT seasons, where capital flows out of Bitcoin into altcoins, boosting their performance significantly.
Chart Highlights:
-Major triangle pattern since 2017
-Clear rejections from the upper trendline coincide with previous ALT seasons (2018, 2021)
-Current rejection resembles those past cycles
-A move down in dominance could fuel strong altcoin rallies
If BTC dominance continues to decline, we could be entering another powerful altcoin season in the coming months.
Cheers
Hexa🧘♀️
CRYPTOCAP:BTC.D BINANCE:BTCUSDT
ETH Weekly Recap & Game Plan 20/07/2025📈 ETH Weekly Recap & Game Plan
🧠 Fundamentals & Sentiment
Market Context:
ETH continues its bullish momentum, driven by institutional demand and a supportive U.S. policy environment.
We captured strong profits by sticking to the plan (see chart below).
🔍 Technical Analysis
✅ Price has run into HTF liquidity at $3,750
📊 Daily RSI has entered the overbought zone, signaling potential short-term exhaustion.
We may see a brief retracement or LTF liquidity grabs, which could be enough to fuel a further push higher — potentially to $4,087.
🧭 Game Plan
I’m watching two key downside liquidity levels:
$3,534 (black line)
$3,464
A sweep of either could provide the liquidity needed for continuation toward $4,087.
⚠️ I’ll wait for LTF confirmation before entering a position.
📌 Follow for Weekly Recaps & Game Plans
If you find this analysis helpful, follow me for weekly ETH updates, smart money insights, and trade setups based on structure + liquidity.

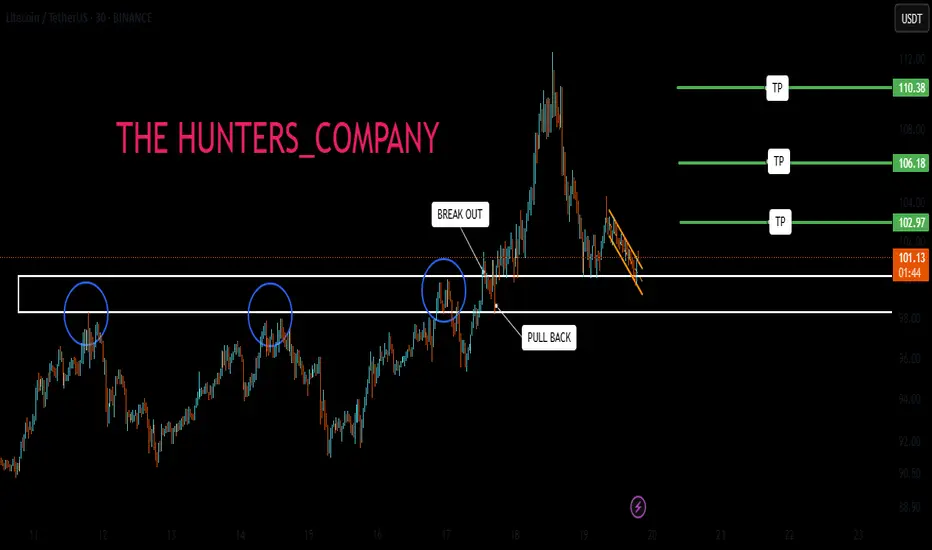
LITCOIN BUY OR SELL !!!Hello friends🙌
🔊According to the price drop, you can see that the price has been below the specified resistance for a while and when it was able to break the resistance, it shows us the power of the buyers. Now, when we return to the previous resistance, which has now become a support, you can see that the buyers are providing good support and the price is expected to move to the specified targets.
Note that the most important rule in trading is capital and risk management So make sure to follow it.
🔥Follow us for more signals🔥
*Trade safely with us*
ETH roadmap to 5000!Ethereum Wave 3 in Play? Eyes on the $4500 Target
Ethereum may currently be progressing through a wave 3, which is often the strongest leg of an impulse. The structure so far supports that idea, and based on standard projections, the most likely target sits near $4500.
If price can break and hold above the 4k level, we could see a consolidation forming above the previous high. That would be a constructive sign and might set up the next leg higher.
But there’s still a chance ETH struggles to clear that level. If that happens, consolidation could form just underneath, which would still be acceptable within a wave 3 framework. What matters next is the shape and depth of the pullback.
Wave 4 will be the key. A shallow or sideways correction would keep bullish momentum intact. A deeper pullback doesn't ruin the structure, but it does mean we’ll need to watch support zones more closely.
If wave 4 behaves well and broader market conditions stay supportive, then a final wave 5 could bring ETH into the $5000 region. That’s the upper edge of this current roadmap, based on conservative assumptions.
Stay flexible. Let the structure guide the bias.

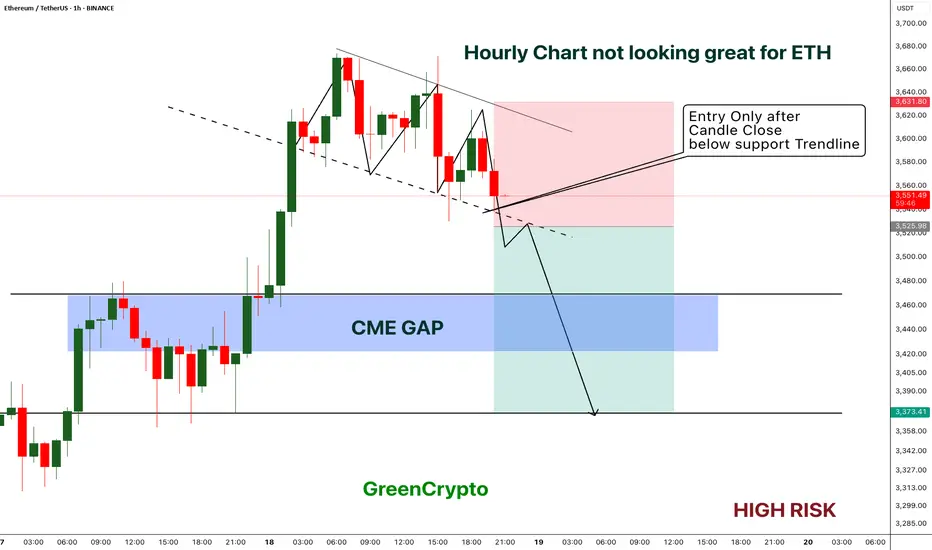
ETH - Short Trade with HIGH RISK- ETH got reject from resistance multiple times on 1H timeframe and now the price is playing near the support.
- I'm expecting overall market to cooldown this weekend, this could push the ETH to break the support
- ETH has CME gap around 3422 - 3467 range, im expecting this CME gap to be filled soon.
Entry Price: Below 3525
Stop Loss: 3631
TP1: 3471.15
TP2: 3381.76
Move SL to breakeven on TP1 hit.
Don't forget to keep stoploss.
Cheers
GreenCrypto
ETH Healthy Retest Before Next Rally!Ethereum continues to trade within a strong uptrend on the 1-hour chart, respecting the 100 EMA consistently throughout the rally. After a strong impulse move, the price is now consolidating near the recent highs.
ETH price could retest the 0.382 Fibonacci level and the 100 EMA before continuing upward. A successful retest would signal strength and could lead to a bullish continuation toward the $3900 - $4000 range.
Similar historical retests of the 100 EMA led to strong rallies, and we could see a repeat of that pattern if support holds.
Cheers
Hexa
BITSTAMP:ETHUSD CRYPTOCAP:ETH
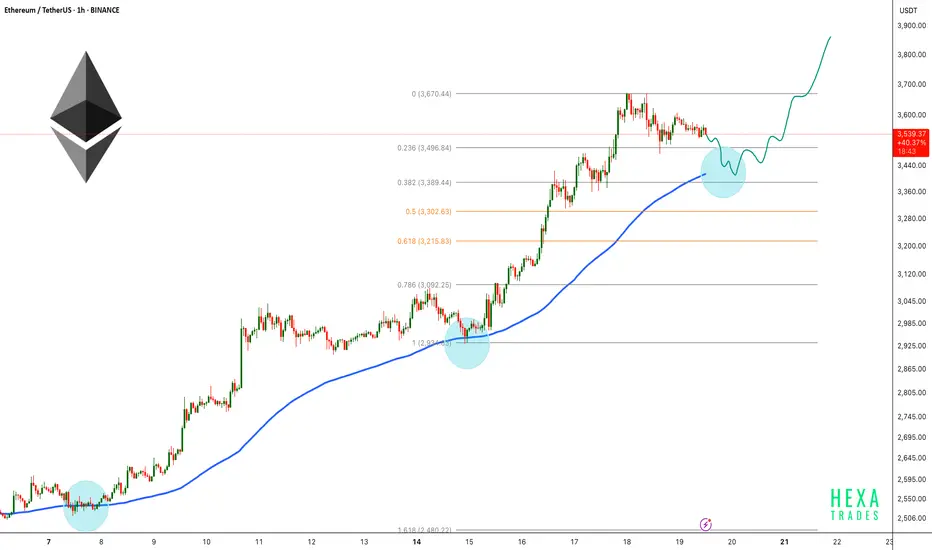
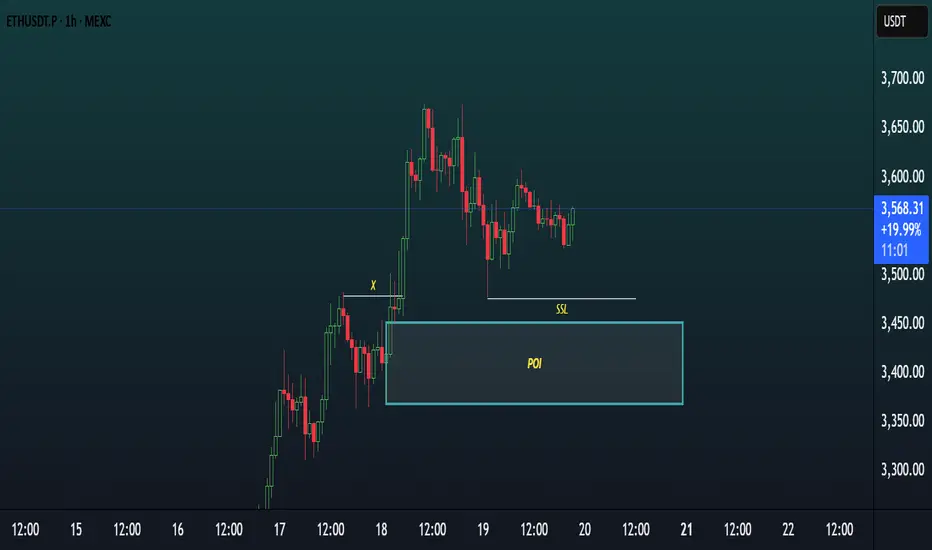
Chart Analysis (ETHUSDT, 1H)This chart showcases a Smart Money Concepts (SMC) style analysis on the 1-hour timeframe of ETHUSDT.P, focusing on a potential bullish setup.
Key Elements:
POI (Point of Interest)
A demand zone is clearly marked around the $3,400–$3,460 area, highlighted as a potential reversal zone where price may react bullishly.
SSL (Sell-Side Liquidity)
Sell-side liquidity has been swept below a recent low, indicating a possible liquidity grab before a reversal.
X (Previous Break of Structure)
Point “X” marks a significant BOS (Break of Structure) indicating bullish intent in prior price action.
Current Price Action
Price recently tapped into the POI, swept SSL, and is now consolidating slightly above the zone — suggesting accumulation or preparation for a bullish move.
Bias:
Bullish — Expecting a possible reversal or continuation to the upside after liquidity sweep and POI mitigation.
ATH FOR Ethereum!!!Hello friends🙌
As you know, Ethereum has been on an upward trend these days and we can say that buyers have entered, but not completely...👀
🔊Now, considering the resistance that Ethereum is facing, namely the number 3900 to 4100, we need to see what reaction the price will see this time when the price reaches this resistance for the 4th time?
✔We will most likely make a small correction and this time this major resistance will be broken again and we will witness a higher ceiling.
✔Otherwise, I have an important and key support that we have identified for you and if the price drops, this support is a good area to buy again.
And finally, observe risk and capital management⚠
🔥Follow us for more signals🔥
*Trade safely with us*

LINK START...Hello friends🙌
📈As you can see, the upward trend has started, and the power is in the hands of buyers, and here we have an opportunity to enter a buy trade with risk and capital management to move with the specified goals.
🔥Follow us for more signals🔥
*Trade safely with us*
