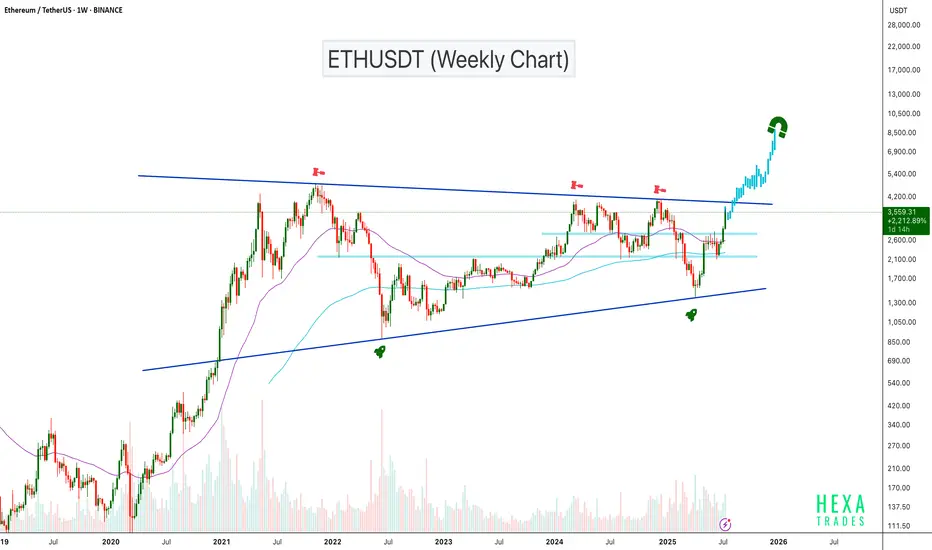
ETHUSDT Gearing Up for Explosive MoveBINANCE:ETHUSDT has been trading inside an ascending triangle pattern for the past 1,600 days. The price is now moving toward the triangle's resistance zone with strong volume support. A confirmed breakout above this resistance could trigger a powerful bullish move, with potential targets in the $6,000–$8,000 range.
Cheers
Hexa🧘♀️
BITSTAMP:ETHUSD
ETHUSDT
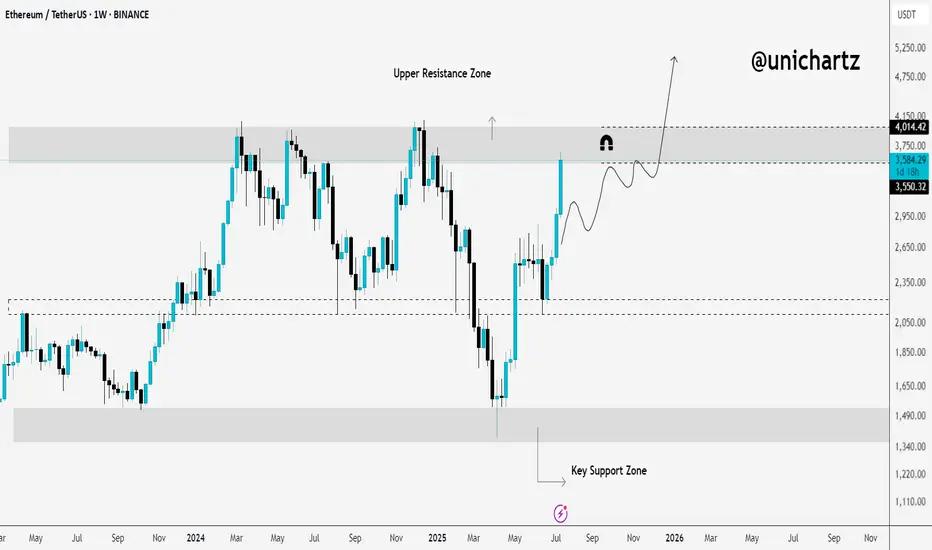
Altseason Starts Here? ETH Hits Critical Resistance!Ethereum has finally reached the upper resistance zone — and this could be the decisive moment for Altseason.
This level has historically acted as a major turning point for ETH. If it breaks and holds above this zone, we could see capital start flowing aggressively into altcoins.
🧠 Why it matters:
ETH reaching resistance usually signals a rotation phase from BTC to ETH.
If ETH breaks above, altcoins tend to follow with explosive momentum.
If it gets rejected, we may see a short-term cool-off.
This is the zone where narratives shift. Eyes on the breakout — or the rejection.
You need smol Scalps for ETH!ETH SMOL scalps but u know it takes your liquidity on top blowing ur accounf! Keep mindful where the trade goes! good short oppurtunity!

Ethereum · No Reason To Stop · Will Continue RisingEthereum will continue rising. Remember Ether is number two and it is awesome, to start, and it follows Bitcoin like darkness follows the light. There is no reason for Ether to move down. There is no necessity for ETH to stop its major advance, in fact, it has been lagging behind and it needs to catch up. Bitcoin is waiting and will continue waiting but it won't wait forever so Ethereum must wake up and is waking up. We are going up.
Ethereum has grown 165% since its 7-April low. This is more than XRP and its capital is twice as much. Boom! The best part? Ethereum will continue growing straight up for weeks and months. It needs to be trading at a new all-time high as soon as possible just so that the market can feel at ease and know, once again, that Crypto is here to stay.
What has been suppressed can't stay suppressed forever. Crypto went through a fight but challenges only made us that much stronger. We are now happy and grateful for everything that we went through because we know that we can take anything the world throws at us.
The chart. Green, green, green straight up. Two months of consolidation. That's the key. ETHUSDT went sideways for almost two months and this reveals what comes next. The advance outside the consolidation range has been happening for 8 days. 60 days of sideways can support at least an entire month of growth. When the entire month is consumed, we can expect a retrace, nothing more, followed by additional growth.
In short, Ethereum will continue rising. If you see a shakeout, know that growth will always resume in a matter of days. If you see a drop, know that this is a bear-trap, the bulls now own the game. If you are in doubt, come read my articles and I will publish something that you will understand and agree is right, so you can continue holding until you can reach the big prize.
The time to sell will come, but it isn't now. Right now is the time to hold strong. Not only Ethereum, but Cardano, XRP, BTC, Dogecoin, Solana and the rest of the altcoins. This is only the start.
I expect Ether will continue rising. $8,000 now looks like such an easy target...
Very good indeed. If you enjoy the content, follow me.
Namaste.

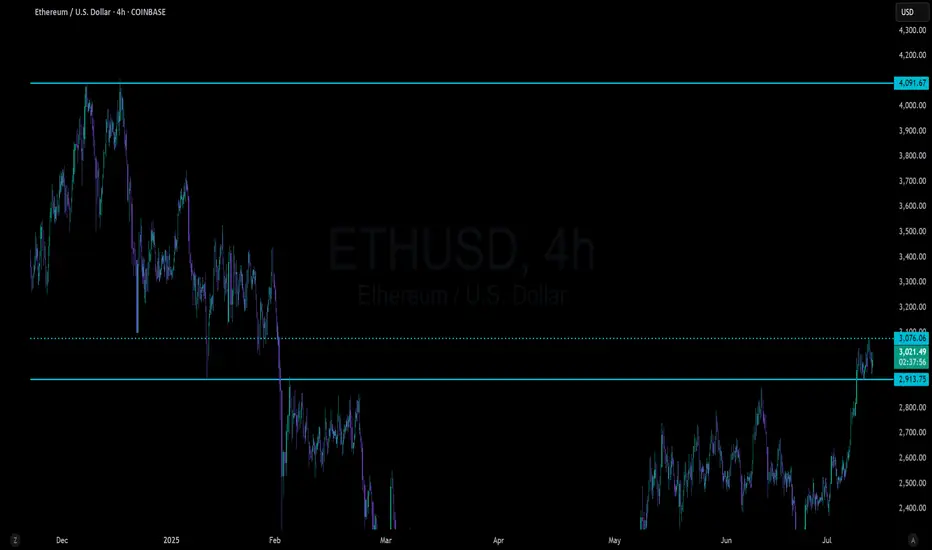
ETH/USDT 4H Chart✅ Market Trend and Structure:
Uptrend: The highlighted orange trend line shows continuous growth since mid-April. The price is trading above the 50- and 200-period moving averages (EMA and SMA), confirming bullish sentiment.
Current price: around 3556 USDT – very close to local highs.
Resistance break in the 3200–3300 USDT area, which now acts as support.
📈 Technical Levels:
Resistance (red horizontal lines):
3600–3650 USDT – local resistance resulting from market reaction.
3888 USDT – next historical resistance level.
4133 USDT – established long-term target (green dashed line at the top).
Support:
3300 USDT – strong support after a previous breakout.
3080 USDT – previous high, now the next support level.
3070 / 2900 USDT – key technical support levels in the event of a larger correction.
📊 Indicators:
MACD:
The MACD is in a strongly bullish zone, but:
The histogram is flattening.
A bearish crossover pattern is possible in the following candles – a signal of weakening momentum.
RSI:
RSI ~74 – is in the overbought zone, which often heralds a correction or at least consolidation.
A value above 70 confirms the bullish trend but may suggest that momentum is overheated.
📌 Conclusions and Scenarios:
🔼 Upside Scenario (trend continuation):
If the price remains above 3300–3350 USDT, it could move towards 3888, and then 4133 USDT.
A break above 3650 USDT on heavy volume will be a strong continuation signal.
🔽 Corrective scenario (short-term pullback):
The RSI and MACD suggest a possible correction.
Potential pullback to:
3300 USDT (retest of previous resistance as support).
SMA 200 (~2600 USDT) with a deeper downward move.

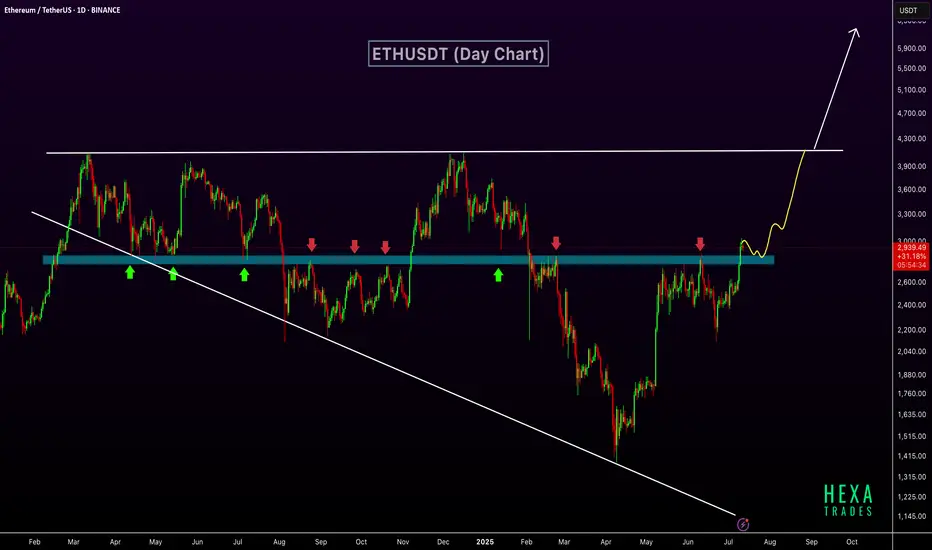
ETH Breaks Key Resistance – $6K Possible if Wedge BreaksETHUSDT has broken out above a key horizontal resistance zone that has historically acted as a strong support and resistance level. This zone, marked in blue, has seen multiple rejections and bounces over the past year, confirming its significance.
The recent breakout above this zone indicates a shift in market structure and suggests growing bullish momentum. The price action shows a clean move above resistance, with potential for a retest before continuing higher. The market is also forming a long-term broadening wedge pattern. The next target lies near the upper resistance of the wedge, around $4,000. If the price breaks above this broadening wedge, it could open the path toward the $6,000 level.
Regards
Hexa
ETH ~ It Gives you a chance ~ $4000 soon!ETH will soon go to $4000 bidding Lower TF for actual buys and shorts to stay till there, will post the buy moves soon!
ETHUSD - ANOTHER GROWING WEEK
ETHUSD - ANOTHER GROWING WEEK✅
ETHUSD has been growing all these days together with a bitcoin. All the news, listed in my previous post for the BTCUSD are also valuable here. Really nice fundamental support, people are purchasing the asset.
But what's with technicals? 📊
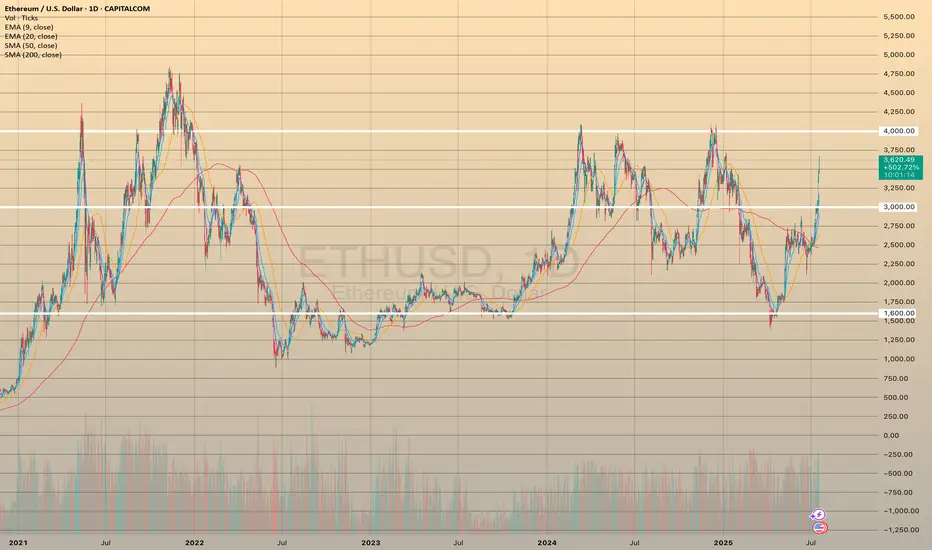
Compared to the bitcoin, ETHUSD hasn't reached ATH. According to a daily chart (pic 1), the price has been moving sideways since 2021 and a strong resistance is waiting ahead at 4,000.00. However, for now we are good. I bet that during upcoming days the asset will reach this level and rebound from it. Will it break the resistance? I think it is too early to make any conclusions.
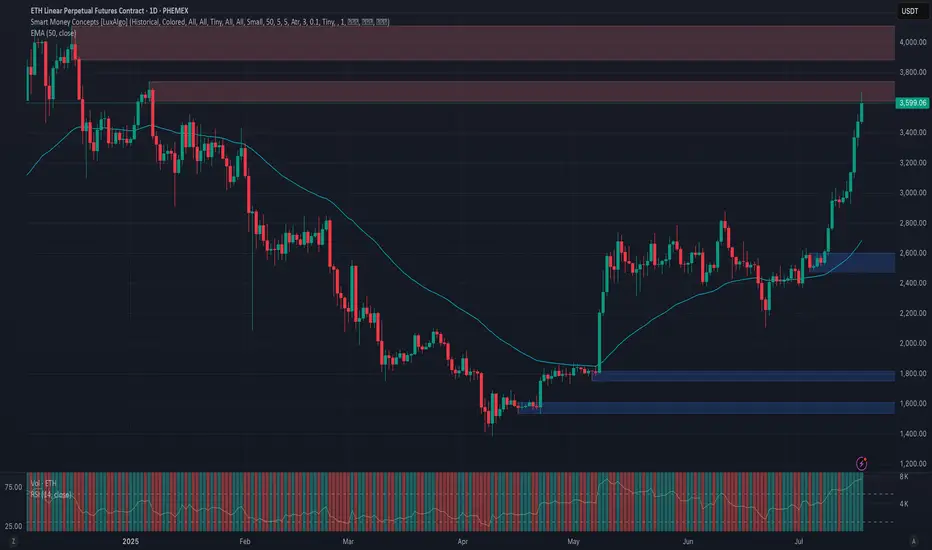
Phemex Analysis #98: ETH Price Explodes— Is $5,000 Finally Next?Ethereum ( PHEMEX:ETHUSDT.P ) has recently shown impressive strength, surging past significant resistance levels and stirring excitement in the crypto market. After an extended consolidation, ETH decisively broke through the crucial $3,300 resistance level, rallying more than 15% in just three days, and is now trading confidently around $3,500.
This renewed bullish momentum has traders and investors eagerly speculating: Could this be the start of Ethereum's next major run? Or should caution prevail amid ongoing market uncertainty? To help navigate this critical period, let's explore several key trading scenarios.
Possible Scenarios
1. Bullish Continuation – Targeting New Highs
Ethereum’s recent breakout above the $3,300 resistance signals strong bullish sentiment. If buying volume continues increasing, ETH could swiftly move towards higher resistance levels at $3,800 and potentially challenge the psychological milestone of $4,100.
Pro Tips:
Profit Targets: Consider locking in partial profits as ETH approaches strong resistance zones around $3,800 and $4,100.
Risk Management: Place tight stop-loss orders on recent lows, approximately around $2,902 to minimize downside risks.
2. Short-term Retracement – Healthy Pullback
Given ETH’s rapid surge, a short-term pullback to retest the recently broken resistance zone at $3,300 to $3,000 (now acting as strong support zone) is plausible. A successful retest would strengthen the bullish case, signaling healthy consolidation before further upward momentum.
Pro Tips:
Buying the Dip: If ETH holds above $3,000 with declining volume, consider cautiously adding to your positions or initiating new longs.
Volume Confirmation: Closely watch trading volume; lower volume during pullbacks typically indicates a healthy retracement rather than a bearish reversal.
3. Bearish Reversal – Breaking Below Critical Support
If Ethereum’s price experiences heavy selling pressure and breaks below the key support at $3,000, bearish sentiment could escalate, potentially driving ETH towards lower support levels near $2,470 and possibly even $2,110.
Pro Tips:
Short Positions: Experienced traders might consider initiating short positions if ETH decisively breaks below the crucial $3,000 support zone on increasing selling volume.
Long-term Accumulation: Long-term investors may strategically accumulate ETH near stronger support areas at $2,470 and $2,110, after clear signs of price stabilization.
Conclusion
Ethereum (ETH) currently offers attractive opportunities, propelled by recent bullish momentum yet balanced by market uncertainties. Traders must closely observe key resistance at $4,000, critical support around $3,000, and carefully analyze trading volumes for confirmation of market direction. By maintaining disciplined risk management and strategically capitalizing on outlined scenarios, investors can effectively navigate ETH’s price action in the weeks ahead.
🔥 Tips:
Armed Your Trading Arsenal with advanced tools like multiple watchlists, basket orders, and real-time strategy adjustments at Phemex. Our USDT-based scaled orders give you precise control over your risk, while iceberg orders provide stealthy execution.
Disclaimer: This is NOT financial or investment advice. Please conduct your own research (DYOR). Phemex is not responsible, directly or indirectly, for any damage or loss incurred or claimed to be caused by or in association with the use of or reliance on any content, goods, or services mentioned in this article.
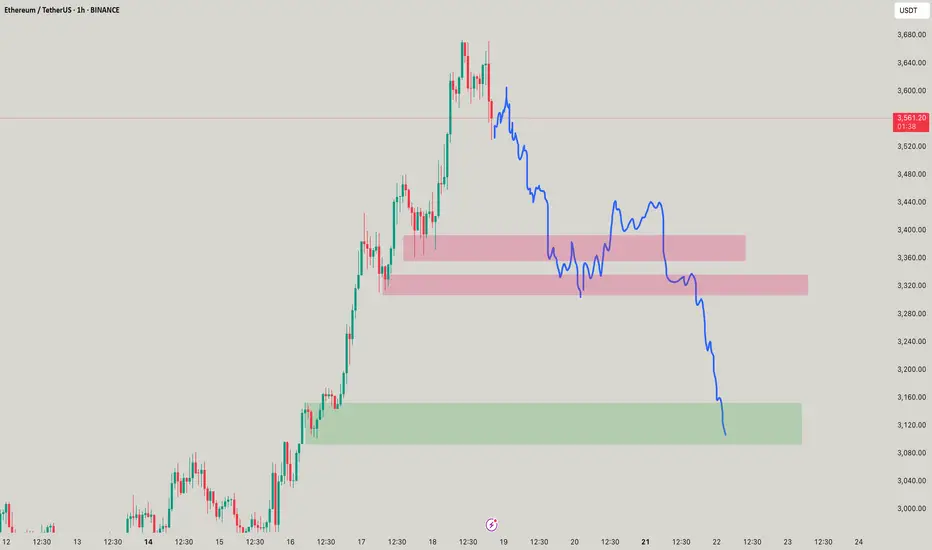
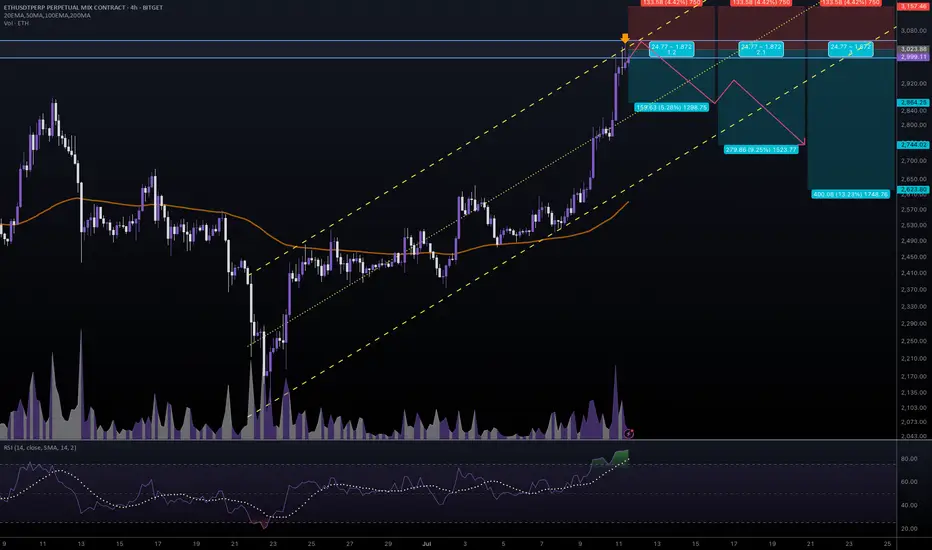
#ETHUSDT #4h (Bitget Futures) Ascending channel on resistanceEthereum printed a gravestone doji followed by a shooting star, RSI is overbought, local top seems in.
⚡️⚡️ #ETH/USDT ⚡️⚡️
Exchanges: Bitget Futures
Signal Type: Regular (Short)
Leverage: Isolated (9.0X)
Amount: 5.0%
Entry Zone:
2996.99 - 3050.49
Take-Profit Targets:
1) 2864.25
2) 2744.02
3) 2623.80
Stop Targets:
1) 3157.46
Published By: @Zblaba
CRYPTOCAP:ETH BITGET:ETHUSDT.P #4h #Ethereum #PoS ethereum.org
Risk/Reward= 1:1.2 | 1:2.1 | 1:3.0
Expected Profit= +47.5% | +83.3% | +119.0%
Possible Loss= -39.8%
Estimated Gaintime= 1-2 weeks
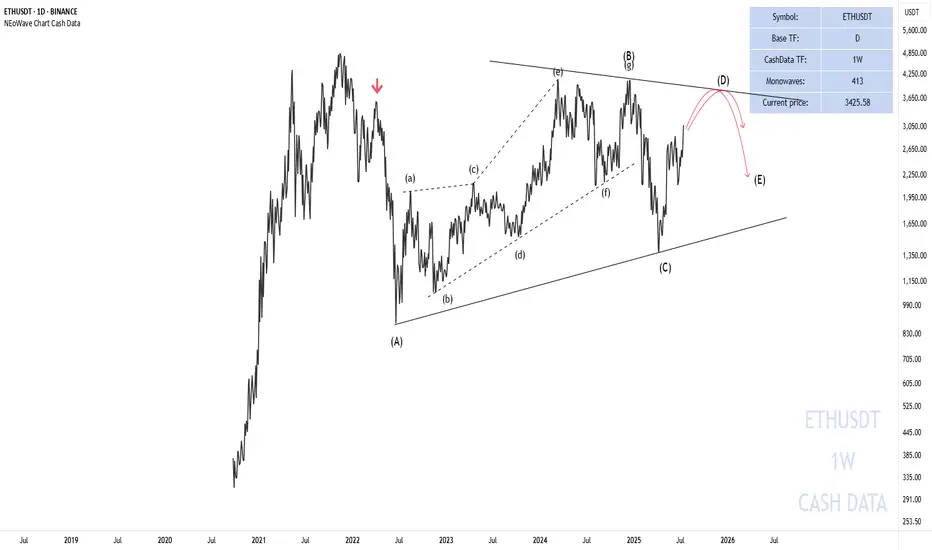
NEoWave Analysis of Ethereum 2025 Cash data chart shows that Ethereum is in a corrective phase and the wave structure from (A) to (C) has been completed. Initially, we expected a flat pattern to form; however, the wave structure-(C) was not an impulse and the flat was not confirmed.
As a result, given that the wave structure (A)-(B)-(C) is corrective and the waves differ in time, it seems that a contracting triangle pattern is forming and we are currently in wave-(D) of this triangle. Furthermore, wave-(D) could rise to $3630-3880 and end. Then a price correction in the form of wave-(E) may occur. This correction could end between $2900-3086 and if this range is broken downwards, wave-(E) could decline to $2000-2230, after which the main bullish move for Ethereum is expected to begin.
Good luck
NEoWaveChart
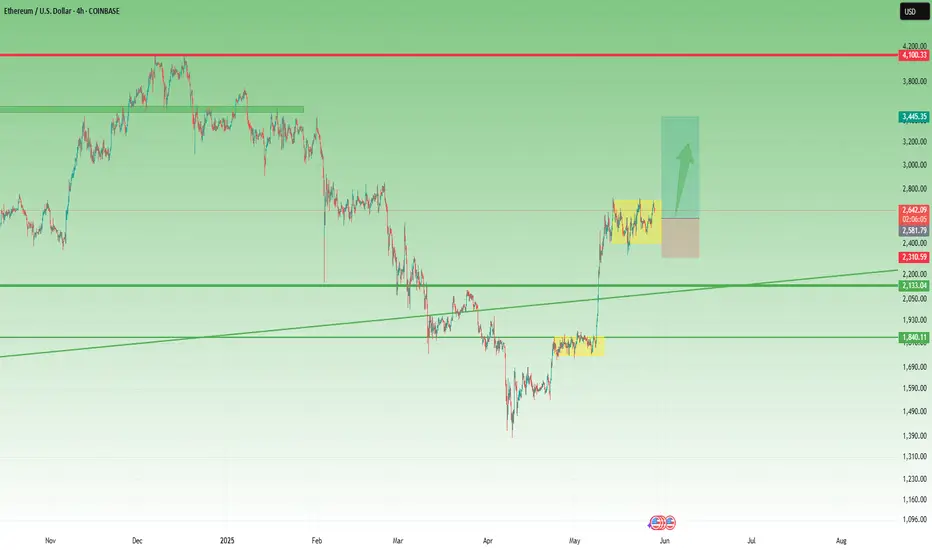
Ethereum – Calm Before the Next Leg Up?Ethereum had a disappointing start in 2025.
After pushing above $4,000 in mid-December 2024 — with headlines full of "$10K ETH coming!" — the new year began around $3,500, and what followed was a slow bleed.
By early April, Ethereum printed a shocking low at $1,380 — a level few believed was even possible.
But the bounce from there? ⚡
It was explosive — nearly +100% in just one month, with price topping around $2,700.
Since then, we’ve been consolidating — and that’s completely normal after such a vertical move.
🔍 So, what’s next?
Technically, ETH is forming a rectangle, a structure that often resolves as a continuation pattern.
The spike down to the $2,300 zone on May 19th was telling — buyers stepped in aggressively and pushed price back above $2,500, which now acts as a comfort zone for bulls.
📌 Conclusion
I’m looking to buy dips, ideally near $2,550, and my target is the $3,500 zone.
No need to reconsider the bullish outlook as long as price holds above $2,300.
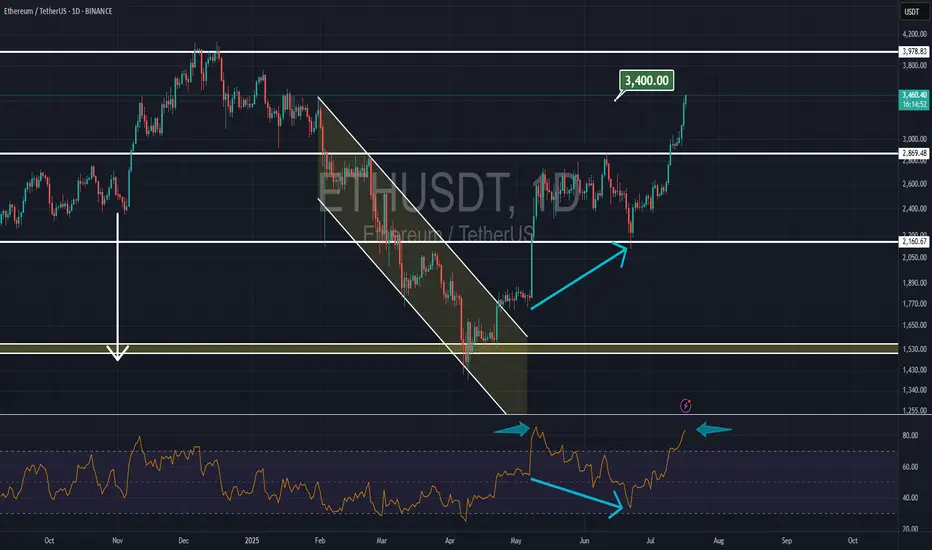
Ethereum reached to our target
Ethereum reached to $3400 that we talked about since weeks ago, but now the daily RSI is at overbought area and we might see a correction.
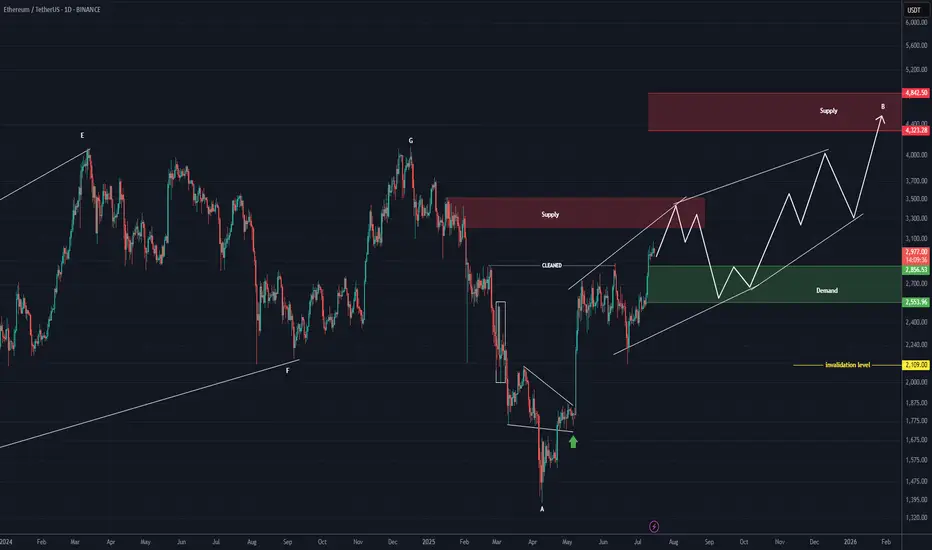
ETHEREUM Roara Map (1D)The previous phase of Ethereum appears to have been a completed diametric, and now it seems we are in a flat pattern.
It can be said that we are currently in wave B of the flat, which itself appears to be a diametric.
This diametric could even extend to the 4300–4800 range.
The green zone is the rebuy area.
A daily candle close below the invalidation level would invalidate this analysis.
For risk management, please don't forget stop loss and capital management
Comment if you have any questions
Thank You

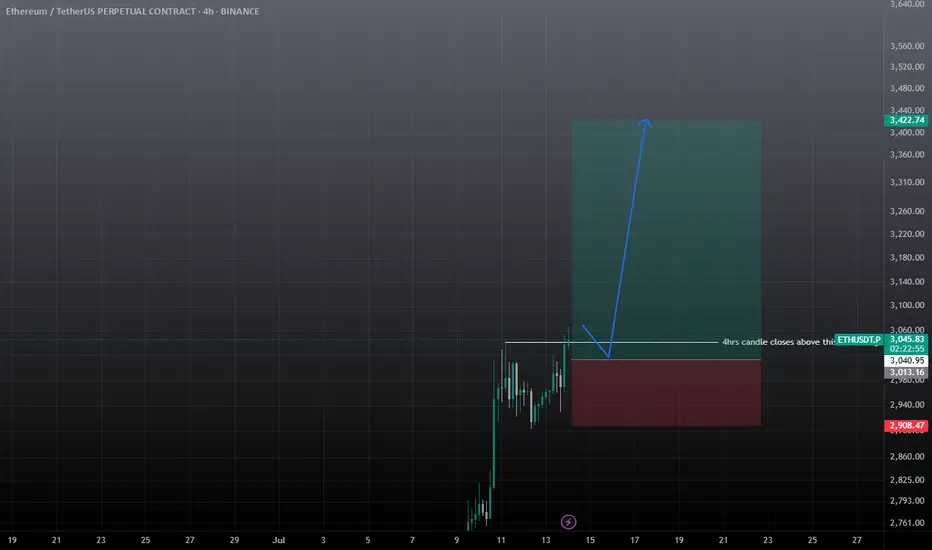
ETHUSDT BUY / Long SetupThis 4hrs candle closes above the mentioned level, then took long from 50% fib level of the fvg, and put sl below the recent swing low, I will update the trade whether it's active or not? tp towards 3.3-3.4k , while btc.d getting recked so becareful shorting any altcoin.
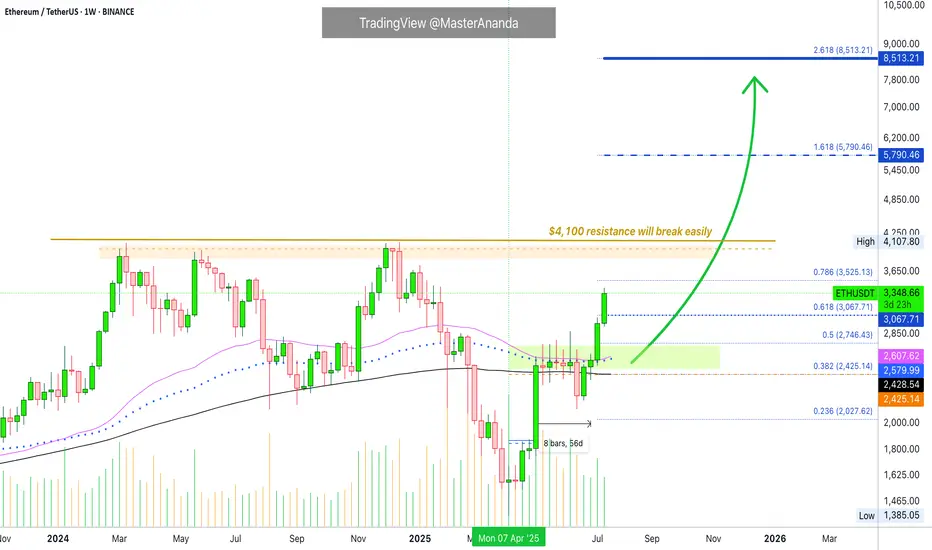
Ethereum · Going beyond $5,790 · $8,513 Next TargetThe eight weeks of consolidation, 56 days, happened as compressed (sandwich style) action right in-between MA200 and EMA55/89.
The EMA55/89 duo worked as resistance while MA200 worked as support.
Before a major move the market always tends to produce a form of shakeout. Sometimes it is call a bear-trap, a shakeout, a liquidity-hunt or stop-loss hunt event, a failed signal, etc.
Here Ether (ETHUSDT) closed below MA200 one week just to recover the next. In this case, we will call it a failed breakdown but we know this is a way to liquidate over leveraged long-traders, also a way to catch unsuspecting bears ready to short. The conclusion is simple, Ether recovered the next week above MA200 and the following week above EMA55/89 which worked as resistance for six weeks. With these levels behind us, the market is full green.
Notice the last two candles, big huge green candle. That is because resistance is no more.
With no resistance to stop prices from rising, Ethereum started to grow and we are now in full blown bullish mode.
The last major high sits at $4,107. This is an easy target, the minimum. Once support is tested the action moves toward resistance and this is where we are headed.
Some people will wonder if resistance will break or hold. Some unsuspecting bears, again, will even short at resistance thinking this is the logical move, they will lose all.
The truth is that this resistance and major high will break easily, we know this based on marketwide action and Bitcoin, Bitcoin is hitting new all-time highs every other day. In this way, we know that Ethereum will soon catch up and do the same.
Many altcoins are moving forward and growing, and some already conquered their December 2024 high price. This is another indication that shows Ether will not stay behind.
Whatever you do when Ethereum goes up, do not short. You can short if you are going to close the short after just a few hours or a few days, but instead of shorting a bullish trend, go LONG and enjoy maximum profits on the way up.
» Ethereum will break $6,000 and move toward $8,500 and beyond in the long-run.
You read it here first.
Thanks a lot for your continued support.
Resistance will break and the altcoins market will continue to grow. Not only for a few months but for a very long time.
When correction time comes, it will last a few months, we will get higher lows and then additional growth. Think of the pattern that came up on Bitcoin but with the altcoins; long-term growth.
Namaste.
ETH — Trade Closed! Massive Profit SecuredI’m officially closing my Ethereum position — this trade is now a success story!
I posted right here that ETH was a buy at $2400, then doubled down at $1800. I even echoed the call on Reddit for good measure.
Today, I’m liquidating the entire position with a huge gain. No regrets, just clean execution. 🧠💸
To all the mad lads still holding — good luck and may your conviction be rewarded.
See you next year for the next big swing.
Take your profits, you lunatics! 😄🔥

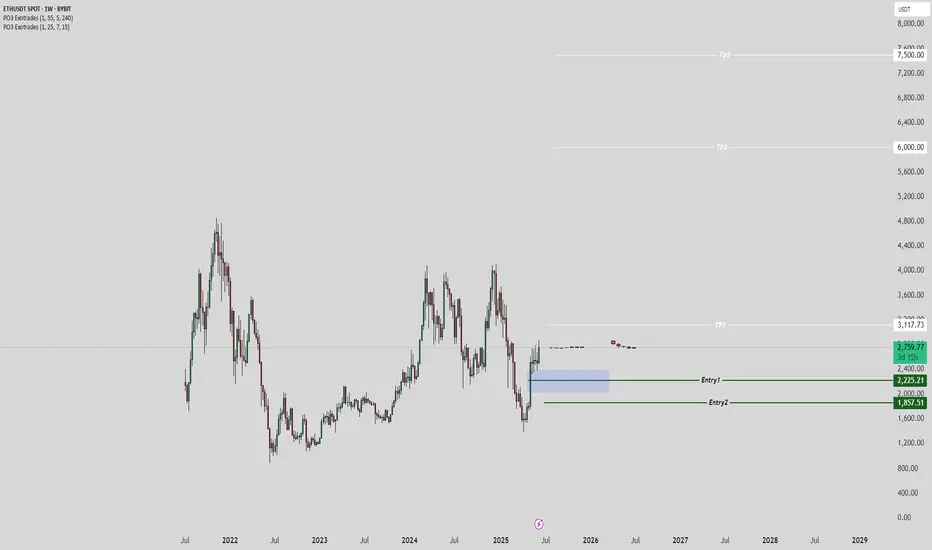
Ethereum's Road to $7500 – Strategic Entries & Profit Optimizati🔵 Entry Zone: My first position is placed at $2225.5, aligning with a strong support level, while a secondary entry at $1857.5 serves as an additional safeguard against unexpected market swings—lowering my average purchase price and protecting capital.
💰 Profit-Taking Strategy: For low-risk traders, securing a 40% profit from the first entry is a prudent move to lock in gains early. However, my long-term target remains ambitious.
🚀 Main Target: Based on valuation models and fundamental news, Ethereum’s upside potential points toward $7500. However, I personally plan to secure 90% of my holdings at $6000, ensuring strong profit realization while leaving room for further upside.
This setup balances risk management, smart positioning, and strategic profit optimization. Let’s see how ETH’s trajectory unfolds!
Entry1: 2225.5
Entry 2: 1857.5
If your second entry is successful, you are required to withdraw 50 to 70 percent of your capital to maintain your capital. I will definitely update this setup.
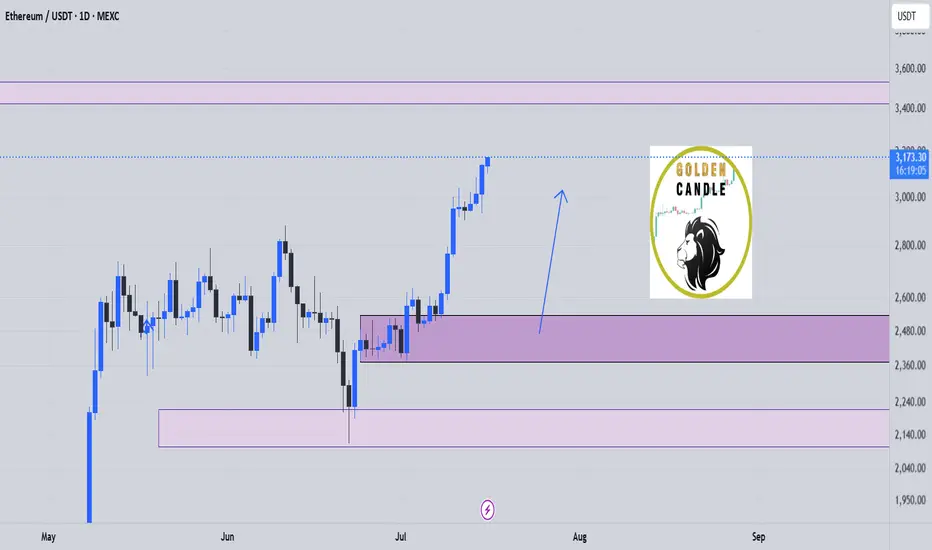
eth buy longterm"🌟 Welcome to Golden Candle! 🌟
We're a team of 📈 passionate traders 📉 who love sharing our 🔍 technical analysis insights 🔎 with the TradingView community. 🌎
Our goal is to provide 💡 valuable perspectives 💡 on market trends and patterns, but 🚫 please note that our analyses are not intended as buy or sell recommendations. 🚫
Instead, they reflect our own 💭 personal attitudes and thoughts. 💭
Follow along and 📚 learn 📚 from our analyses! 📊💡"
ETH/USDTETH is showing a similar structure to BTC, with a visible gap in play. A partial or full fill of the gap, followed by a bullish structure break on lower timeframes, would be a strong signal of buyer strength.
Waiting for confirmation before acting.

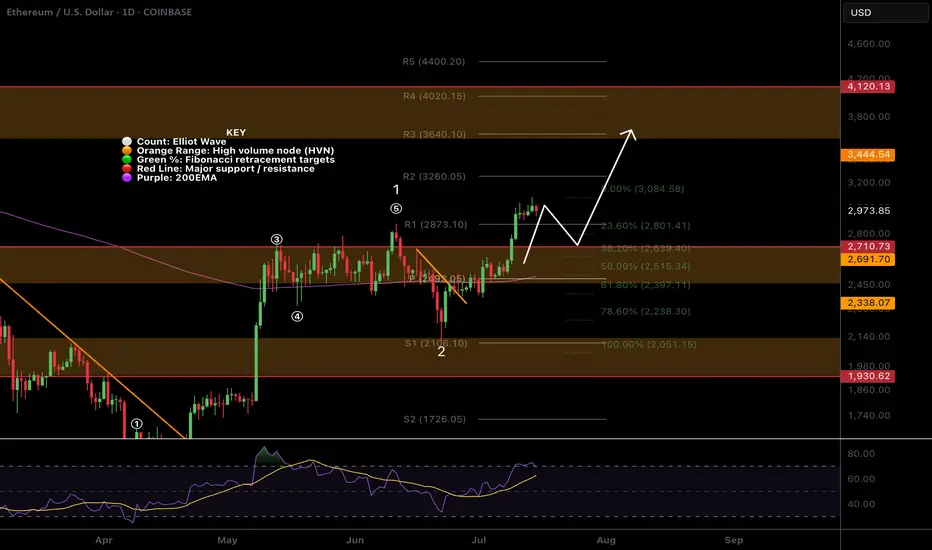
$ETH Pullback to $2630 Support?CRYPTOCAP:ETH has a great week pushing through resistance and making new local highs after testing the daily 200EMA and daily pivot as support.
Price is likely to retest the swing high and previous resistance as support around $2600-2700, also the .382 Fibonacci retracement.
RSI is printing daily bearish divergence in overbought from the wave (3) top to current as it did at the wave (5) top seeing large rejection. The retest of $2600 would reset RSI.
Price is ultimately set to test $3600 as the next resistance if the Elliot wave count is correct.
Analysis is invalidated below $2050
Safe trading