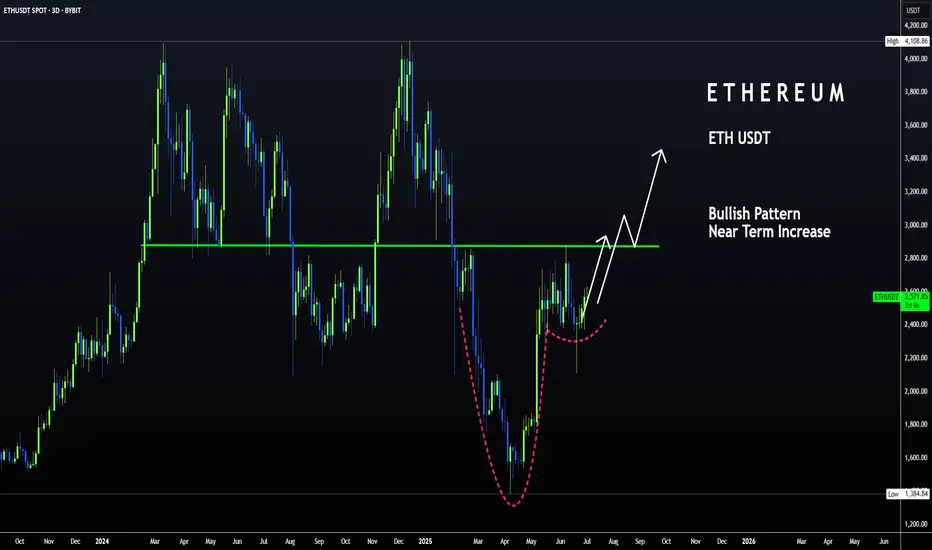
ETH | Bullish Pattern - Cup and Handle +15%A Bullish pattern is appearing on the Ethereum chart.
From a Cup and Handle pattern, we can easily expect atleast a 15% increase. This is true for the near term. A +15% would put us here:
Just under $3K we may see heavy resistance. This is also the neckline resistance, as it was the previous support for the breakout that ultimately led to a new ETH ATH.
_______________________________
BYBIT:ETHUSDT
ETHUSDT
ETH Gearing Up for Lift-Off — Eyes on $4,000+ETH Weekly Outlook
ETH is currently trading around $2,660 on the weekly timeframe and holding up well at these levels.
If the momentum continues, the upper resistance zone near $3,550 could act like a magnet — pulling price higher. A breakout above this zone may trigger a strong rally toward $4,000+.
And when ETH starts to move big… altcoins usually follow.
Keep an eye on it. The next few weeks could get interesting.
DYOR, NFA

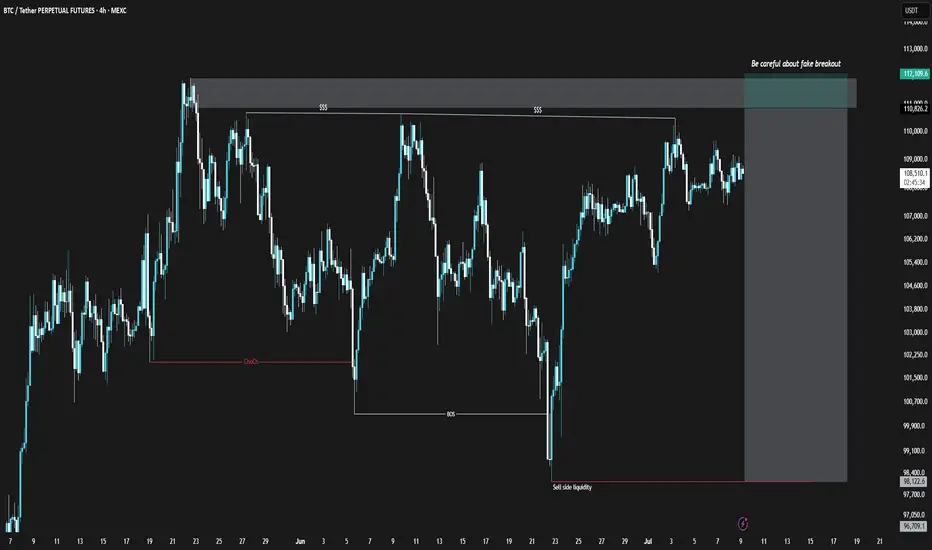
BTCUSDT Short Position (25/Jul/9)Bitcoin, similar to the TOTAL chart, is showing weakness in its bullish momentum. However, unlike TOTAL, the divergence in Bitcoin is clearly noticeable. Additionally, within the marked zone on the Bitcoin chart, there is a possibility of a fake breakout and liquidity grab. I suggest entering only with proper confirmation.
⚠️ This Analysis will be updated ...
👤 Sadegh Ahmadi: GPTradersHub
📅 2025.Jul.9
⚠️(DYOR)
❤️ If you apperciate my work , Please like and comment , It Keeps me motivated to do better
TOTAL SELL SIGNAL 25/Jul/9The TOTAL chart has shown a structural change in the 4-hour timeframe, indicating weakness in the bullish trend. Don't rush into buying and avoid falling into FOMO.
⚠️ This Analysis will be updated ...
👤 Sadegh Ahmadi: GPTradersHub
📅 2025.Jul.9
⚠️(DYOR)
❤️ If you apperciate my work , Please like and comment , It Keeps me motivated to do better

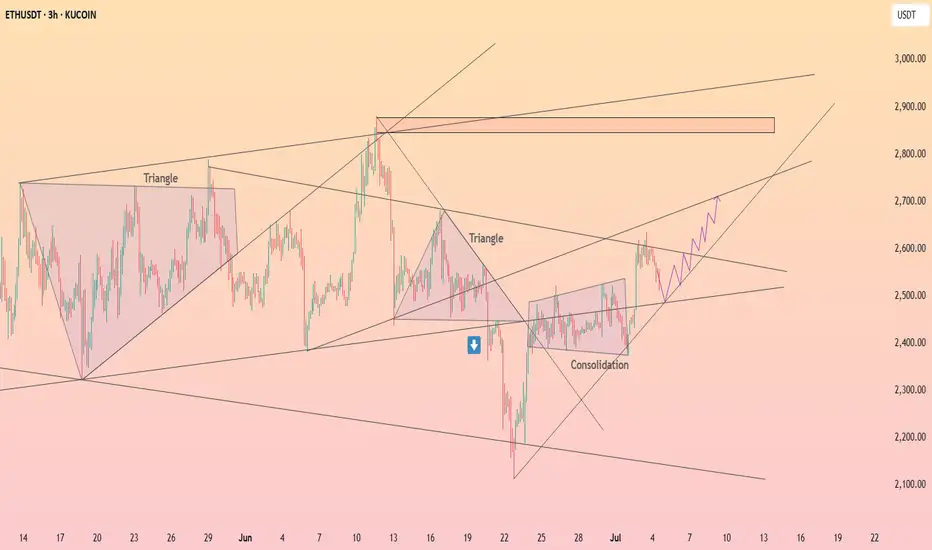
ETHEREUM ROADMAPI tried to predict based on previous time periods and elliot waves.
Please note that my analysis is not short-term. Of course, there may be short-term correction waves in Ethereum.
* The purpose of my graphic drawings is purely educational.
* What i write here is not an investment advice. Please do your own research before investing in any asset.
* Never take my personal opinions as investment advice, you may lose your money.
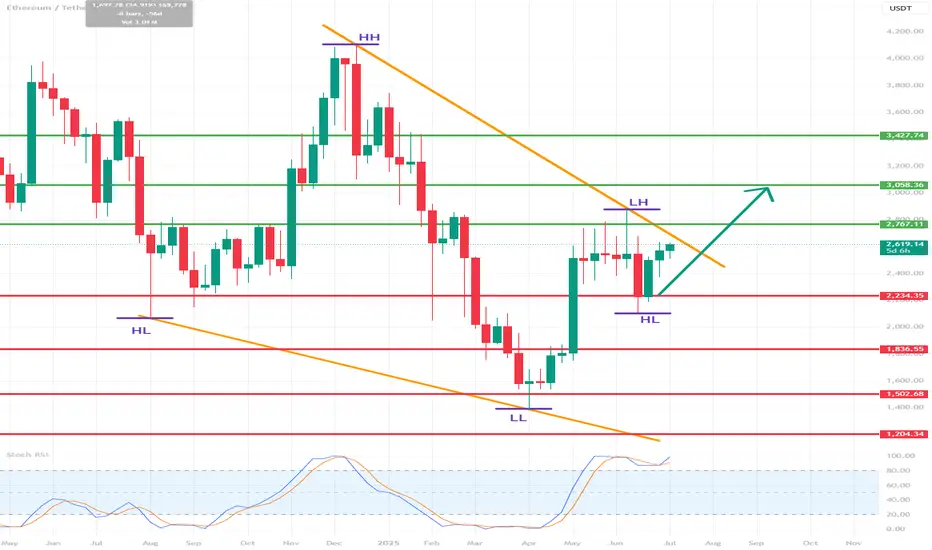
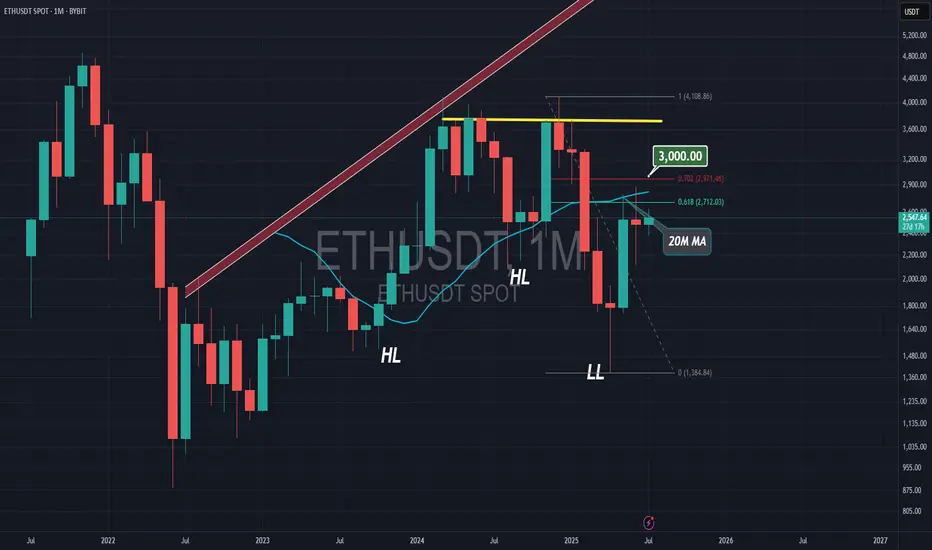
ETH/USDT 1W Chart📊 Trend structure (Price Action)
Downtrend (historical):
A series of Lower Highs (LH) and Lower Lows (LL) — a classic downtrend.
Confirmed by the orange downtrend line.
A change in structure — a possible beginning of an uptrend:
A Higher Low (HL) has recently been formed after a Lower Low (LL).
Suggests a possible end to the downtrend and an attempt to break out upwards.
Currently:
The price is testing the upper downtrend line.
A breakout above the orange line may confirm a trend change.
🟢 Key Resistance Levels (Green Lines):
Level Meaning
3.058 USDT Potential target after a breakout from consolidation
2.767 USDT Nearest strong resistance - currently being tested
3.427 USDT Deep resistance level from the previous high (HH)
🔴 Key Support Levels (Red Lines):
Level Meaning
2.234 USDT Nearest support - previous breakout
1.883 USDT Early 2023 support
1.507 USDT Local bottom
1.204 USDT Historical support - LL extreme
📉 Stochastic RSI (Momentum Indicator):
Currently in the overbought zone.
This may suggest a short-term correction before an actual breakout.
However, in a strong uptrend, the indicator may "hang out" in the overbought zone for a long time.
📈 Potential scenario:
If the breakout above 2.767 and the orange trendline holds:
A possible move to 3.058 USDT as the first target.
Extended target: 3.427 USDT (HH).
If the breakout fails:
Correction to 2.234 USDT or lower.
There is a risk of returning to a downtrend.
✅ Bullish signals:
Higher Low (HL) formation after Lower Low (LL).
Testing the upper downtrend line with an attempt to breakout.
Volume is increasing (based on candles).
⚠️ Bearish threats:
Stochastic RSI in the overbought zone.
Breakout not confirmed by 100% (needs a weekly closing candle above 2.767).
Resistance at 3,058 could halt the move.
📌 Conclusion:
Ethereum (ETH) could be on the cusp of a new uptrend, but a breakout above 2,767 USDT is needed for confirmation. If it does, a move to 3,058 and then 3,427 is possible. However, the current overbought level on the Stochastic RSI could signal a short-term correction before the trend gains strength.
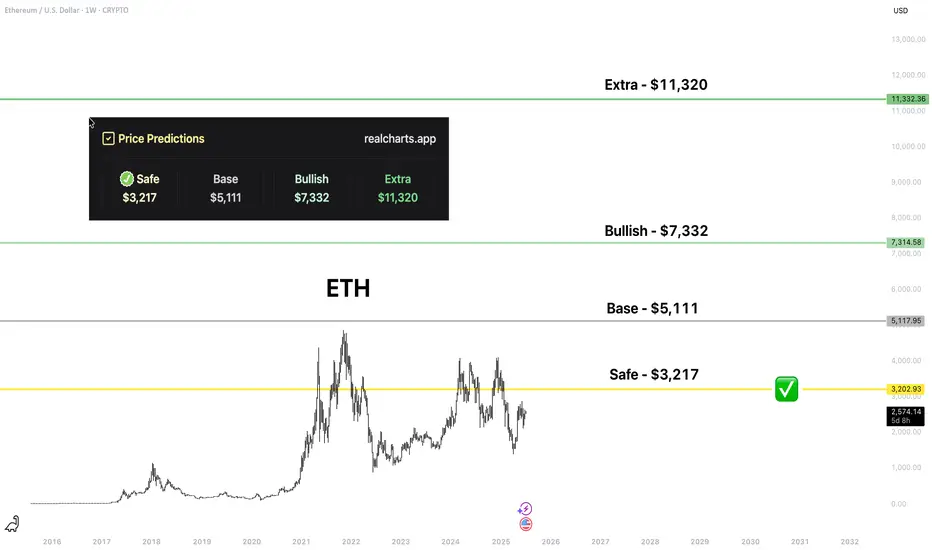
ETH | Price PredictionI believe that COINBASE:ETHUSD is the most important ecosystem for crypto and am bullish on it. The price of many great assets is absolutely dependent on ETH, because those assets have ETH as the key liquidity. I love assets from the ecosystem: OKX:MORPHOUSDT , BINANCE:WLDUSDT , BINANCE:OPUSDT , BINANCE:ARBUSDT , BINANCE:LDOUSDT , $BINANCE:STRKUSDT.
Those levels are from my platform. I believe that up to "Bullish" is really easy to hit this "cycle".
ETH Long Swing Setup – Sideways Hold with Dip-Buy OpportunityETH continues to hold above the key $2,300 support, showing resilience and consolidating within range. We’re watching for one more dip into the $2,300–$2,375 zone to trigger a long entry, with momentum building for a potential breakout.
📌 Trade Setup:
• Entry Zone: $2,300 – $2,375
• Take Profit Targets:
o 🥇 $2,900 – $3,000
o 🥈 $3,300 – $3,400
o 🥉 $4,000 – $4,200
• Stop Loss: Daily close below $2,000

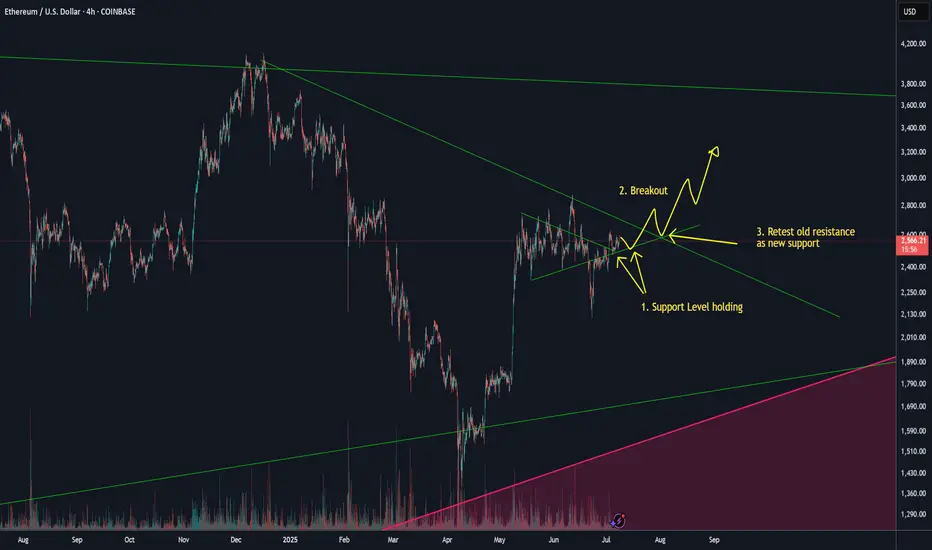
ETH to 3KETH is looking set to challenge the 3k level.
You can see by the small breakout and old resistance acting as new support levels at fig 1 that ETH is building towards a leg up.
Look for ETH to move higher with a small breakout (fig 2), retest (fig 3) before moving higher towards the 3K range.
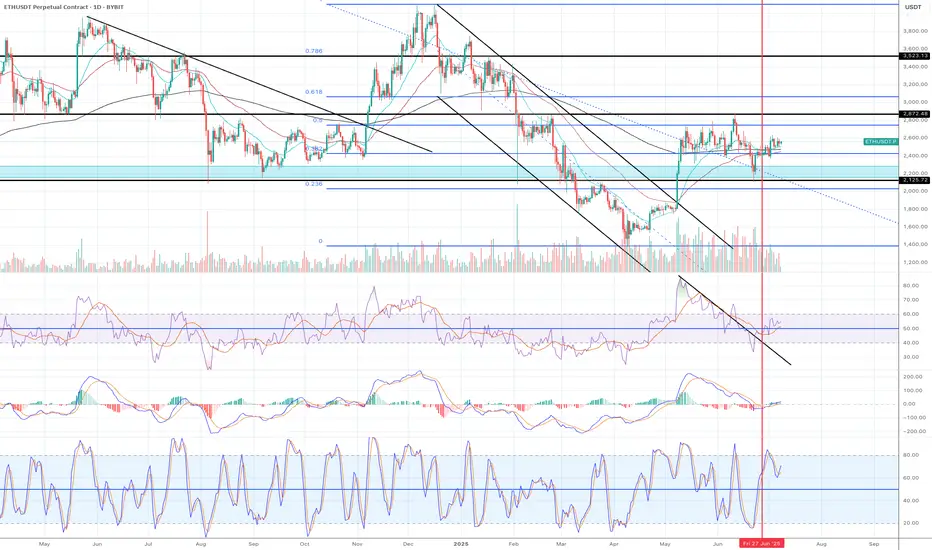
ETHUSDT Long / Buy SetupMust take from the entry and USE tight SL. Can be a fakeout, if real breakout then tps are mentioned. In case sl hit, use the previous setup, it's still valid. While for short I'm still waiting for 3k or above.

Time to go long!!
1) A candle broke out and closed above the descending parallel channel.
2) The price has been consolidating above Fib0.0382 level for weeks.
3) The recent candles are sitting above EMA21.
4) EMA 21 is above EMA55.
5) EMA200 is running horizontally still but it is getting close to cross EMA55.
6) All momentum indicators are in the bull zone and still plenty to go before it hits overbought territory.
There might be a strong breakout to the upside.
It is time to go long.
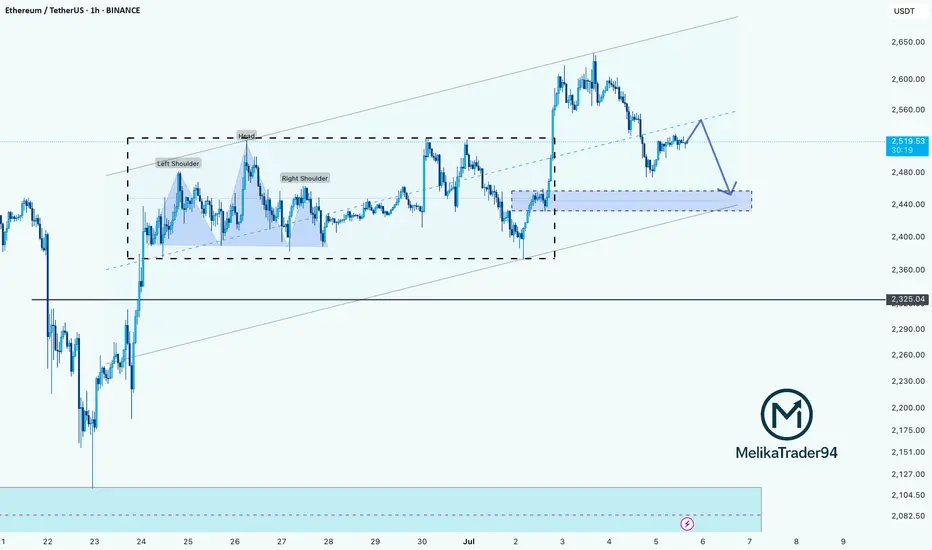
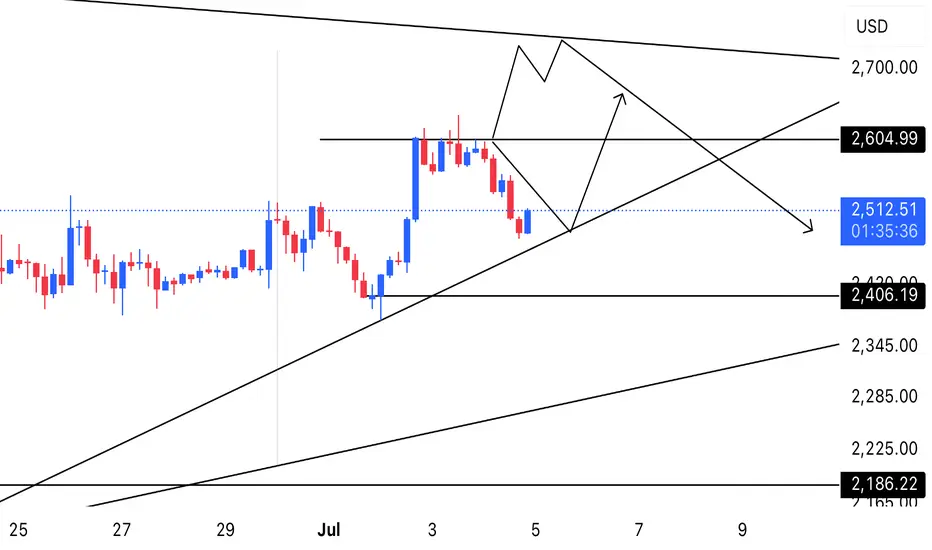
Ethereum Faces Key Resistance: Potential Pullback AheadHello Guys!
What I see:
Head and Shoulders Pattern:
Left Shoulder: Formed
Head: Peak, followed by a drop.
Right Shoulder: Formed.
The neckline break around $2,450 initiated a downside move, confirming the bearish setup.
Current Price Action:
ETH is currently trading near $2,519, attempting to reclaim the broken neckline zone, which now acts as resistance.
The price action is showing lower highs, hinting at weakening bullish momentum.
Bearish Retest in Progress:
The chart shows an anticipated bearish retest of the support-resistance flip zone ($2,530–$2,550), with a probable rejection leading ETH back down toward the $2,440–$2,450 support zone.
Demand Zone:
A strong demand area is visible between $2,420–$2,450. Price may revisit this zone before making the next major move.
Trend Channel:
ETH is moving within an ascending channel, and the lower bound coincides with the highlighted demand zone.
________________________
Let's check this deja vu:
You can see that previously the price formed an H&S and after that did a hunting of the head! And after that price experienced a drop there! Same scenario here!
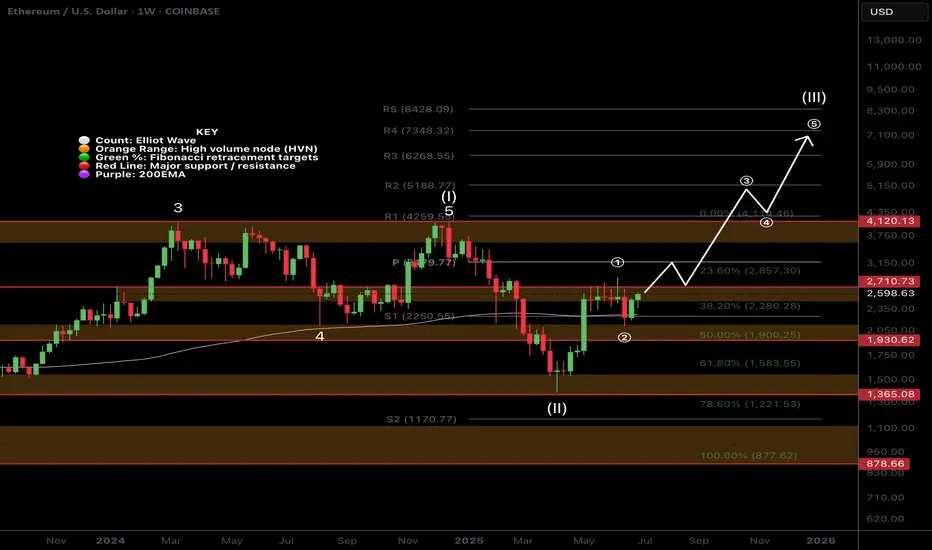
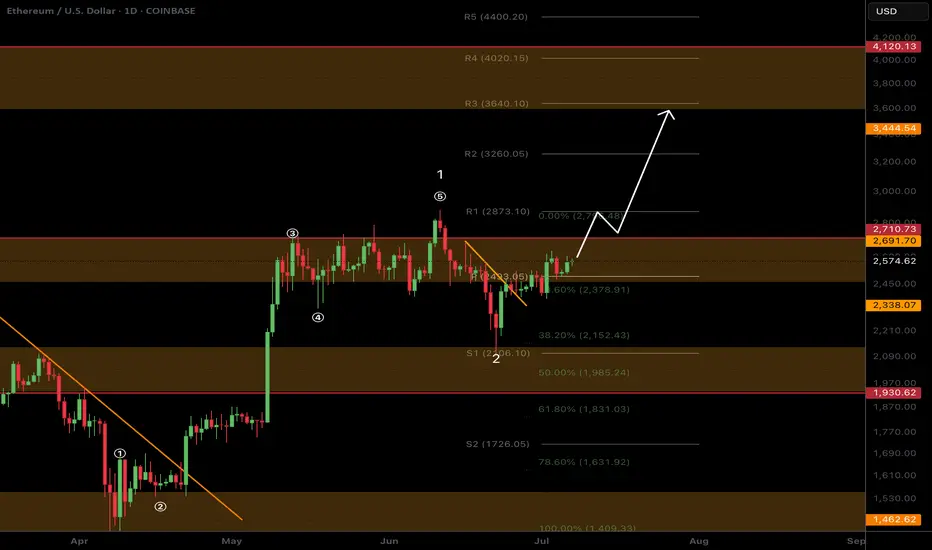
$ETH Breakout this week?CRYPTOCAP:ETH local chart looks ready
I think were looking at a decent ETH breakout this week to the next resistance High Volume Node at $3600 minimum target.
👉 BTC is consolidating under all time high resistance after multiple tests which is usual a sign of bullish continuation. Usualy giving alts room to room.
👉 Ethereum is above the daily 200EMA, daily pivot and also consolidating under resistance once more after testing the 0.382 Fibonacci retracement and S1 daily pivot adding confluence to that being the local bottom. This appears to be Elliot wave 2, a shallow wave 2 retracement (less than 0.5) is a show of strength and investor impatience.
Analysis invalidated below the daily pivot and daily 200EMA as this will lock in 3 waves up and look corrective.
Safe trading
Why You Still Lose Money Even With Perfect AnalysisYour setup was on point, your entry was clean, your stop-loss was tight.
Everything looked perfect.
And yet, you still lost.
Maybe the real issue isn’t in your chart, maybe it’s in your head.
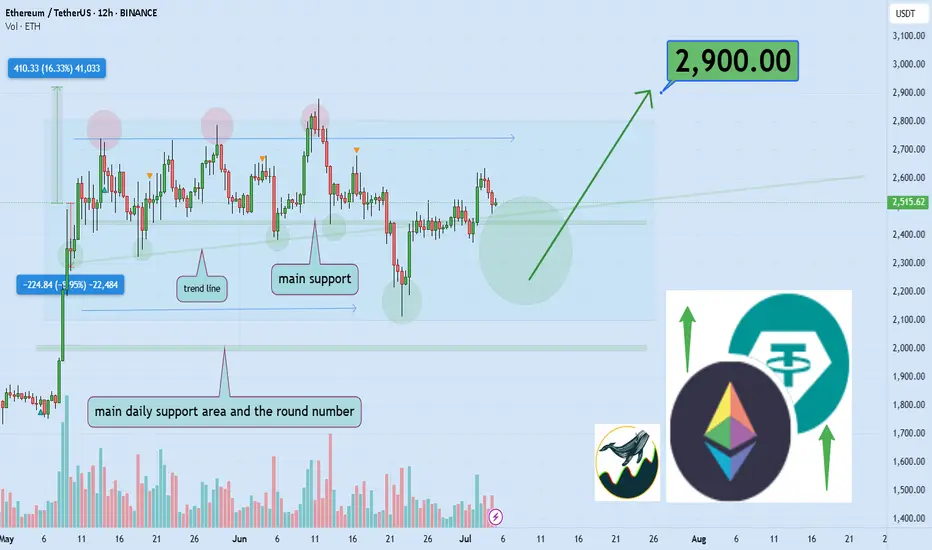
Hello✌
Spend 3 minutes ⏰ reading this educational material.
🎯 Analytical Insight on Ethereum:
BINANCE:ETHUSDT is currently trading inside a well-defined parallel channel 📈. It is approaching a key daily support level that coincides with an important ascending trendline. A breakout above this channel could lead to a bullish move, targeting at least a 16% gain with a primary resistance zone near $2900 🚀. Monitoring how price reacts around this area will be critical for confirming the next leg up.
Now , let's dive into the educational section,
🧠 Analysis Is Half the Game
Having a clean technical analysis doesn’t guarantee anything if your behavior ruins it.
Most traders change their minds mid-trade because of fear, hope, or noise from other sources.
Market psychology doesn’t always respect your Fibonacci retracement. You might be right and still lose because you couldn’t hold on to the plan.
🕒 Don’t Enter Before the Market Does
Timing is underrated. Many traders get in too early. Your analysis may predict a breakout, but price isn’t ready yet.
Zoom out. A solid setup on the 1-hour chart might need confirmation from the 4-hour or daily.
A great trade is not just where you enter, but when.
😤 It’s Not the Chart — It’s Your Mind
Many times, the chart setup is perfect. But when price wobbles a bit, you lose confidence.
Imagine this: a clean uptrend, higher highs forming, but a small retracement hits and you close the trade. Why? Fear. Not logic.
You lost not because of analysis, but because you couldn’t handle being right under pressure.
📊 TradingView Tools: More Than Just Indicators
If all you're using in TradingView are the typical RSI or MACD indicators, you're barely scratching the surface.
Tools like Bar Replay can simulate real-time reactions to past price action, not just for backtesting, but for testing your discipline under real psychological pressure.
Try this: pick a point where you lost money despite solid analysis. Use Bar Replay and “re-live” the chart without knowing what happens next. Was your entry early? Did you panic exit? Or did your stop-loss placement ignore structure zones?
Also, use the Long/Short Position Tool to visually plan your risk/reward, and adjust your bias if the chart structure doesn’t validate it.
For those wanting a deeper layer, add Volume Profile Fixed Range to identify value zones, where whales are active, and overlay it with your own trade setup.
TradingView isn’t just a charting platform. It’s a behavioral mirror. You don’t just look at the chart, it shows how you act when money’s on the line.
🎯 Your Stop-Loss is for the Chart, Not Your Emotions
If your stop-loss is placed based on what feels safe rather than key market structure, you’re not trading the chart. You’re managing anxiety.
Let structure dictate where your risk lies, not your nerves.
😬 Not Executing = Not Trading
If you don’t follow through with your own trade plan, your analysis is meaningless.
Did you cut early just because a big red candle scared you? Or because someone tweeted a bearish take?
That’s not discipline, that’s reactive trading. It has nothing to do with your original logic.
📉 Losses Are Part of Trading… But Not These Ones
There’s a difference between calculated losses and emotional mistakes.
The first is expected, even professional. The second will drain your account and confidence.
Take losses when the plan fails, not when your emotions freak out.
🔍 Reverse-Engineer Your Entry Logic
Next time you trade, take a screenshot and write down your full reasoning.
Why this entry? What did you see? How will you exit?
Later, go back and compare it to what actually happened.
This habit alone can fix more issues than a dozen trading books.
💡 Perfect Analysis ≠ Profitable Trading
Analysis opens the door, but execution and consistency keep you in the room.
Most traders think the problem is their indicator, but it’s usually the part of themselves that doesn’t listen to the indicator at the critical moment.
🧠 The Power of “Logged Experience”
The real difference between amateurs and veterans isn’t screen time. It’s tracked behavior.
Use TradingView’s built-in Note feature, place icons or comments on every trade setup, and keep a record of your actual thought process.
That feedback loop is gold. It builds self-awareness, the rarest edge in trading.
📺 Make It Visual to Make It Stick
Don't rely solely on indicators.
Use Chart Pattern Drawing Tools, head and shoulders, flags, triangles, and reinforce visual memory.
Also, by managing Visibility Settings, you can keep your charts clean while viewing different structures across timeframes.
The result? You start to see the story behind price, not just numbers.
🔚 Final Thought
If you're still losing money with accurate analysis, maybe it’s time to analyze your reactions instead.
TradingView gives you the tools, but the real upgrade is learning to trust your system under stress.
✨ Need a little love!
We put so much love and time into bringing you useful content & your support truly keeps us going. don’t be shy—drop a comment below. We’d love to hear from you! 💛
Big thanks , Mad Whale 🐋
📜Please remember to do your own research before making any investment decisions. Also, don’t forget to check the disclaimer at the bottom of each post for more details.
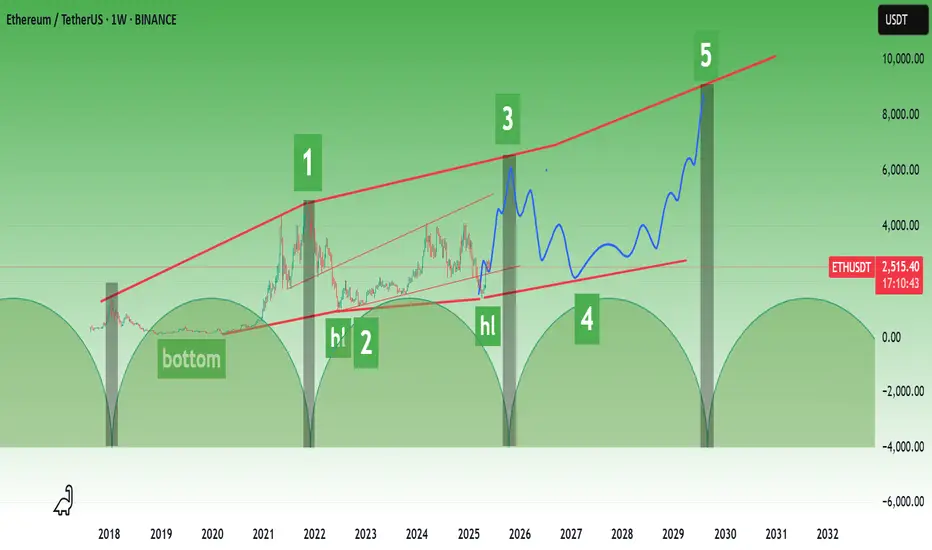
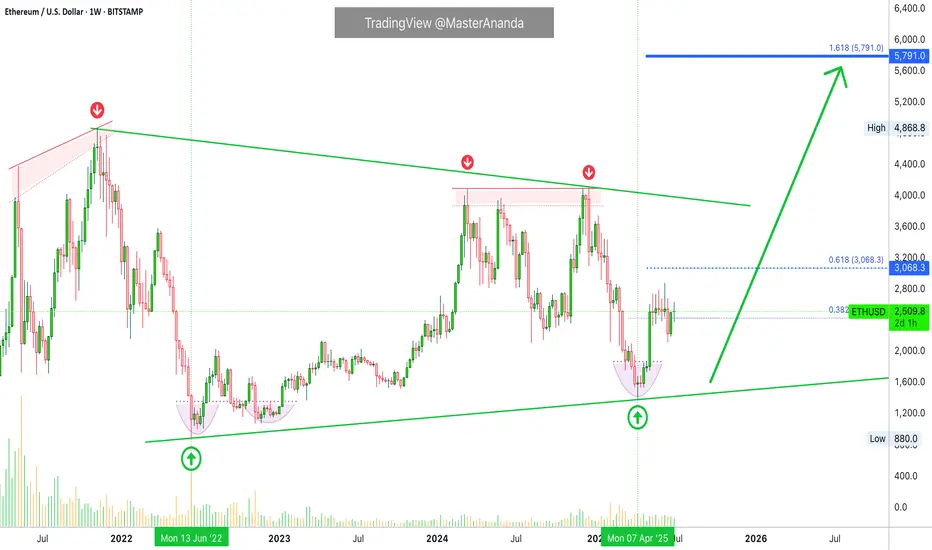
Ethereum $5,791 followed by $8,500 Late 2025Ethereum is due a major, major bullish wave. No new highs since March 2024. Double-top December 2024.
The bear market ended June 2022. April 2025 marks a long-term higher low.
So the peak remains flat, March 2024 vs December 2024. While the bottom is rising, June 2022 vs April 2025.
You could say the top is a lower high of course, November 2021 vs 2024. This is also valid. Even with a lower high top a bullish wave is due leading to a minimum of around $3,800 or $4,000; back to baseline.
Now, if we really want to talk about minimum because we really don't care about worst case scenario, the fundamentals are improving and everything is getting better, consider $5,791. This would be the minimum. With the Ethereum ETFs and the 2025 bull market, we then open up $8,500 and so on. Growth potential is unlimited and we will have to use our imagination. These numbers are good though and definitely a strong level where action will happen. You will see some resistance, some something going on when Ethereum reaches these numbers.
Ethereum is due a major, major bullish wave. It is not a question of "if," it is a question of "when." When will it happen? "If it happens?" No! When, will it happen?
It will happen in 2025. You can be certain about it... Just watch!
....
Ethereum (ETHUSDT) has been consolidating two months above support. Support being $2,425. One week it broke below this level just to recover the next week. More than 8 weeks sideways wicking lower and higher.
The 7-April low, candle and rounded bottom, as well as long-term higher low makes this date a clear bottom. From the bottom we grow. Once the bottom is hit, the trend changes. The trend has been bearish since March 2024. A long time in Crypto term. We are in the bull market year, 2025. What is not happening now, is what will happen next.
The market was bearish for a long time and that's ok. The good news are the waves within cycles... We just came out of a strong correction; we have a small recovery and consolidation. The initial breakout is being consolidated before additional growth.
Lots of thinking, lots of reasoning, lots of studying... Everything you need to know is already present on the chart. Ethereum will grow. Mark by words. It is already happening.
Thank you for reading.
Namaste.
ETHUSD POTENTIAL LONGETHUSD potential bullish setup ↗️
ETH still showing bullish momentum. Might bounce on the bullish trend line, for now it’s hasn’t done the third touch so expect it go lower to the trendline first. A strong bullish confirmation would be a signal to go LONG. Share your thoughts on this in comment section.
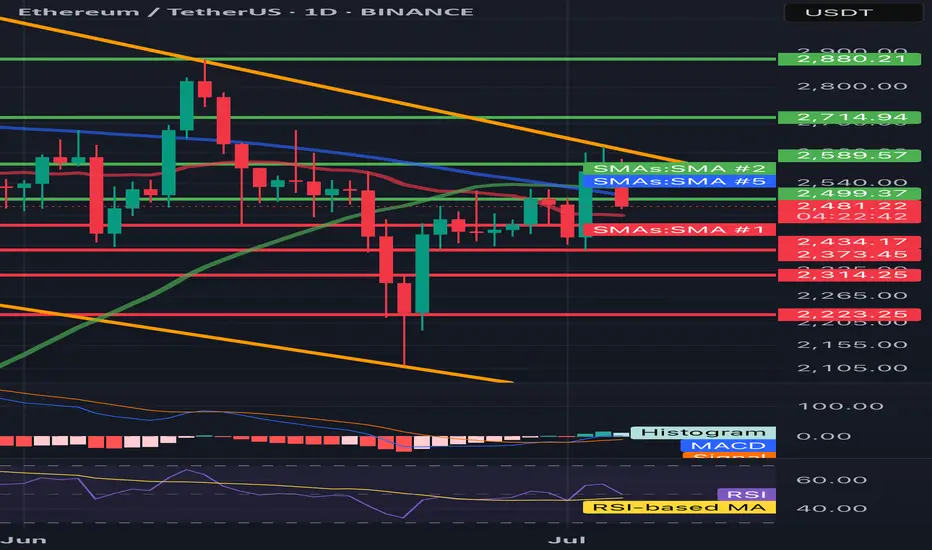
ETH/USDT 1D🔍 ETH/USDT - technical analysis (1D interval):
📉 Price: 2478 USDT (-4.36%)
🔧 Resistance:
• SMA 200 (green): ~ 2589
• Resistance zone: ~ 2715 → 2880 USDT
• SMA 100 (blue): ~ 2500 (just rejected)
🔧 Support:
• SMA 50 (red): ~ 2434 - currently tested
• Strong support: 2373, 2314, 2223 USDT
📊 indicators:
• MacD: freshly intersected, but the momentum is weakening
• RSI: ~ 45 - neutral/weak, under 50 (no bull strength)
• Trend: Still in the downward channel (yellow trend lines)
⸻
⚠️ Conclusions:
• Price rejected from 2500 (SMA 100) and flies down.
• If 2434 falls, a further discount is possible to 2373–2314.
• Lack of bulls with key resistance - the inheritance scenario dominates.
• Watch behavior at 2434 - this is now a key level.
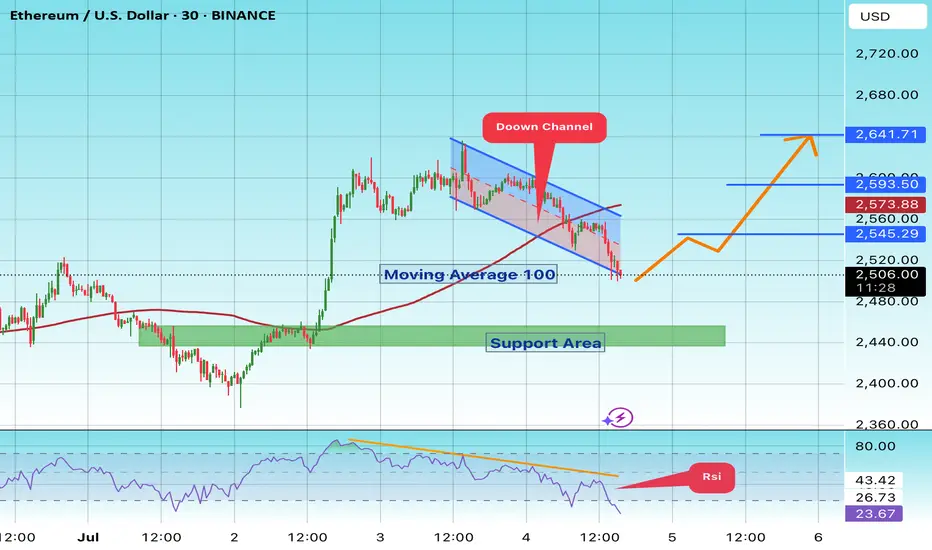
ETH/USDT#ETH
The price is moving within a descending channel on the 1-hour frame and is expected to break and continue upward.
We have a trend to stabilize above the 100 moving average once again.
We have a downtrend on the RSI indicator that supports the upward break.
We have a support area at the lower limit of the channel at 2440, acting as strong support from which the price can rebound.
We have a major support area in green that pushed the price upward at 2440.
Entry price: 2500.
First target: 2545.
Second target: 2539.
Third target: 2641.
To manage risk, don't forget stop loss and capital management.
When you reach the first target, save some profits and then change your stop order to an entry order.
For inquiries, please comment.
Thank you.
ETH SWING TRADEETH Showing strong momentum against BTC, July is also good for eth and some alts, maybe we see correction in Aug, September but before expected pullback towards 2.9k-3k. Must use SL as market is very Volatile these days.

HolderStat┆ETHUSD correctedKUCOIN:ETHUSDT is moving inside a rising wedge after reclaiming support near $2,500. Recent breakout from consolidation supports a continuation push toward $2,720–$2,760. The current trendline structure and bullish price action suggest upside potential.
Ethereum in JULYEthereum should close above $3000 by the end of July to stay in the bull run, Monthly candle is so important now.
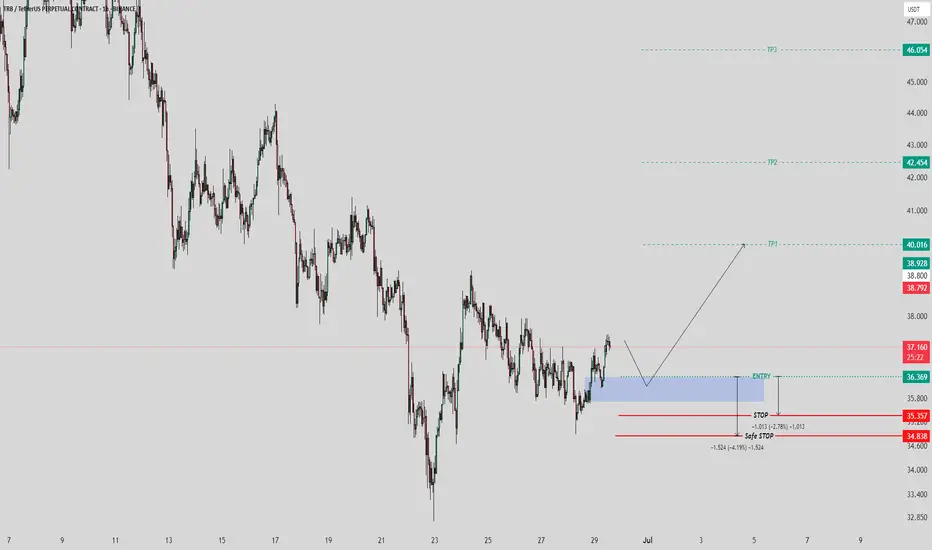
TRBUSDT Setup – Staggered Exits, Smart Profits📌 Entry: 36.70
🎯 TP1: +10% → Secure 50% of position
🛡️ Move to risk-free after TP1 to protect capital
🎯 TP2: Take 50% of remaining volume
🎯 TP3: Close all remaining volume
Calculated exits. Risk-managed. Momentum-ready.
$ETH Wave 3 of 3 Underway?CRYPTOCAP:ETH is back into the range EQ as alt coins pump on the back of CRYPTOCAP:BTC breakout
Price caught a strong bid after testing quadruple support: the major High Volume Node (HVN), daily 200EMA, 0.5 Fibonacci Retracement and daily S1 Pivot. Last week I posted about this area holding to kick off wave 3.
There is still work to do to overcome the recent swing high at HVN major resistance but things are certainly looking bullish. The daily pivot point sits at $3150 as the next target.
Long term terminal target for wave 3 is still the R4 daily pivot at $7340, I don't expect the terminal wave 5 to extend much beyond this, perhaps a wick above to trap retail at the top with a lot of media hype attached.
Analysis is invalidated if we fall below wave (2) swing low $2050.
Safe trading