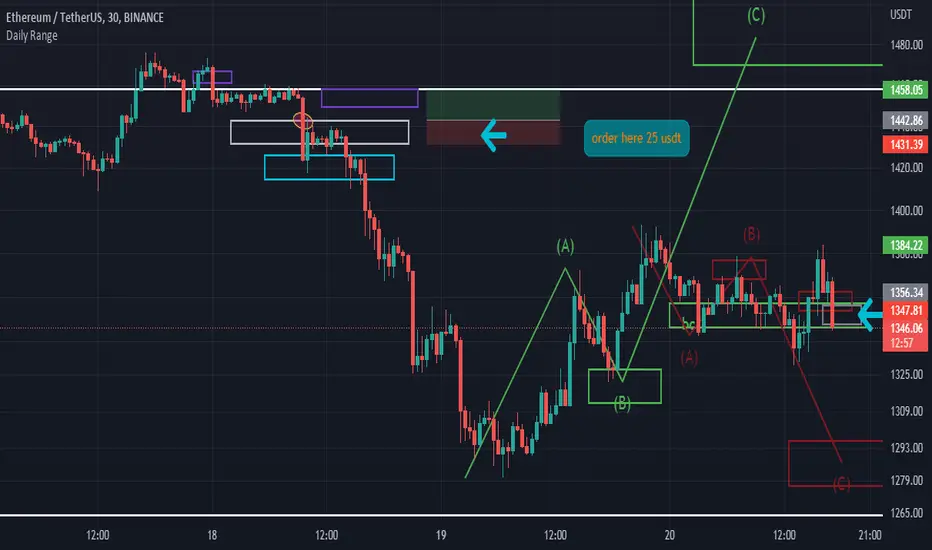
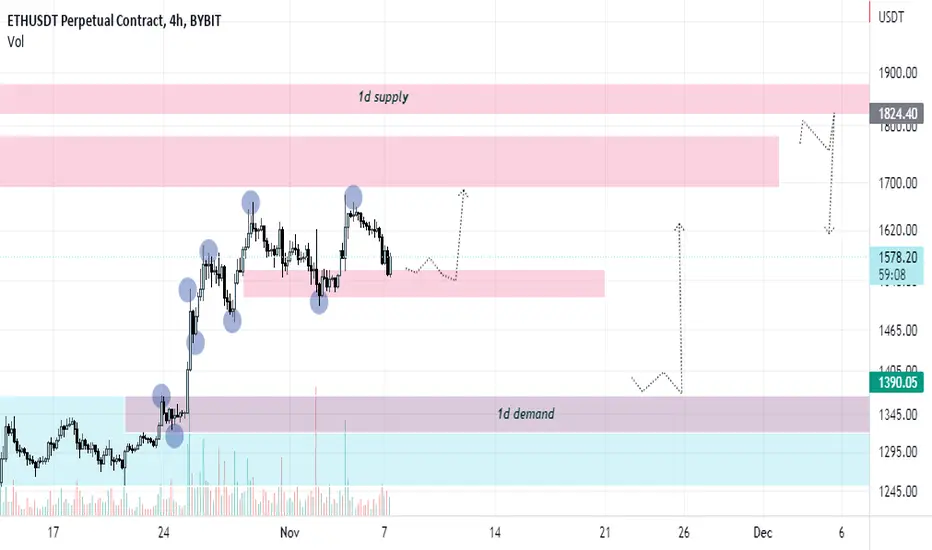
ETH Long Scalp Intraday Countertrend SetupDaily Bias: Bearish
Key Elements and Plot in the Setup:
Asian Range Implementation (I did not catch that Short as it did not occur inside the Time of Day I prefer to enter the markets) Anything unexpected could happen, higher chances of being the liquidity.
HTF Price Range Arrays
Fibonacci Retracement to Discount Area in confluence to an existing HTF Price Range Array of Value (GAP in this scenario)
Targets: Simple the most recent high as above it is the midpoint of the Asian Range where it left without confirmation or retest.
After taking out liquidity in the HTF and LTF, found a Long Scalp Setup to enter.
Time of Day: London and NY Overlap
Ethusdtlong

ETHUSDT2 options for entry ,waiting for CHoCH on 5-15m tf and open long or short, follow the risk management and don't forget to put stop loss
📈✌ETH 30Min Long Position: Risky✌📉BINANCE:ETHUSDT
COINBASE:ETHUSD
Hi traders, first take a look at my previous analysis and positions.
between now and the determined level, you can open long position in one or two steps. 🐱🏍
If the price rises and reaches the TP1 level, you can risk-free the position.
TP1-2-3-4-5-6 are on the chart.
The optimum stop-loss is below the determined levels.
Please share ideas and leave a comment,
let me know what's your idea.
CrazyS✌
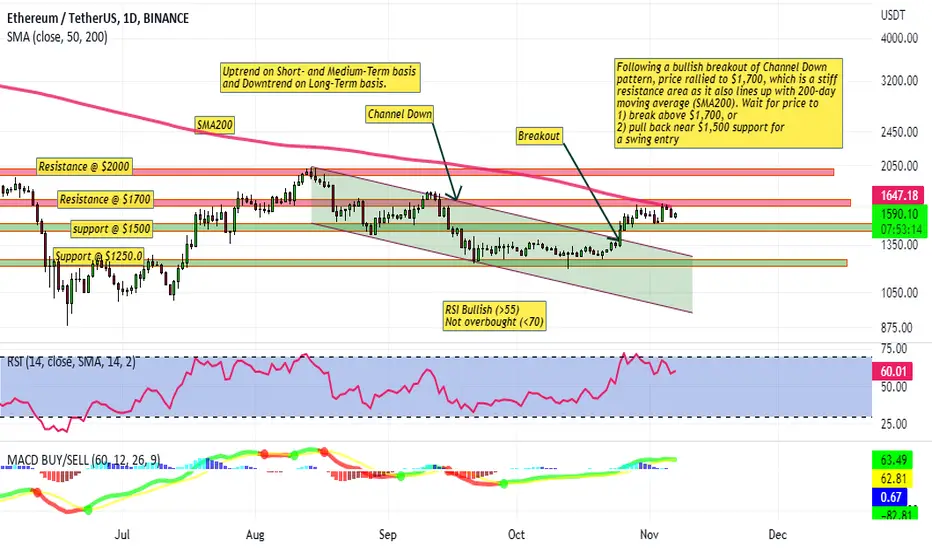
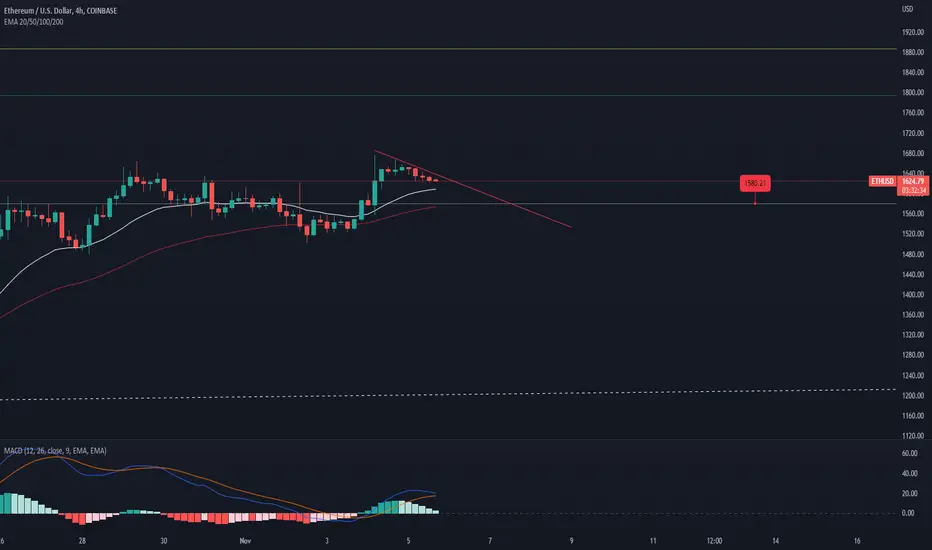
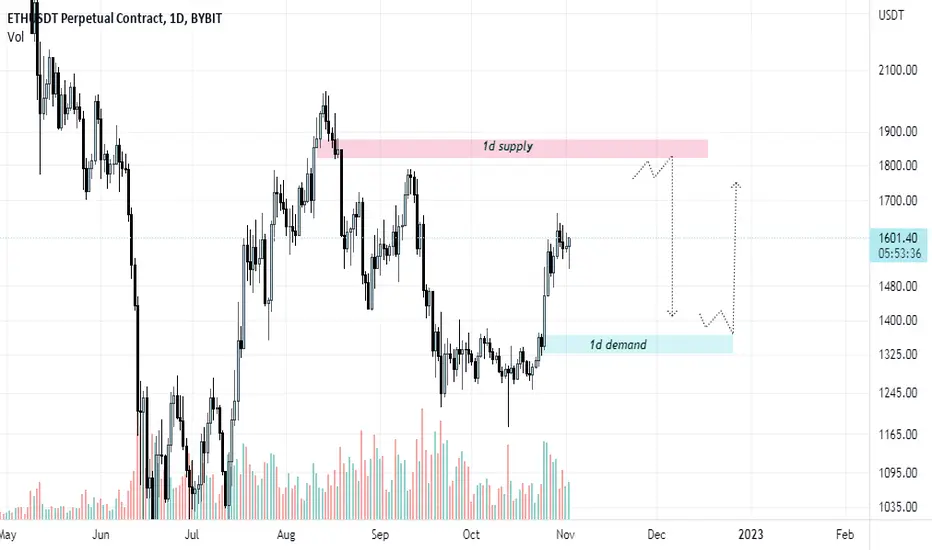
#ETHUSDT bullish breakout Channel Trade setup: Following a bullish breakout of Channel Down pattern, price rallied to $1,700, which is a stiff resistance area as it also lines up with 200-day moving average (SMA200). Wait for price to 1) break above $1,700, or 2) pull back near $1,500 support for a swing entry. If it’s able to break above $1,700, price could revisit $2K. Short- and Medium-term trends have inflected bullish as well. Breaking above $1,700 would also make a Higher High (above the swing high in mid-september), which would also confirm Uptrend. (set a price alert).
Pattern: Price was trading in a Channel Down pattern. With emerging patterns, traders who believe the price is likely to remain within its channel can initiate trades when the price fluctuates within its channel trendlines. With complete patterns (i.e. a breakout) – initiate a trade when the price breaks through the channel’s trendlines, either on the upper or lower side. When this happens, the price can move rapidly in the direction of that breakout.
Trend: Uptrend on Short- and Medium-Term basis and Downtrend on Long-Term basis.
Momentum is Bullish but inflecting. MACD Line is above MACD Signal Line and RSI is above 55 but momentum may have peaked since MACD Histogram bars are declining, which suggests that momentum is weakening.
OBV (On Balance Volume): is rising, indicating that volume on Up days is greater than volume on Down days. Hence, demand (buyers) exceeds supply (sellers).
Support and Resistance: Nearest Support Zone is $1,500 (previous resistance), then $1,250. The nearest Resistance Zone is $1,700, then $2,000.
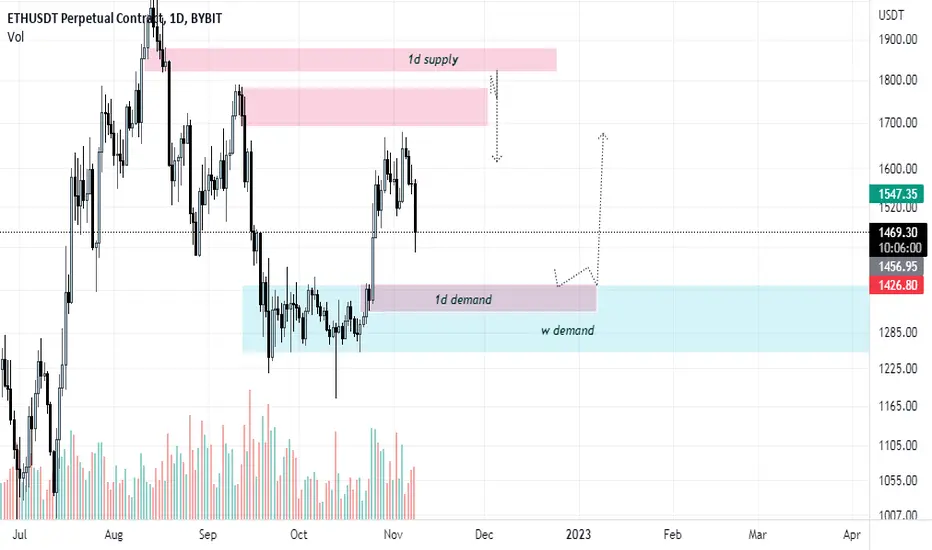
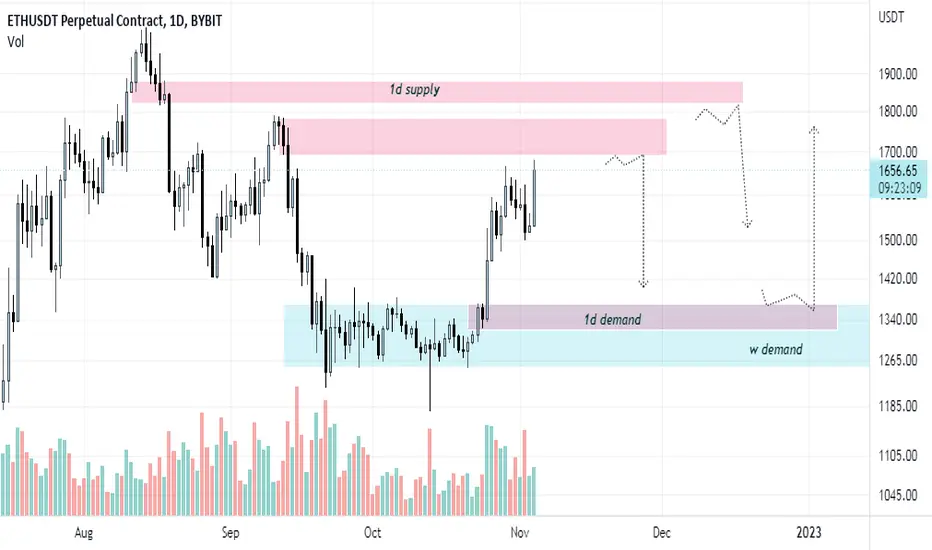
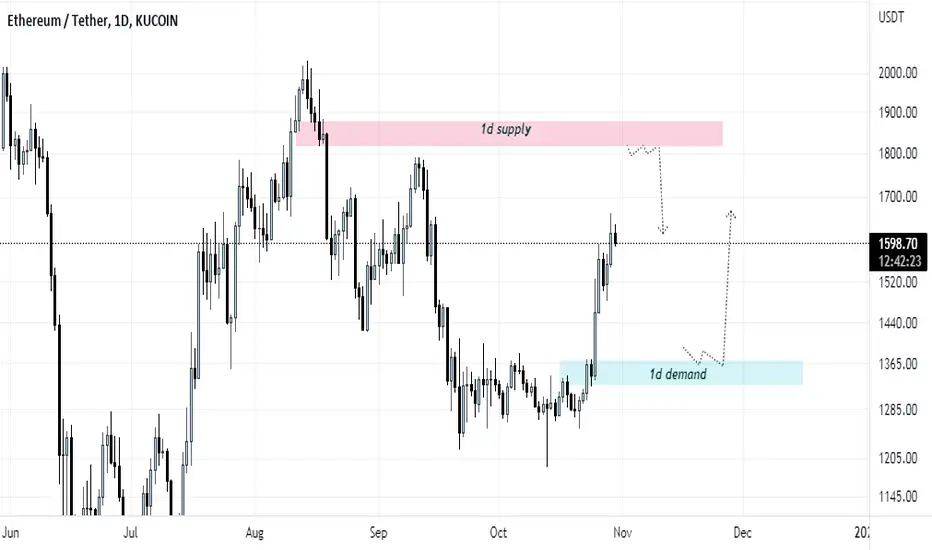
ETH is possibly going for a retest of $1500 and $1400We gave you the targets for ETHEREUM in our last post.
After hitting our first target it seems like ETH is getting weak & RSI needs a retest we might see ETH going back for a pullback towards $1500 or possibly $1400 region.
Ethereum also recently broke our of downtrend and we have a huge gap at $1400 area that needs to be filled before more upside.
If you are looking for longs I would advice you to wait for a decent pullback towards the last breakout zone & then go long.
All the important levels are marked on the chart.
Enjoy Trading.
(press like 👍 if you enjoy + comment your opinion about the market or your thoughts, below this analysis)

ETHUSD - HourlyEthereum on the hourly is showing a slight up channel
This is expanded on with an uptrend that can be drawn (in green)
I expect price to hit this green line and bounce bullishly off it, as has been seen in the past
This all contributes to the price reversal on other timeframes

ETHUSDT3 options for entry ,waiting for CHoCH on 1-15m tf and open short or long, follow the risk management and don't forget to put stop loss
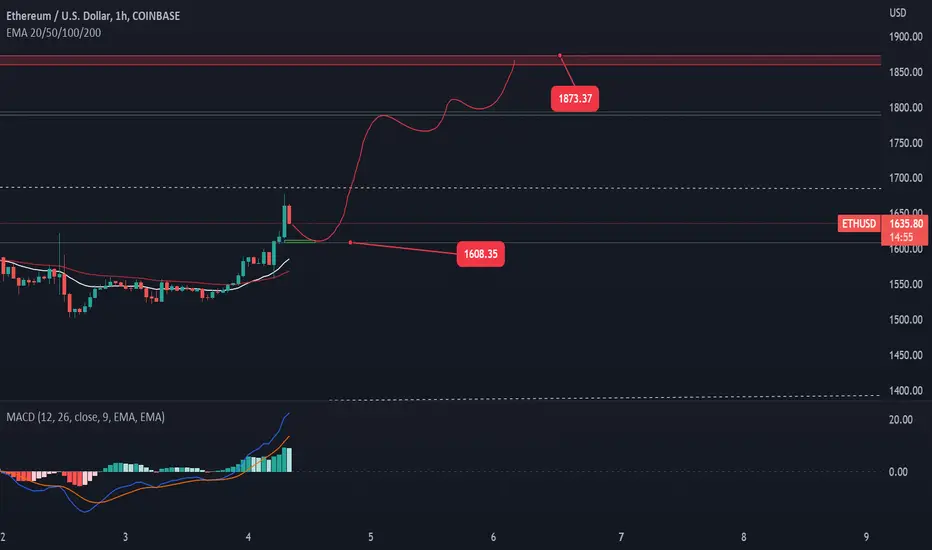
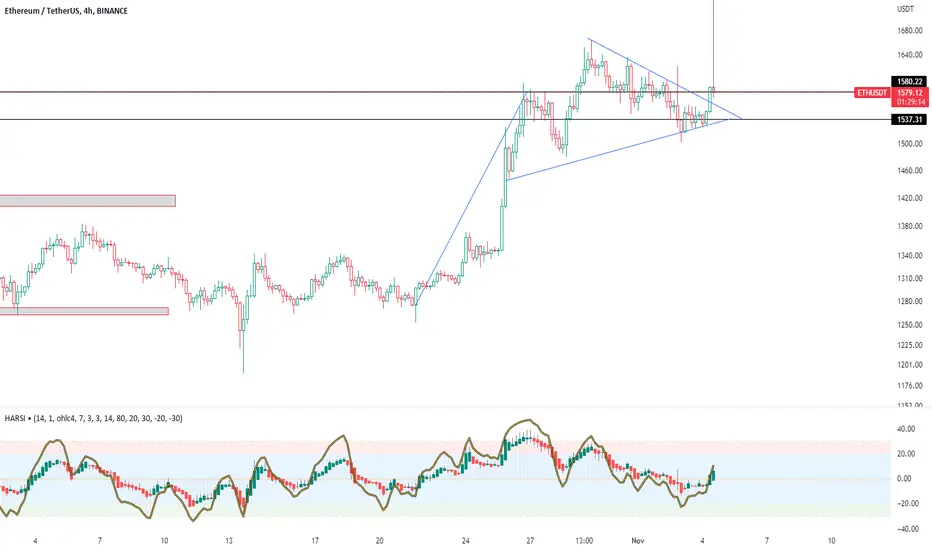
Eth buy zone 1580.21Wait for a retracement here for eth this is the actual .236 lvl that can be used as a nice bounce zone and itll be testing the 50 ema on the 4 hour
ETH Longat the moment i am wait for a retracement to my .236 lvl of 1608.35 and that will be my long entry i wont have a sl so put your own and my tp 1 will be at 1788 and my tp 2 will be at 1873
Will cut them if the daily closes below my .236 lvl of 1608.35
Or if you want to be safe then wait for daily candle to close above
ethusdtlong eth cup and handle on 4 hours however mid terms are coming up in 3 days which would be volatile territory
My Other ETH Idea/FractalThe other idea & fractal that fits pretty well is this one. In the immediate short term, it would have us retrace into the 1558 demand zone and make a higher low before continuing higher. We would end up in the last fair value gap on the upside that needs to be filled, which also coincides with the macro GP from ATH. You can also take the measured move and it lands right in the same place.

ETHUSDThere is ETH analysis where you can get an idea 🚀
ETH shows Triangle lets hit the target 💥
Stoploss is Must

ETHUSDT3 options for entry ,waiting for CHoCH on 1-15m tf and open long or short, follow the risk management and don't forget to put stop loss
ETHUSDT2 options for entry ,waiting for CHoCH on 1-15m tf and open long or short, follow the risk management and don't forget to put stop loss
ETH-USDT +20% PROFIT DONESPOT TRADING
ETH-USDT
BUY : 1348$
SELL: 1625$
PROFIT : 20%✅
Target hit successfully

ETHUSDT3 options for entry ,waiting for CHoCH on 1-15m tf and open long or short, follow the risk management and don't forget to put stop loss
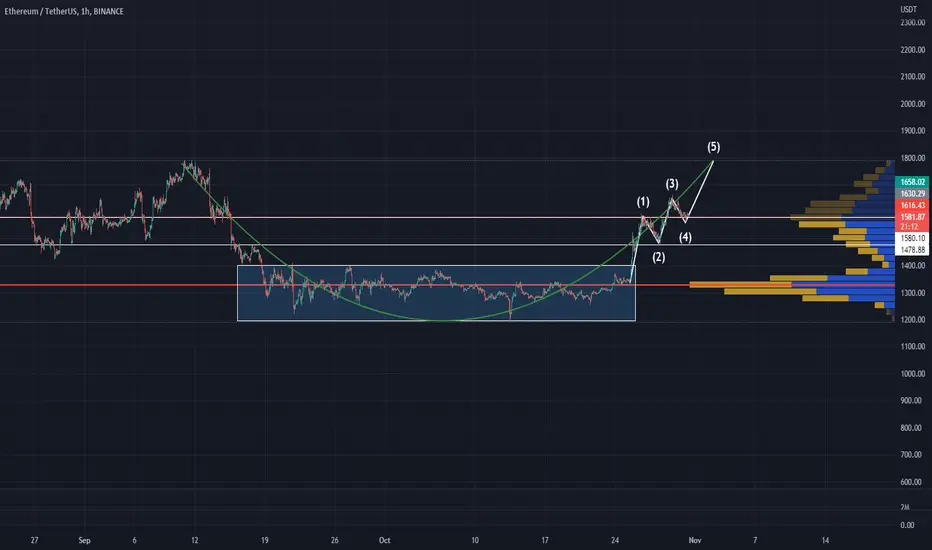
Ethereum price analysis Ethereum now is facing a strong support , I don't think wave 4 going to break it at the moment unless we see a really bad news in 2-Nov , most likely for me we going to see wave 5 starting from here to close the full cup at 1791$-1800$
Goodluck !
ETHUSDTtwo options for entry ,waiting for CHoCH on 1-15m tf and open long or short , follow the risk management and don't forget to put stop loss
#ETH Some Probability Hi guys, This is CryptoMojo, One of the most active trading view authors and fastest-growing communities.
Consider following me for the latest updates and Long /Short calls on almost every exchange.
I post short mid and long-term trade setups too.
Let’s get to the chart!
I have tried my best to bring the best possible outcome to this chart, Do not consider financial advice.
#ETH(Update)
#ETH breakout this big descending channel currently it looks like it will restest this channel and then we can expect some good bounce from there.
technical we can expect almost 30% bounce according to the pattern.
This chart is likely to help you make better trade decisions if it does consider upvoting it.
I would also love to know your charts and views in the comment section.
Thank you

ETHUSDTtwo options for entry ,waiting for CHoCH on 1-15m tf and open long or short , follow the risk management and don't forget to put stop loss
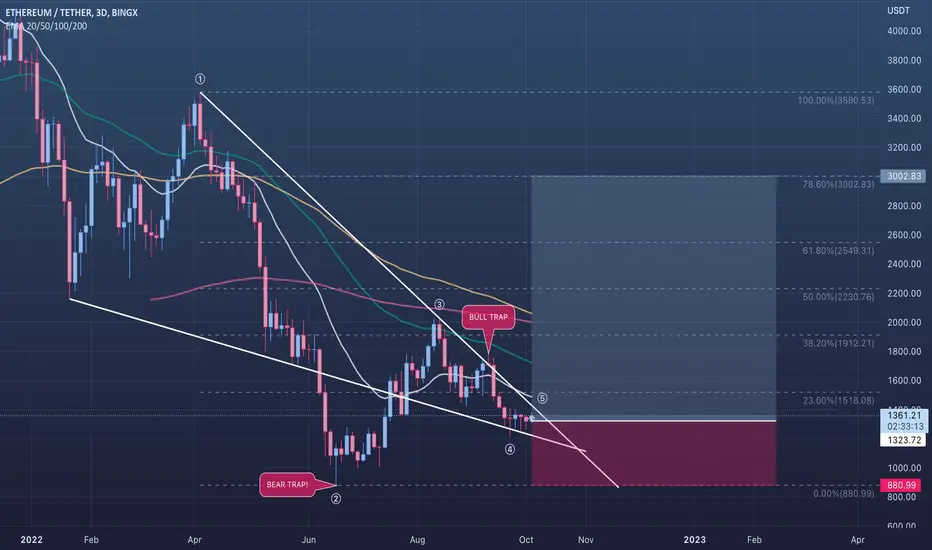
🟢 ETHUSDT - 3D (06.10.2022)🟢 ETHUSDT
TF: 3D
Side: Long
SL: $880.99
TP 1: $1,518.08
TP 2: $1,912.21
TP 3: $2,230.76
I think ETH is done falling for now. It could be possible to retest $880 - $1,000 range before going up but I do not think it will go lower than that at this stage.
ETHUSDT analysis buying signal crypto Market in our green buying zone (BC) also there is a break in the correction lvl for the bearish red sequence also this area gray area is correction for the impulsive bulls wave with a good potential for up trend wave RR 3:1