ETH at Critical Resistance + Liquidation Zone | Time to Short?Today I want to analyze Ethereum ( BINANCE:ETHUSDT ) on the 1-hour time frame . Is there a short position opportunity?
Please stay with me.
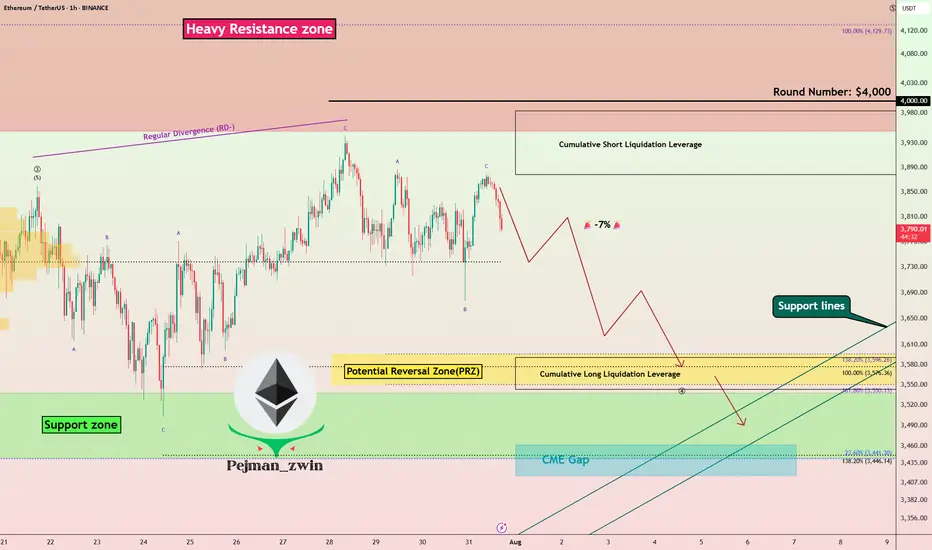
Ethereum is currently trading near a Heavy Resistance zone($4,390-$3,950) , Cumulative Short Liquidation Leverage($3,983-$3,878) and the $4,000 ( round number ). $4,000 could be a psychological number to sell .
In terms of Elliott Wave theory , Ethereum appears to have completed the main wave 3 at $3,860 and is currently completing the main wave 4 . The main wave 4 could have a Double Three Correction(WXY) or Expanding Flat(ABC/3-3-5) , with the Expanding Flat structure being more likely .
One of the reasons why shorting Ethereum could be better than shorting Bitcoin right now is that ETHBTC ( BINANCE:ETHBTC ) is currently trading above the ascending channel and is likely to correct to Fibonacci levels .
Also, we can see the Regular Divergence(RD-) between Consecutive Peaks.
I expect Ethereum to drop to at least the Potential Reversal Zone(PRZ) and attack the Support lines ( Second target ) .
Cumulative Long Liquidation Leverage: $3,591-$3,543
CME Gap: $3,461-$3,417
Note: Stop Loss: $4,023
Please respect each other's ideas and express them politely if you agree or disagree.
Ethereum Analyze (ETHUSDT), 1-hour time frame.
Be sure to follow the updated ideas.
Do not forget to put a Stop loss for your positions (For every position you want to open).
Please follow your strategy and updates; this is just my Idea, and I will gladly see your ideas in this post.
Please do not forget the ✅' like '✅ button 🙏😊 & Share it with your friends; thanks, and Trade safe.
ETHUSDTPERP
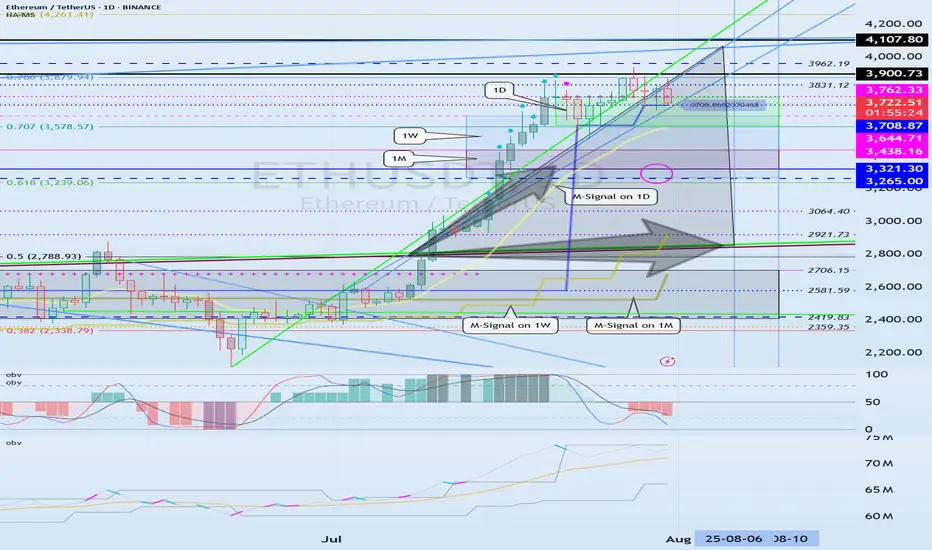
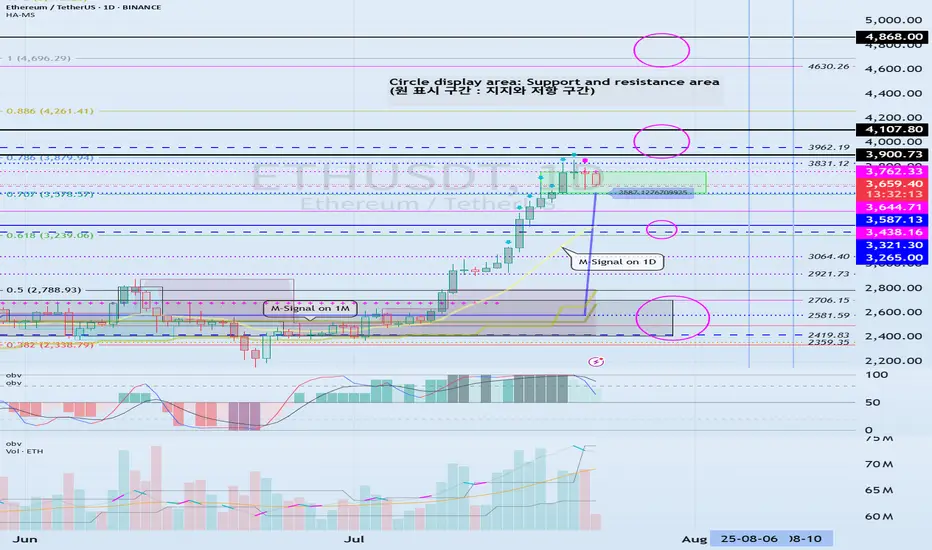
The key point to watch is whether it can rise to 3900.73-4107.80
Hello, traders. Nice to meet you.
If you "Follow," you'll always get the latest information quickly.
Have a great day.
-------------------------------------
(ETHUSDT 1D Chart)
The upward trend continues, with the M-Signal on the 1D chart > M-Signal on the 1W chart > M-Signal on the 1M chart.
Therefore, if the price holds above 3265.0-3321.30, a medium- to long-term uptrend is likely.
Currently, the HA-High ~ DOM(60) range is formed across the 3265.0-3762.33 range on the 1M, 1W, and 1D charts.
Therefore, the key question is whether support is found within the 3265.0-3762.33 range.
-
While the price is trending upward along the short-term trendline, if it falls below the short-term trendline and encounters resistance by falling below the M-Signal indicator on the 1D chart, a decline to the 3265.0-3321.30 range is likely.
ETH's volatility period is expected to last from August 6th to 10th.
The key point to watch is whether it can rise above the 3900.73-4107.80 range after this volatility period.
-
Since the StochRSI indicator has entered an oversold zone, the downside is likely to be limited.
Since the OBV indicator of the Low Line ~ High Line channel remains OBV > OBVEMA, a significant decline is unlikely.
However, since the TC (Trend Check) indicator is below zero, selling pressure is dominant.
Therefore, a decline below 3708.87 could lead to further declines. However, as previously mentioned, the decline is likely to be limited, so a significant decline is not expected.
Once the M-Signal indicator on the 1D chart is encountered, the trend is expected to re-establish itself.
-
Thank you for reading to the end.
I wish you successful trading.
--------------------------------------------------
- This is an explanation of the big picture.
(3-year bull market, 1-year bear market pattern)
I will explain in more detail when the bear market begins.
------------------------------------------------------
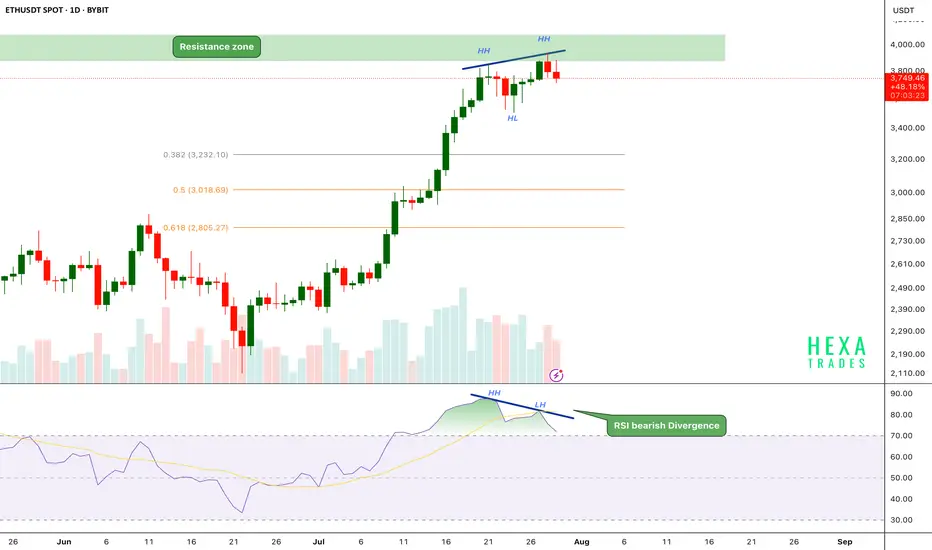
ETH Bearish Divergence!CRYPTOCAP:ETH has been in a strong uptrend, printing consistent higher highs (HH) and higher lows (HL). However, on the daily chart, the price has now reached a critical resistance zone near the $3,800–$4,000 range.
Key Points:
🔸 Bearish RSI Divergence
While price action has formed a new higher high, the RSI has printed a lower high, signaling bearish divergence.
This indicates that upward momentum is weakening even as price attempts to push higher — a common early warning of a possible short-term reversal.
🔸 Fibonacci Retracement Levels
The fib 0.382 at $3240 and 0.5 and 0.618 retracement levels are sitting around $3,000 and $2,800, respectively, potential targets if a correction follows.
🔸 Volume Profile
Volume is gradually declining as price approaches resistance, suggesting buyer exhaustion.
If the price breaks above the $4,000 psychological resistance, we could see a strong bullish move.
ETH is facing strong resistance after a powerful rally, with RSI bearish divergence and weakening momentum hinting at a possible short-term pullback. We should be cautious entering fresh longs here without confirmation.
Support: $3,200, $3,000, and $2,800
Cheers
Hexa
BINANCE:ETHUSDT BITSTAMP:ETHUSD
ETH NEXT MOVE AND BUY ZONE.1. Market Structure:
ETH/USDT broke previous structure highs (marked with X), confirming a bullish trend shift.
Price made a strong impulsive move upward after that break, forming higher highs and higher lows, indicating smart money accumulation.
2. Price Action & Current Retracement:
After forming a recent peak near $3,950, ETH entered into a retracement.
The retracement is currently holding above key liquidity and demand zones, showing signs of healthy correction rather than reversal.
3. Liquidity Grab – Sell-Side Liquidity (SSL):
There is Sell-Side Liquidity (SSL) resting below $3,700, which has not yet been taken out.
Smart money often targets such liquidity before initiating a new leg up — this makes SSL a potential magnet for price.
4. Fair Value Gap (FVG) + Demand Zone (POI):
Just below the SSL lies a confluence zone:
A clear Fair Value Gap (FVG) between approximately $3,680–$3,700, showing inefficiency in price.
A Demand Zone (POI) below that, between $3,640–$3,680, representing the origin of the bullish move that broke structure.
This zone provides high-probability support and a potential area of smart money re-entry.
5. Trade Setup Expectation:
Scenario: Price is likely to:
Sweep SSL below $3,700.
Tap into the FVG + Demand Zone.
Show bullish confirmation (like a bullish engulfing, Choch/BOS on lower timeframe).
Entry: After confirmation inside demand zone.
Stop Loss: Below demand zone (~$3,620).
Take Profit 1: Retest recent high at $3,950.
Take Profit 2: Extension toward $4,050–$4,100 based on higher timeframe targets.
✅
Summary:
ETH/USDT is in a bullish structure but currently pulling back. A sweep of sell-side liquidity (SSL) and a tap into the FVG + Demand Zone around $3,640–$3,700 is expected. After confirmation, it offers a high-probability long setup, aligning with smart money accumulation logic.

ETHUSDT Classic Cup PatternEthereum is forming a textbook Cup pattern on the 1H chart, signaling a strong bullish setup. After a rounded bottom forming the “cup,” ETH is now pushing toward the neckline resistance around $3,870. A confirmed breakout above this level could lead to a powerful upward move.
Cheers
Hexa

ETHUSDT Short Trade IdeaShort ETHUSDT at $3,745.22 with a target of $3,561.34.
Reason for Short: The 4-hour chart shows a symmetrical triangle pattern with resistance around $3,745-$3,800. The price is testing this upper trendline, and a recent bearish candle suggests potential rejection. The DEMA at $3,747.75 indicates overextension, supporting a pullback.
What I See: Heavy sell pressure is forming near $3,745, with the triangle nearing a breakout/breakdown point. Support lies around $3,561, aligning with prior lows.
Stop Loss: Set at $3,802, above the recent high and triangle resistance, to avoid a bullish breakout.
Trade Rationale: A breakdown from the triangle with volume confirmation could drive the price to $3,561. The tight stop above resistance minimizes risk while targeting a key support level.

Check if HA-High indicator is forming at 3587.13
Hello, traders.
If you "Follow", you can always get the latest information quickly.
Have a nice day today.
-------------------------------------
(ETHUSDT 1D chart)
HA-High indicator is showing that it is about to form at 3587.13.
Accordingly, if the HA-High indicator is newly created, the support in the 3587.13-3762.33 section is an important issue.
If it falls below 3587.13, it is likely to touch the M-Signal indicator on the 1D chart.
Therefore, we should check whether it touches the area around 3265.0-3321.30 and rises.
-
This can be seen as a time to test whether it will continue the first step-up trend while rising in the important section of 2419.83-2706.15.
ETH's volatility period is around August 6-10, but we should check what kind of movement it shows after passing the volatility period of BTC.
-
Thank you for reading to the end.
I hope you have a successful transaction.
--------------------------------------------------
- This is an explanation of the big picture.
(3-year bull market, 1-year bear market pattern)
I will explain more details when the bear market starts.
------------------------------------------------------
ETH Ready to Pop!ETHUSD is once again testing the upper boundary of a long-term symmetrical triangle on the monthly chart. This pattern has been forming since the 2021 peak, showing consistently higher lows and lower highs. Previous breakouts from similar consolidation patterns (2017 and 2020) led to massive rallies. With the current monthly candle showing strong bullish momentum, a confirmed breakout above this structure could mark the beginning of Ethereum's next major bull run. Keep an eye on the breakout level for confirmation.
Cheers
Hexa

ETH Healthy Retest Before Next Rally!Ethereum continues to trade within a strong uptrend on the 1-hour chart, respecting the 100 EMA consistently throughout the rally. After a strong impulse move, the price is now consolidating near the recent highs.
ETH price could retest the 0.382 Fibonacci level and the 100 EMA before continuing upward. A successful retest would signal strength and could lead to a bullish continuation toward the $3900 - $4000 range.
Similar historical retests of the 100 EMA led to strong rallies, and we could see a repeat of that pattern if support holds.
Cheers
Hexa
BITSTAMP:ETHUSD CRYPTOCAP:ETH
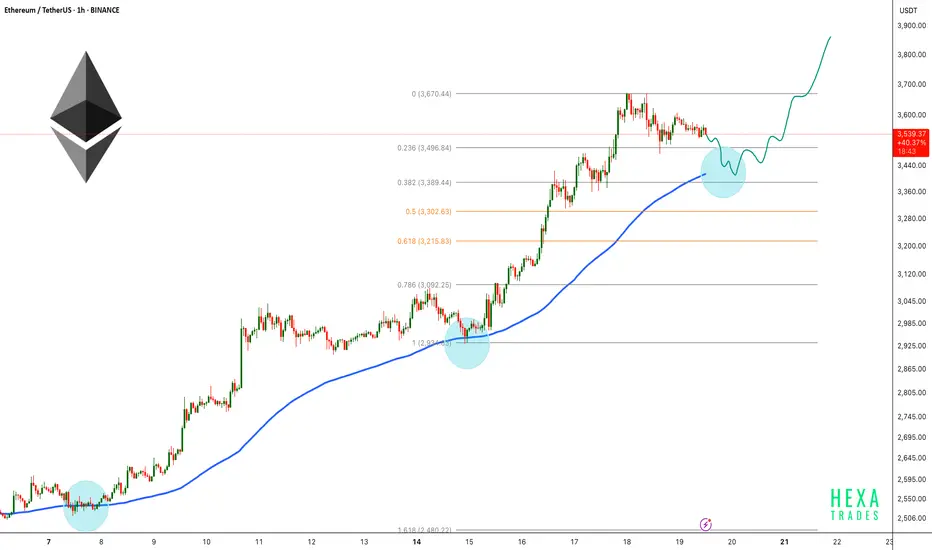
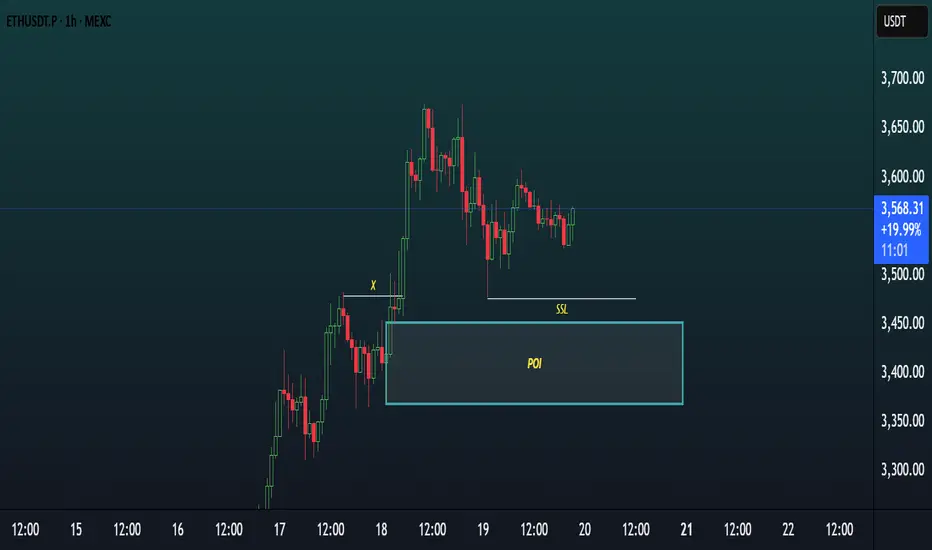
Chart Analysis (ETHUSDT, 1H)This chart showcases a Smart Money Concepts (SMC) style analysis on the 1-hour timeframe of ETHUSDT.P, focusing on a potential bullish setup.
Key Elements:
POI (Point of Interest)
A demand zone is clearly marked around the $3,400–$3,460 area, highlighted as a potential reversal zone where price may react bullishly.
SSL (Sell-Side Liquidity)
Sell-side liquidity has been swept below a recent low, indicating a possible liquidity grab before a reversal.
X (Previous Break of Structure)
Point “X” marks a significant BOS (Break of Structure) indicating bullish intent in prior price action.
Current Price Action
Price recently tapped into the POI, swept SSL, and is now consolidating slightly above the zone — suggesting accumulation or preparation for a bullish move.
Bias:
Bullish — Expecting a possible reversal or continuation to the upside after liquidity sweep and POI mitigation.
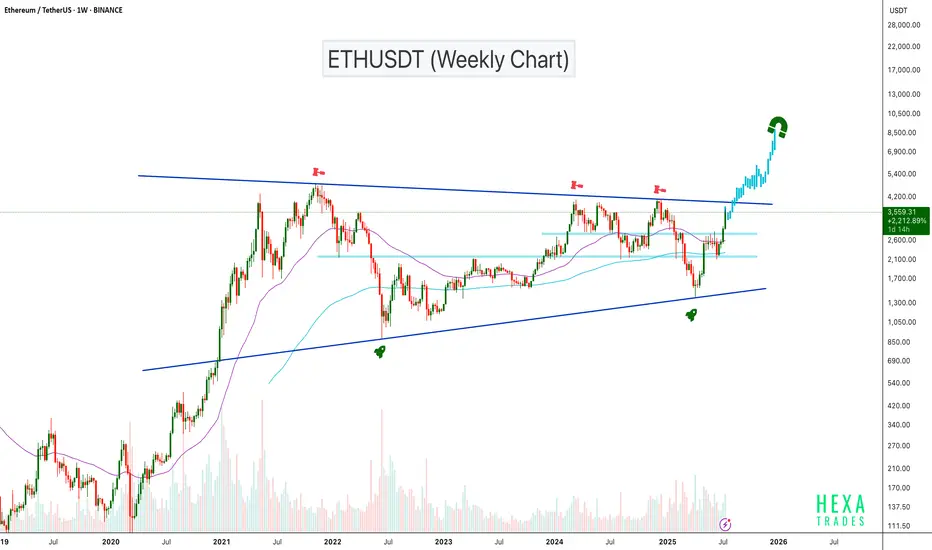
ETHUSDT Gearing Up for Explosive MoveBINANCE:ETHUSDT has been trading inside an ascending triangle pattern for the past 1,600 days. The price is now moving toward the triangle's resistance zone with strong volume support. A confirmed breakout above this resistance could trigger a powerful bullish move, with potential targets in the $6,000–$8,000 range.
Cheers
Hexa🧘♀️
BITSTAMP:ETHUSD
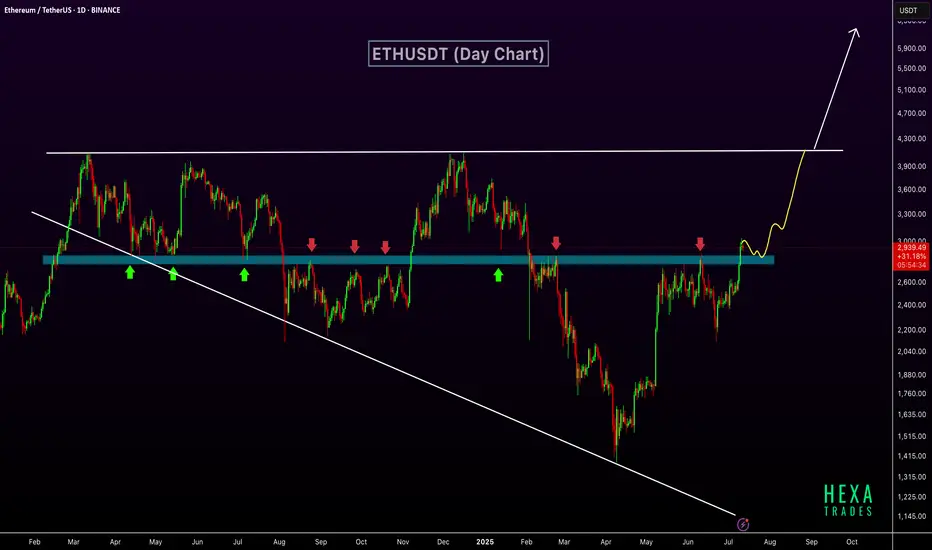
ETH Breaks Key Resistance – $6K Possible if Wedge BreaksETHUSDT has broken out above a key horizontal resistance zone that has historically acted as a strong support and resistance level. This zone, marked in blue, has seen multiple rejections and bounces over the past year, confirming its significance.
The recent breakout above this zone indicates a shift in market structure and suggests growing bullish momentum. The price action shows a clean move above resistance, with potential for a retest before continuing higher. The market is also forming a long-term broadening wedge pattern. The next target lies near the upper resistance of the wedge, around $4,000. If the price breaks above this broadening wedge, it could open the path toward the $6,000 level.
Regards
Hexa
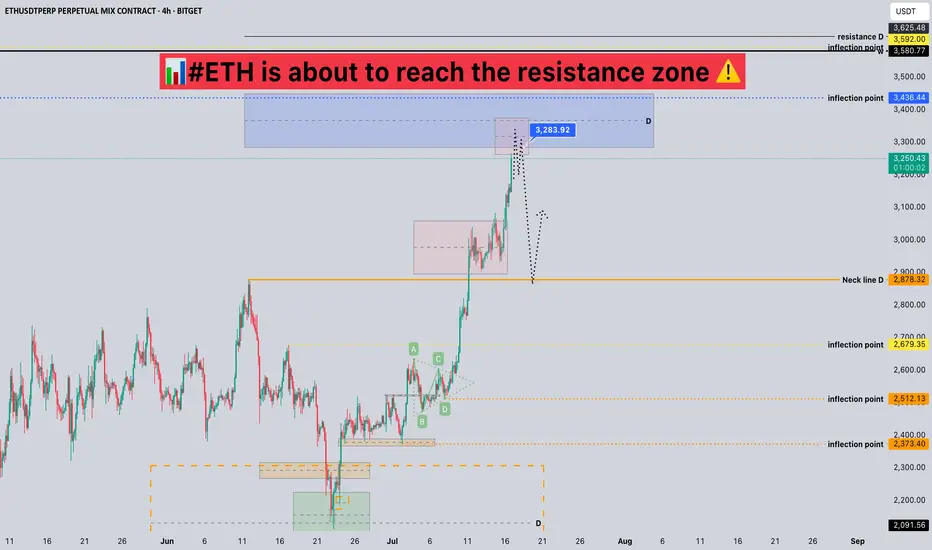
#ETH is about to reach the resistance zone 📊#ETH is about to reach the resistance zone ⚠️
🧠From a structural perspective, we are about to reach the resistance zone at the daily level, so we need to be wary of the risk of a pullback. If your cost price does not have much advantage, then please remember to lock in profits in time.
➡️New long trades need to wait patiently for a pullback to occur before participating, or the trend is relatively strong, and continue to consolidate sideways to form a new long structure to continue the long trend, otherwise we can't chase the rise near the resistance zone.
Will we start a pullback from here? Let's see 👀
🤜If you like my analysis, please like 💖 and share 💬
BITGET:ETHUSDT.P
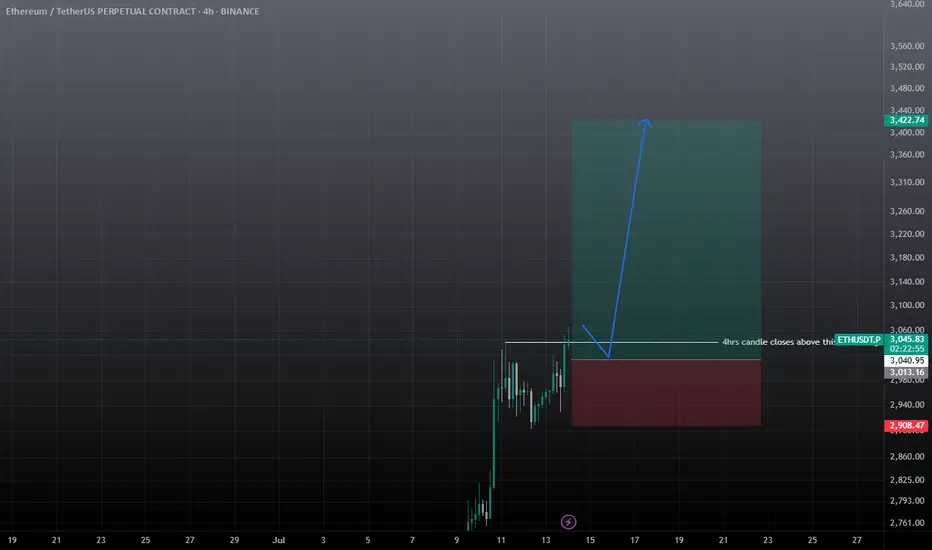
ETHUSDT BUY / Long SetupThis 4hrs candle closes above the mentioned level, then took long from 50% fib level of the fvg, and put sl below the recent swing low, I will update the trade whether it's active or not? tp towards 3.3-3.4k , while btc.d getting recked so becareful shorting any altcoin.
Ethereum Analysis – Vitalik’s Gas Cap Proposal Adds PressureToday, I want to show you the possible moves for Ethereum ( BINANCE:ETHUSDT ) this week.
Please stay with me .
Let’s first take a look at the important news that has come for Ethereum in the last 24 hours :
Ethereum’s Gas Cap Proposal Sparks Concerns
Ethereum co-founder Vitalik Buterin recently proposed EIP-7983 , introducing a gas limit cap to prevent potential DoS (Denial of Service) attacks on the network.
Bearish Takeaways:
This proposal reveals a current vulnerability in Ethereum’s infrastructure. If gas limits grow unchecked, nodes may fail to sync, leading to possible network instability.
Imposing a gas cap could temporarily reduce transaction throughput, affecting DeFi protocols and NFT platforms that rely on Ethereum’s scalability.
The market tends to react cautiously to core protocol changes, and this uncertainty could trigger short-term selling pressure.
Bullish Counterpoints:
The cap aims to strengthen the network’s long-term stability against spam and DoS attacks.
It’s still in the proposal stage, with no immediate impact on users or network performance.
Conclusion:
While the long-term impact may be positive, the short-term uncertainty and exposed risks provide a bearish narrative for Ethereum, especially amid growing competition from alternative chains.
--------------------------------------
Now let's take a look at the Ethereum chart on the 4-hour time frame .
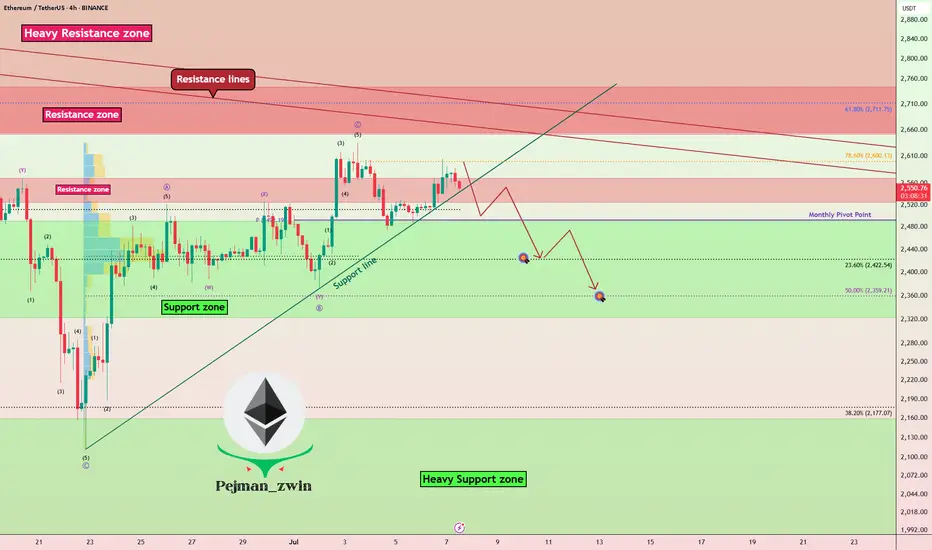
Ethereum is currently trading near the Heavy Resistance zone($2,929-$2,652) and Resistance lines , and is also trying to break the Support line .
In terms of the Elliott Wave theory , it seems that Ethereum has completed the Zigzag Correction(ABC/5-3-5) , so we can expect the next bearish wave .
I expect Ethereum to fall to at least $2,433 AFTER breaking the Support line, and if the Support zone($2,491-$2,323) is broken, we should expect further declines.
Second Target: $2,374
Note: Stop Loss (SL) = $2,689= Worst Stop Loss(SL)
Please respect each other's ideas and express them politely if you agree or disagree.
Ethereum Analyze (ETHUSDT), 4-hour time frame.
Be sure to follow the updated ideas.
Do not forget to put a Stop loss for your positions (For every position you want to open).
Please follow your strategy and updates; this is just my Idea, and I will gladly see your ideas in this post.
Please do not forget the ✅' like '✅ button 🙏😊 & Share it with your friends; thanks, and Trade safe.
#ETH Ascending Triangle📊#ETH Ascending Triangle 📉
🧠From a structural perspective, the bullish target near the neckline support area has been achieved, so there is an expectation of a pullback.
➡️From a graphical perspective, there is an ascending triangle superimposed inside the ascending wedge. Generally, we regard such models as bearish models. Therefore, with the support of multiple decline expectations, we should not chase the rise here! ! !
🤜If you like my analysis, please like 💖 and share 💬 BITGET:ETHUSDT.P

ETHUSDT Long / Buy SetupMust take from the entry and USE tight SL. Can be a fakeout, if real breakout then tps are mentioned. In case sl hit, use the previous setup, it's still valid. While for short I'm still waiting for 3k or above.

Sunday, 6 July 2025 - ETH/USDT.P ShortTrading Journal Entry: ETH/USDT SHORT
Date of Entry: July 7, 2025
Asset: ETH/USDT Perpetual Futures
Position: SHORT
Entry Price: $2,580.00
Stop Loss: $2,615.00
Take Profit: $2,510.00
Risk/Reward Ratio: 2.00:1
Setup Grade: A+
1. Core Thesis
The trade is a high-confluence short position designed to capitalize on a probable liquidity hunt below an obvious daily support level. The core thesis is that the market is incentivized to purge over-leveraged longs, whose positions are revealed by order flow data, within the context of a clear daily downtrend.
2. High-Timeframe Context (The Strategic Landscape)
My analysis began with a top-down approach to understand the broader market environment.
Weekly Context: The market is in a large-scale consolidation range. This tells us that expecting a massive, sustained trend breakout is a lower probability. Instead, trading between major support and resistance zones is the governing dynamic.
Daily Context: The immediate trend on the daily chart is bearish. Price had established a series of lower highs and lower lows, bringing it down to a major area of historical support and the Volume Profile Point of Control (POC) around the ~$2,550 zone. This created the central conflict: a bearish trend meeting a significant support level. A naive analysis would be to buy this support.
3. Order Flow & Sentiment Analysis (The Deciding Factor)
This layer of analysis was the key to resolving the trend vs. support conflict and formed the backbone of my bearish bias.
Liquidation Analysis: The liquidation maps revealed a very large and proximate pool of long liquidations clustered between $2,470 and $2,500. This liquidity acts as a powerful magnet for price, as market makers are incentivized to push price toward these zones to absorb orders.
Funding Rate Analysis: Funding rates across almost all exchanges were consistently positive. This provided clear evidence that derivative traders were predominantly positioned long, were paying a premium to maintain those longs, and were betting on the daily support holding. This identified a crowded trade.
Synthesis: The presence of a large downside liquidity target (the "magnet") combined with a vulnerable and crowded group of participants (the "fuel") created a high-probability scenario for a contrarian move. The path of least resistance was for the market to push through the "obvious" support to liquidate these longs.
4. Tactical Execution (The Entry Trigger)
With a firm directional bias, the final step was to find a low-risk entry.
4-Hour Structure: The price action at the daily support level was weak. The 4H chart showed a low-volume, sideways consolidation, not a strong bullish rejection. This lack of a decisive bounce was my first clue that the support was fragile.
1-Hour Entry Pattern: I identified the perfect entry trigger by observing the 1H chart.
Price staged a minor rally toward the $2,580 resistance level.
Crucially, this rally occurred on visibly declining volume, signaling a lack of genuine buying interest. It was a corrective, not an impulsive, move.
My entry at $2,580 was placed at a clear support-turned-resistance flip zone, allowing us to short into weakness at a favorable price.
5. Risk Management (The Trade's Foundation)
Stop Loss ($2,615): The SL was not an arbitrary price but a logical invalidation point. It was placed just above a recent 1H structural swing high. A move above this level would have proven the "weak rally" thesis incorrect and signaled that buyers had taken control.
Take Profit ($2,510): The TP was chosen for two reasons:
Rule Compliance: It mathematically secured my required 2:1 risk/reward ratio.
Strategic Placement: It sits just ahead of the psychological $2,500 level and the densest part of the liquidation pool, increasing the probability of a fill before any potential support-driven bounce.
This trade represents a textbook example of my strategy: using high-timeframe analysis to build a directional bias, confirming it with order flow and liquidity data, and executing with precision on a low-timeframe pattern, all while adhering to strict risk management rules.

ETH SWING TRADEETH Showing strong momentum against BTC, July is also good for eth and some alts, maybe we see correction in Aug, September but before expected pullback towards 2.9k-3k. Must use SL as market is very Volatile these days.

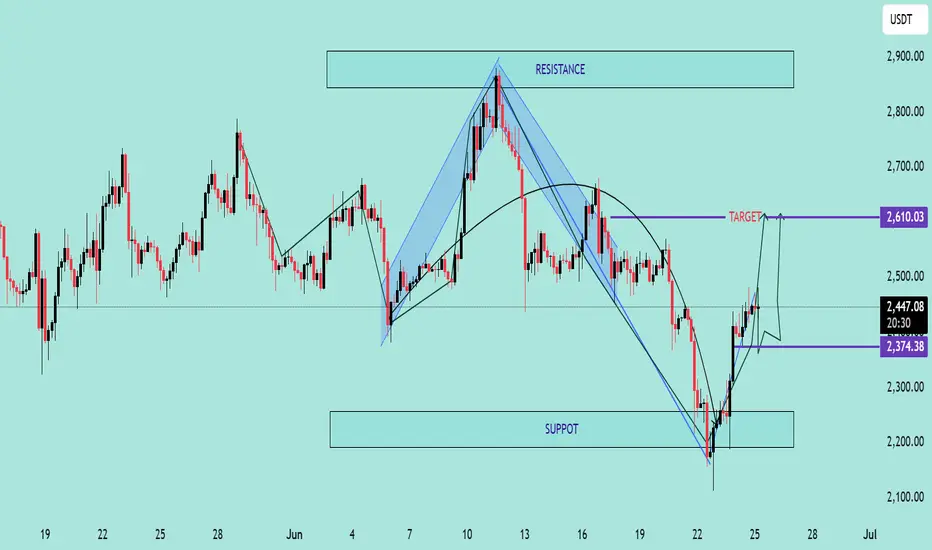
ETH/USDT Bullish Reversal Analysis Chart Overview:
Ethereum (ETH) has shown a strong bullish reversal from the support zone near $2,200, forming a V-shaped recovery pattern. The price is currently trading around $2,450, with upward momentum targeting the next key resistance level.
📌 Key Technical Highlights:
✅ Support Zone:
Clearly respected at $2,200 – $2,300 range
Multiple candle wicks suggest strong buyer interest
✅ Resistance Zone:
Major resistance expected around $2,900
Historical rejection indicates potential selling pressure
✅ Target Level:
Short-term target marked at $2,610 🟣
If momentum sustains, price could push towards this zone before facing resistance
📈 Bullish Momentum:
Strong breakout from downtrend channel
Formation of higher highs and higher lows
Price action respecting upward trend structure
🛠 Pattern Structure:
Reversal pattern after corrective phase
Bullish engulfing candles suggest continuation
📊 Forecast Path:
Two potential scenarios are outlined:
📈 A clean push to the $2,610 target, followed by consolidation
🔄 A short pullback to $2,374 before continuation to the target
⚠️ Conclusion:
ETH/USDT is showing bullish signs with potential to reach $2,610. Watch for consolidation or pullbacks as buying opportunities, but be cautious of heavy resistance above $2,900. Ideal for short- to mid-term bullish setups
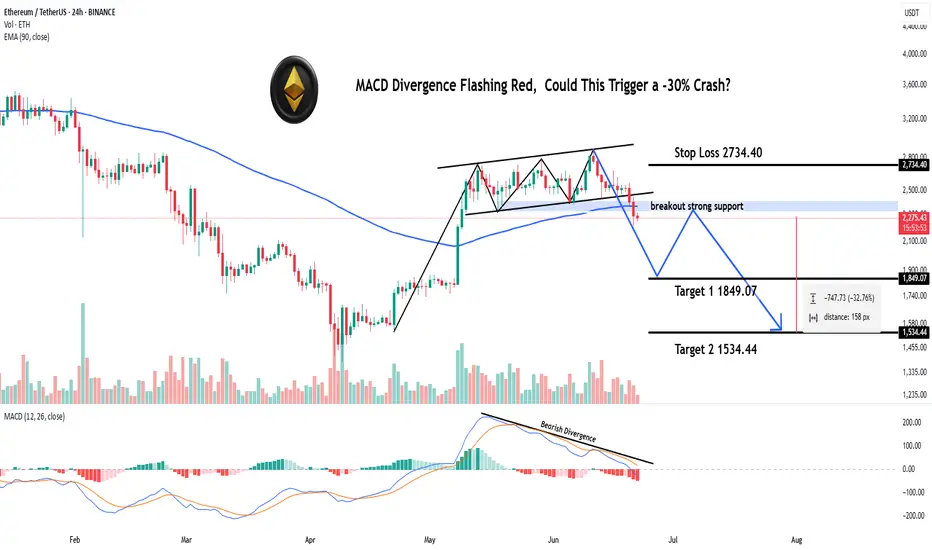
MACD Divergence Flashing Red, Could This Trigger a -30% Crash?Hey Realistic Traders!
Bearish Reversal Signal Flashing on BINANCE:ETHUSDT , Is the Bull Run Over?
Let’s Break It Down..
On the daily timeframe, Solana (SOL) has formed an ascending broadening wedge, which has now broken to the downside through both the lower trendline and a major support zone, indicating a shift in market structure.
Price action has also remained consistently below the 200-day EMA, signaling a potential transition from a bullish to a bearish trend.
A bearish divergence has appeared on the MACD indicator, where price makes higher highs while the MACD forms lower highs. This divergence indicates that buying momentum is weakening, even as the price pushes higher. Such a pattern often precedes a trend reversal and supports the expectation that the price may continue to move lower.
Given these technical signals, the price is likely to continue moving lower toward the first target at 1849.07, with a possible extension to the second target at 1534.44.
This bearish outlook remains valid as long as the price stays below the stop-loss level, currently marked at 2734.40. A move above this level would invalidate the bearish setup.
Support the channel by engaging with the content, using the rocket button, and sharing your opinions in the comments below.
Disclaimer: "Please note that this analysis is solely for educational purposes and should not be considered a recommendation to take a long or short position on ETHUSDT.
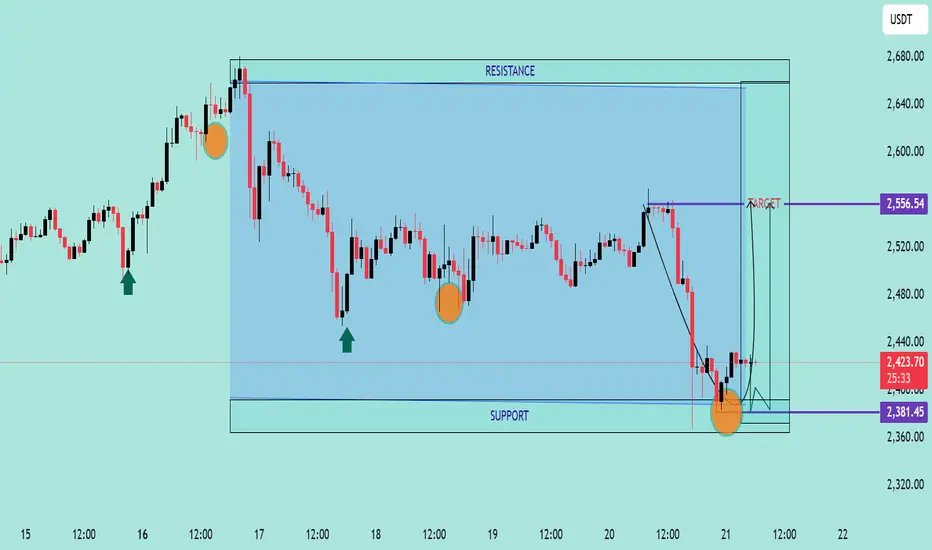
ETH/USDT Bullish Reversal from Support Zone Chart Analysis:
The chart illustrates a range-bound consolidation with clear support around $2,381.45 and resistance near $2,556.54.
🔍 Key Observations:
✅ Multiple Support Tests: Price has tested the support zone several times (highlighted by orange circles) and respected it, indicating strong buying interest at the lower boundary.
📉 Fakeout and Recovery: A false breakout below support occurred, but the candle quickly reversed, signaling a bear trap and potential for bullish momentum.
🔼 Rejection Wick & Consolidation: A strong rejection wick on the most recent candlestick shows buyers defending the zone aggressively. The current price action shows consolidation — a bullish accumulation pattern.
🎯 Upside Target: Based on the range breakout projection, the price could potentially revisit the resistance zone at $2,556.54, marked as the TARGET on the chart.
📌 Technical Outlook:
🟢 Bias: Bullish as long as the price holds above $2,381.45.
💹 Entry Idea: Aggressive buyers may enter near current levels with a stop below the wick low.
🛑 Risk Level: Tight stop-loss needed as the structure relies heavily on support holding.
📈 Conclusion:
A classic range rebound setup is forming with potential for upside movement back toward resistance. A breakout above $2,556.54 could initiate a trend continuation rally
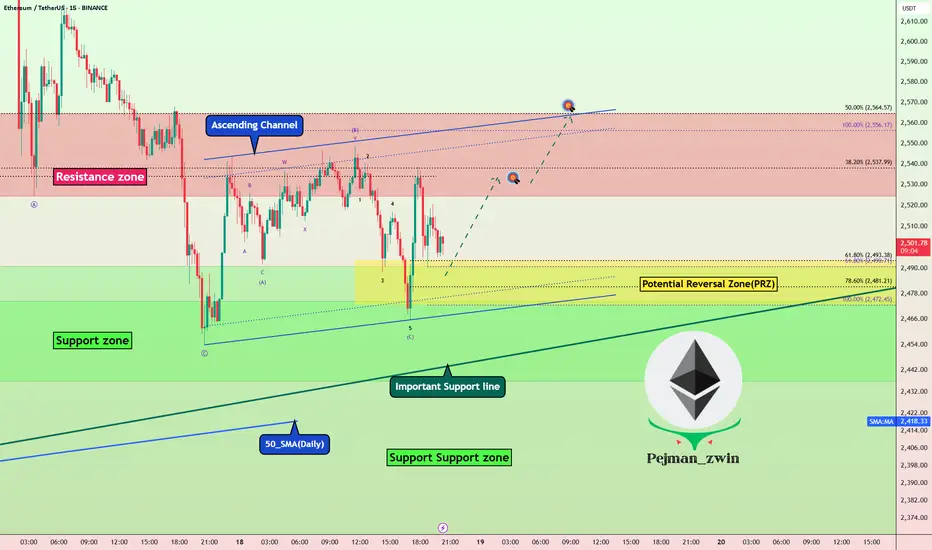
Ethereum at PRZ: Bullish Setup _ Short termEthereum ( BINANCE:ETHUSDT ) reacted from the Potential Reversal Zone (PRZ) around the confluence of key Fibonacci levels , the Important Support line and 50_SMA(Daily) .
From an Elliott Wave point of view , we can identify a Expanding Flat (ABC/3-3-5) structure ending right above the Support zone ($2,474-2,437) .
The structure also hints at the formation of a new upward leg , potentially leading ETH toward the Resistance zone ($2,564-$2,524) and the upper line of the Ascending Channel .
I expect Ethereum to test the 38.2%($2,531=First Target) - 50%($2,561) Fibonacci retracement levels on the way to a potential retest of the previous swing highs .
Note: Stop Loss (SL) = $2,451= Worst Stop Loss(SL)
Please respect each other's ideas and express them politely if you agree or disagree.
Ethereum Analyze (ETHUSDT), 15-minute time frame.
Be sure to follow the updated ideas.
Do not forget to put a Stop loss for your positions (For every position you want to open).
Please follow your strategy and updates; this is just my Idea, and I will gladly see your ideas in this post.
Please do not forget the ✅' like '✅ button 🙏😊 & Share it with your friends; thanks, and Trade safe.