ETH Price Weakens: Watching This Strong Demand Zone Closely$ETH/USDT Analysis (12H)
Ethereum has broken below a key support zone, confirming short-term weakness in price structure.
At the same time, the RSI is showing bearish divergence, signaling slowing momentum while the price was making higher highs — a classic early warning of a potential drop.
Now all eyes are on the strong demand zone below. If ETH finds support there, we could see a solid bounce or even a full trend reversal. But if this zone fails, deeper correction may follow.
DYOR, NFA
Thanks for the reading
Ethusdtshort

ETH - Bounce Zones - Nears the End for BULLSHello Fello's ☕
I'm watching Ethereum today and I believe it may be very close to the end of it's bullish cycle.
I think what could become likely is an extended altseason, where Bitcoin trades around the same price for some time, and Ethereum increases slightly. Afterwhich smaller altcoins (by marketcap) make random rallies before the beginning of a bearish cycle (which is due, see my previous BTC update).
There's an interesting channel here that previously determined bounce zones... I don't believe the channel itself will hold as much value going down, but this zone may be a likely bounce zone - around $3k.
Key bounce zones to watch include:
I'm not saying it will be this straightforward, but this image demonstrates the power of bounce zones for swing trades:
Next update will be when we've lost the first support zone.
Until then!
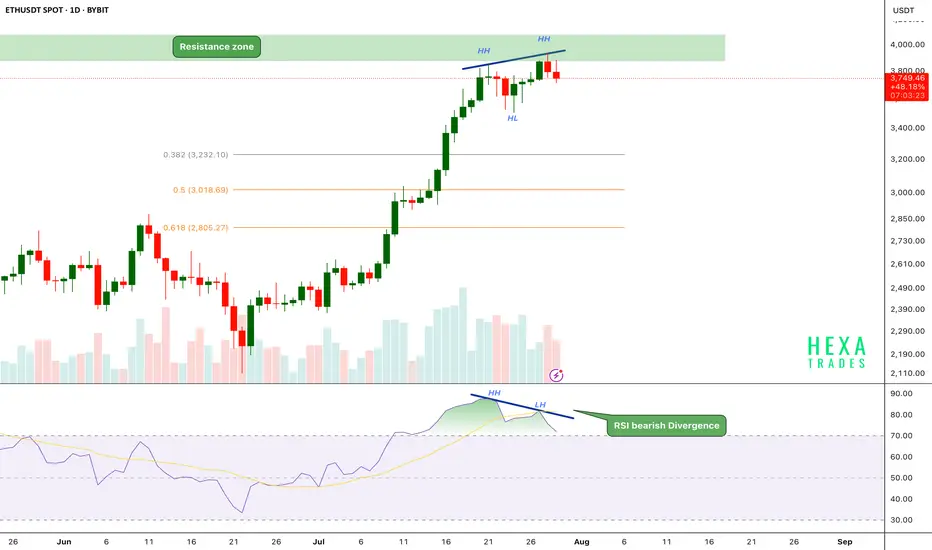
ETH Bearish Divergence!CRYPTOCAP:ETH has been in a strong uptrend, printing consistent higher highs (HH) and higher lows (HL). However, on the daily chart, the price has now reached a critical resistance zone near the $3,800–$4,000 range.
Key Points:
🔸 Bearish RSI Divergence
While price action has formed a new higher high, the RSI has printed a lower high, signaling bearish divergence.
This indicates that upward momentum is weakening even as price attempts to push higher — a common early warning of a possible short-term reversal.
🔸 Fibonacci Retracement Levels
The fib 0.382 at $3240 and 0.5 and 0.618 retracement levels are sitting around $3,000 and $2,800, respectively, potential targets if a correction follows.
🔸 Volume Profile
Volume is gradually declining as price approaches resistance, suggesting buyer exhaustion.
If the price breaks above the $4,000 psychological resistance, we could see a strong bullish move.
ETH is facing strong resistance after a powerful rally, with RSI bearish divergence and weakening momentum hinting at a possible short-term pullback. We should be cautious entering fresh longs here without confirmation.
Support: $3,200, $3,000, and $2,800
Cheers
Hexa
BINANCE:ETHUSDT BITSTAMP:ETHUSD
ETH: Will Price Continue Upwards Movement! ETH has been steadily bullish in recent times, as the crypto market experienced a significant increased a safer option to invest around the global investment community. DXY and other major currencies currently experiencing a major drawdown in prices which indirectly helping the crypto market to remain bullish. While looking at how eth has performed in recent past, we can see it creating a record high in coming weeks.

ETHUSDT Short Trade IdeaShort ETHUSDT at $3,745.22 with a target of $3,561.34.
Reason for Short: The 4-hour chart shows a symmetrical triangle pattern with resistance around $3,745-$3,800. The price is testing this upper trendline, and a recent bearish candle suggests potential rejection. The DEMA at $3,747.75 indicates overextension, supporting a pullback.
What I See: Heavy sell pressure is forming near $3,745, with the triangle nearing a breakout/breakdown point. Support lies around $3,561, aligning with prior lows.
Stop Loss: Set at $3,802, above the recent high and triangle resistance, to avoid a bullish breakout.
Trade Rationale: A breakdown from the triangle with volume confirmation could drive the price to $3,561. The tight stop above resistance minimizes risk while targeting a key support level.

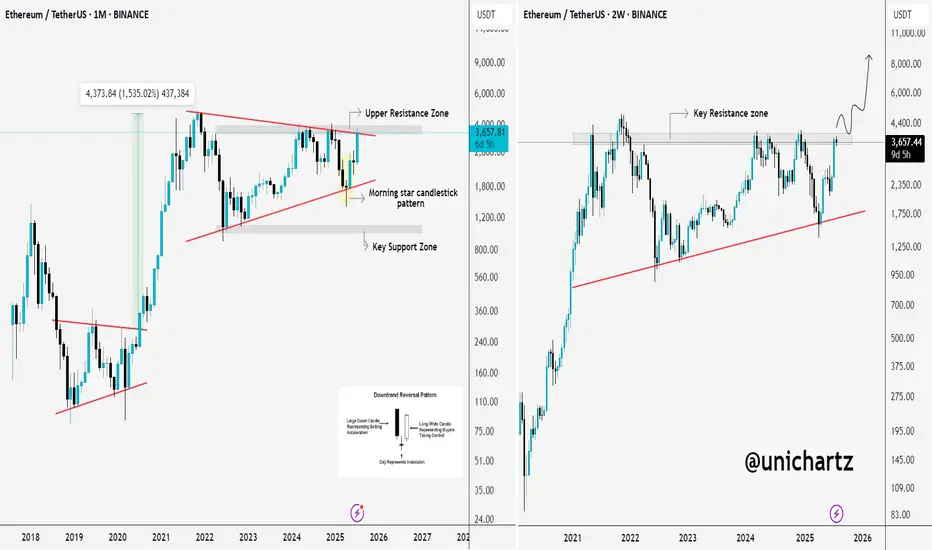
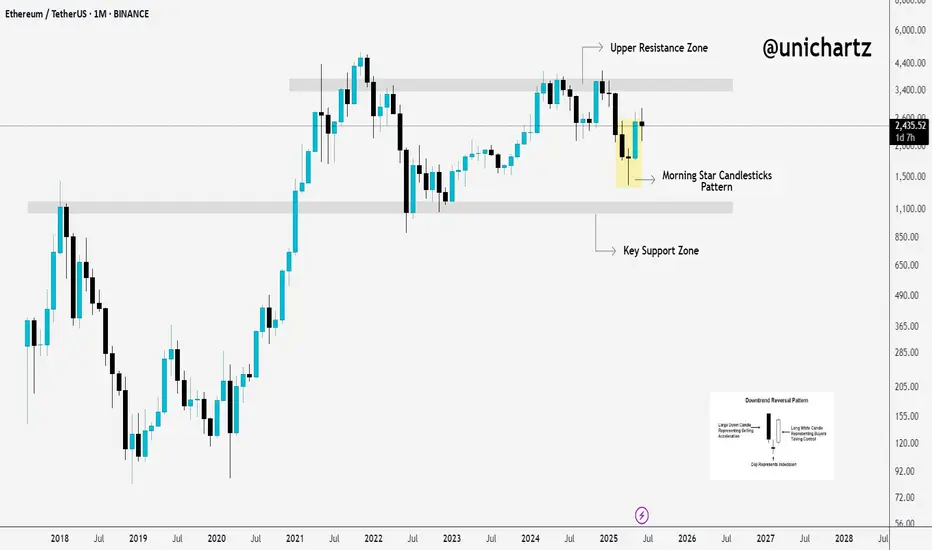
Ethereum Charts Aligning for a Major BreakoutI analyzed Ethereum on both the monthly and 2-week timeframes, and the structure looks strong.
On the right side, we have the monthly chart, where ETH has printed a bullish Morning Star pattern right off the key support trendline.
This is a classic reversal signal, and price is now approaching the upper resistance zone. A breakout from here could trigger a major rally, similar to what we saw in 2020.
On the left side, the 2-week chart shows CRYPTOCAP:ETH pressing into a critical resistance zone after a strong bounce. If price breaks and holds above this zone, it could open the doors to $6K–$8K targets in the coming months.
ETH is showing strength, now we wait for confirmation from the breakout.
Thanks for reading!
ETH Just Lost Key Support — Next Stop: $2,879?Ethereum (ETH) appears to be losing steam on the 4-hour chart as it fails to sustain above the critical $3,860 resistance level. After a strong rally, the price structure has started showing signs of exhaustion — the previous bullish momentum has clearly stalled, and ETH is now forming lower highs and lower lows. This breakdown marks a potential shift in trend, especially considering the clean rejection from $3,860 with several upper-wick rejections signaling aggressive selling pressure.
The green ascending trendline, which supported ETH throughout its recent rally, has been breached. Price has broken below the trendline and is now moving in a declining structure highlighted by the recent bearish wave. Sellers have stepped in, and the most recent candles indicate a bearish continuation setup forming just below a failed support-turned-resistance near $3,533.
There’s a visible trade setup taking shape:
• Entry: $3,530–$3,550 (post-retest of broken trend support)
• Stop-loss: $3,650 (above recent local highs)
• Target 1: $3,200 (key support level)
• Target 2: $2,879
• Target 3 (extended): $2,635 if downside pressure intensifies
This short setup offers a solid risk-reward ratio, especially if momentum accelerates below $3,500. The sell signal seen earlier aligns with this potential reversal zone, and unless ETH reclaims $3,650 with volume, the bears look likely to stay in control.
In summary, ETH on the 4H timeframe is now trading below major support, with a bearish structure, trendline breakdown, and rejection at resistance — all aligning for a short-biased move in the coming sessions. Any bullish invalidation would require ETH to push and close above $3,650 convincingly. Until then, the path of least resistance appears downward.

Altseason Starts Here? ETH Hits Critical Resistance!Ethereum has finally reached the upper resistance zone — and this could be the decisive moment for Altseason.
This level has historically acted as a major turning point for ETH. If it breaks and holds above this zone, we could see capital start flowing aggressively into altcoins.
🧠 Why it matters:
ETH reaching resistance usually signals a rotation phase from BTC to ETH.
If ETH breaks above, altcoins tend to follow with explosive momentum.
If it gets rejected, we may see a short-term cool-off.
This is the zone where narratives shift. Eyes on the breakout — or the rejection.
ETHUSD h4 next move downThe resistance at 1.36554 may be weak due to:
Multiple taps already
Reduced seller interest
A breakout above this zone could trigger short covering → sharp rally
✅ 2. Higher Low Structure
Recent low at 1.35475 held strong
Current consolidation appears like a bullish flag or accumulation range
Could indicate continuation, not rejection
✅ 3. Fakeout Reversal Setup
If price dips into the support at 1.35475 again, it might:
Trap breakout traders
Reverse and form a new impulse leg upward
Target = 1.3700–1.3750 zone
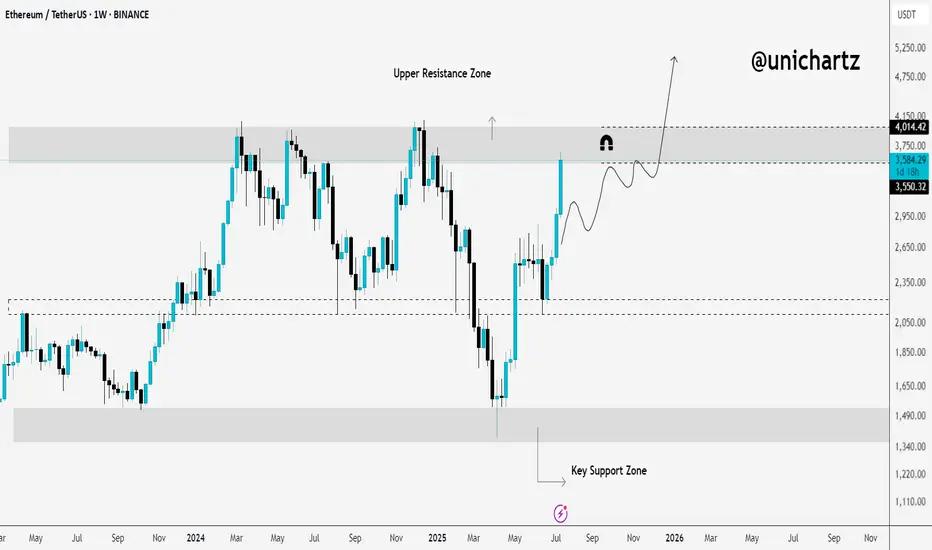
ETH Gearing Up for Lift-Off — Eyes on $4,000+ETH Weekly Outlook
ETH is currently trading around $2,660 on the weekly timeframe and holding up well at these levels.
If the momentum continues, the upper resistance zone near $3,550 could act like a magnet — pulling price higher. A breakout above this zone may trigger a strong rally toward $4,000+.
And when ETH starts to move big… altcoins usually follow.
Keep an eye on it. The next few weeks could get interesting.
DYOR, NFA

Ethereum Rebounds from Strong Base – ATH in Sight?Hello traders, here’s the CRYPTOCAP:ETH Monthly Outlook
Ethereum is flashing early signs of a bullish reversal, with a clean Morning Star candlestick pattern forming right above the $1,050–$1,200 support zone, a historically strong base.
After bouncing hard from this level, ETH is now approaching the major resistance area at $3,400–$3,800, the same zone that previously rejected upward moves.
If ETH can break and close above this resistance, we could see the start of a fresh bullish leg. But until then, this zone remains a major hurdle.
Keep an eye on the monthly close, it could confirm a shift in long-term momentum.
DYOR, NFA
Thanks for following along — stay tuned for more updates!
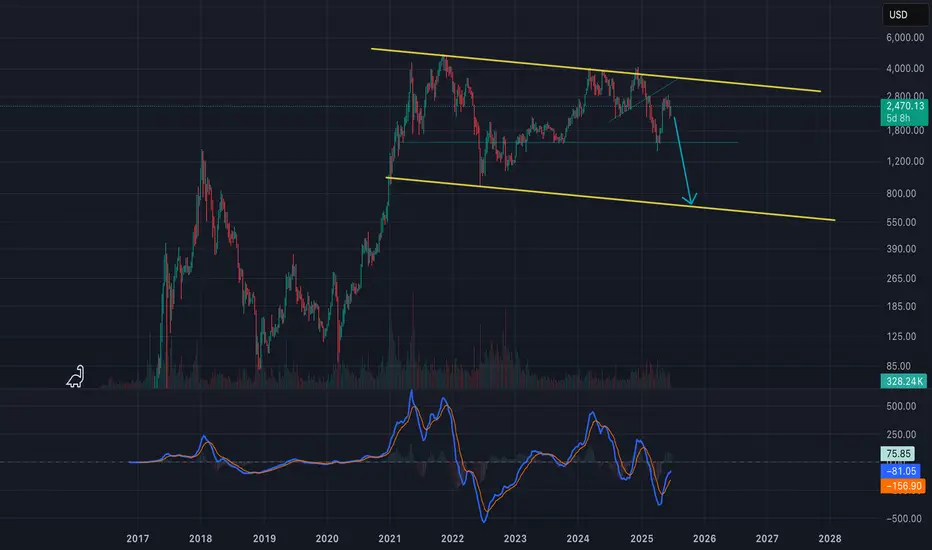
ETHUSD - Could ETH hit $800 before the next bull run?ETHUSD looks very bearish in my opinion. Strong bearish divergence on the MACD. Any substantial time ETH has stayed under the MACD zeroline has lead to very bearish price action. This price recovery is currently hitting very strong resistance area. With the Israel/Iran war looming, and the deflationary crash risks with oil dumping, I'm getting very defensive sentiment at this moment. I'll be in cash until we get further confirmation on the price action.
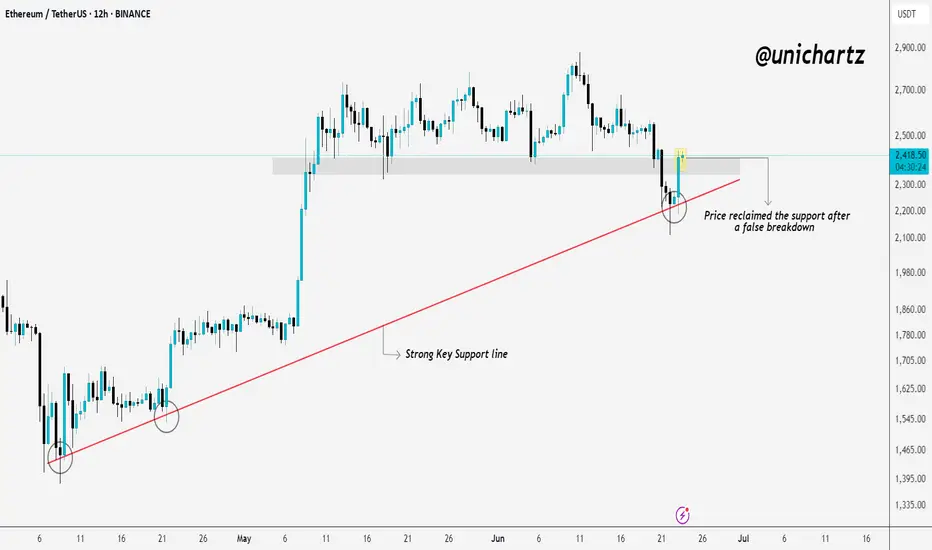
False Breakdown on ETH – Bulls Back in Control?CRYPTOCAP:ETH just pulled a classic fakeout move — breaking below a key support and rising trendline, only to snap right back above it.
This false breakdown caught the bears off guard, and now price has reclaimed the support zone with strength.
As long as ETH holds above this reclaimed level, we could see a short-term push higher. Watch for follow-through, bulls need to keep the momentum alive.
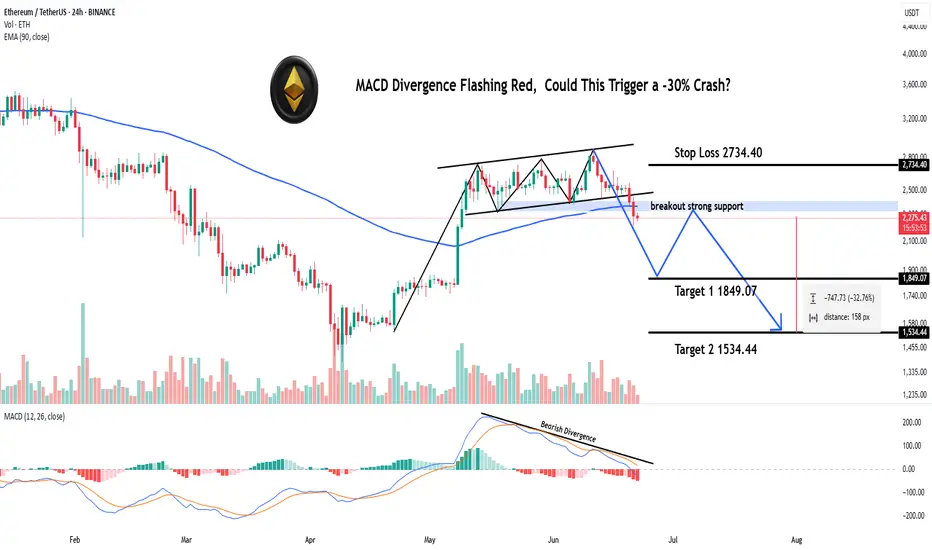
MACD Divergence Flashing Red, Could This Trigger a -30% Crash?Hey Realistic Traders!
Bearish Reversal Signal Flashing on BINANCE:ETHUSDT , Is the Bull Run Over?
Let’s Break It Down..
On the daily timeframe, Solana (SOL) has formed an ascending broadening wedge, which has now broken to the downside through both the lower trendline and a major support zone, indicating a shift in market structure.
Price action has also remained consistently below the 200-day EMA, signaling a potential transition from a bullish to a bearish trend.
A bearish divergence has appeared on the MACD indicator, where price makes higher highs while the MACD forms lower highs. This divergence indicates that buying momentum is weakening, even as the price pushes higher. Such a pattern often precedes a trend reversal and supports the expectation that the price may continue to move lower.
Given these technical signals, the price is likely to continue moving lower toward the first target at 1849.07, with a possible extension to the second target at 1534.44.
This bearish outlook remains valid as long as the price stays below the stop-loss level, currently marked at 2734.40. A move above this level would invalidate the bearish setup.
Support the channel by engaging with the content, using the rocket button, and sharing your opinions in the comments below.
Disclaimer: "Please note that this analysis is solely for educational purposes and should not be considered a recommendation to take a long or short position on ETHUSDT.
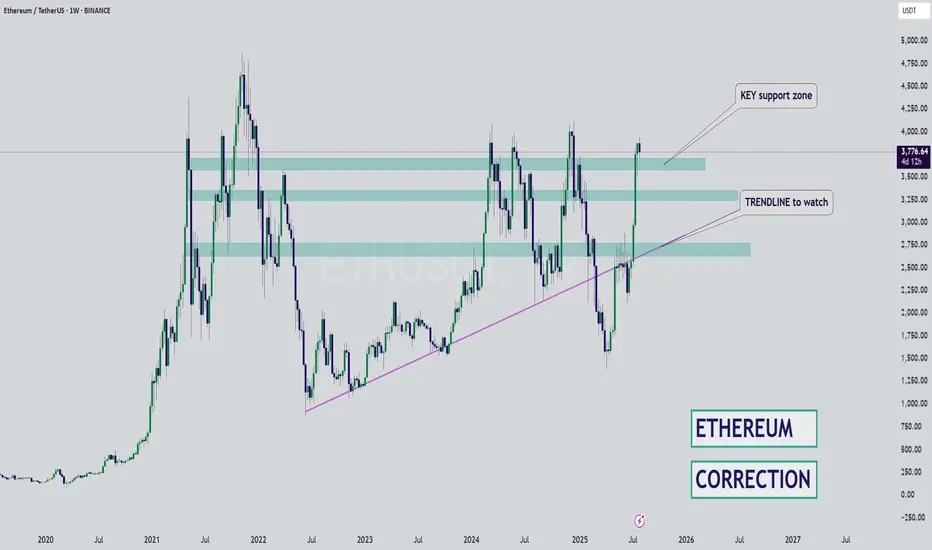
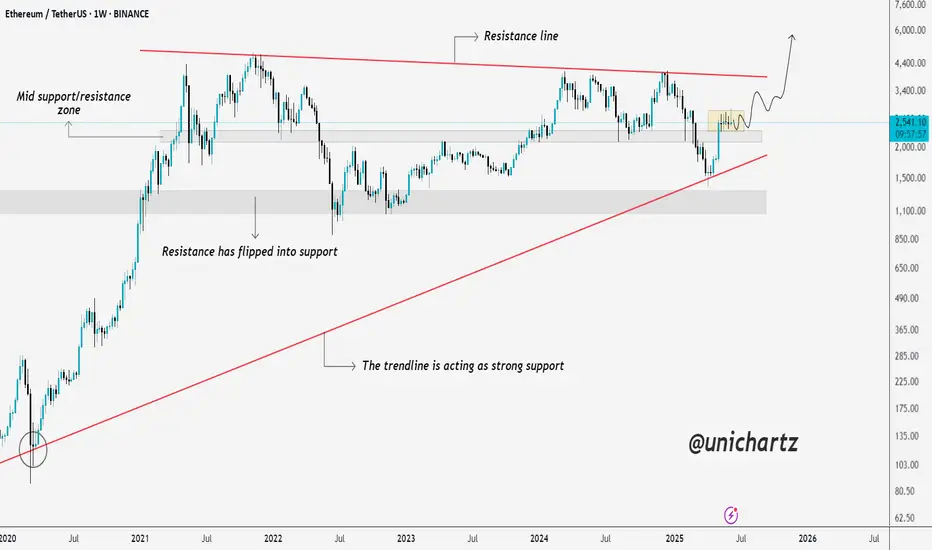
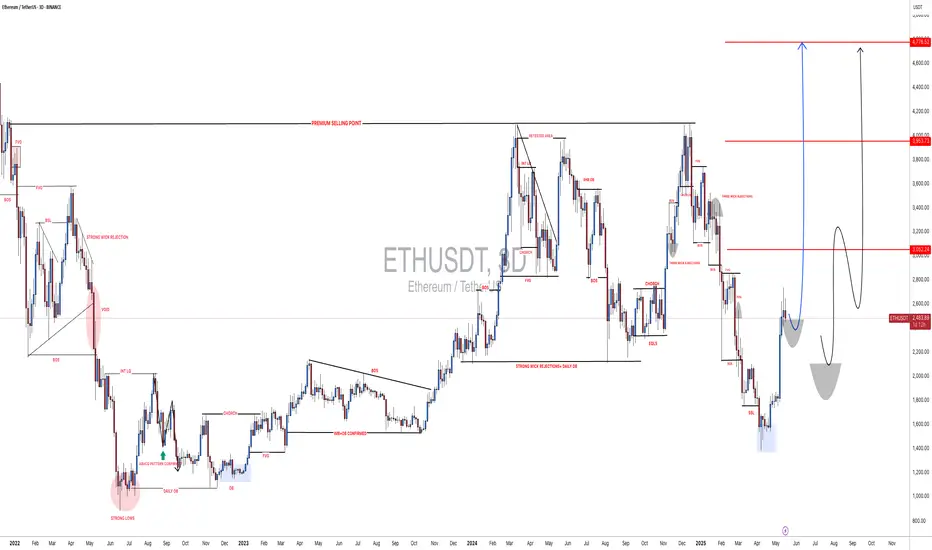
Ethereum Weekly Chart Shows Strength Above Key SupportEthereum is showing strong structure on the higher time frame. After rejecting lower levels, price has reclaimed the mid support/resistance zone, and is now consolidating just above it.
What’s key here is the long-term rising trendline, which has held beautifully since 2020 and once again acted as a springboard for the recent bounce. This kind of confluence — trendline + zone flip — adds weight to the current price structure.
If ETH maintains this zone, we could see accumulation continue, followed by a breakout toward the upper resistance line. For now, the chart leans bullish, but patience is key as consolidation plays out.
DYOR, NFA
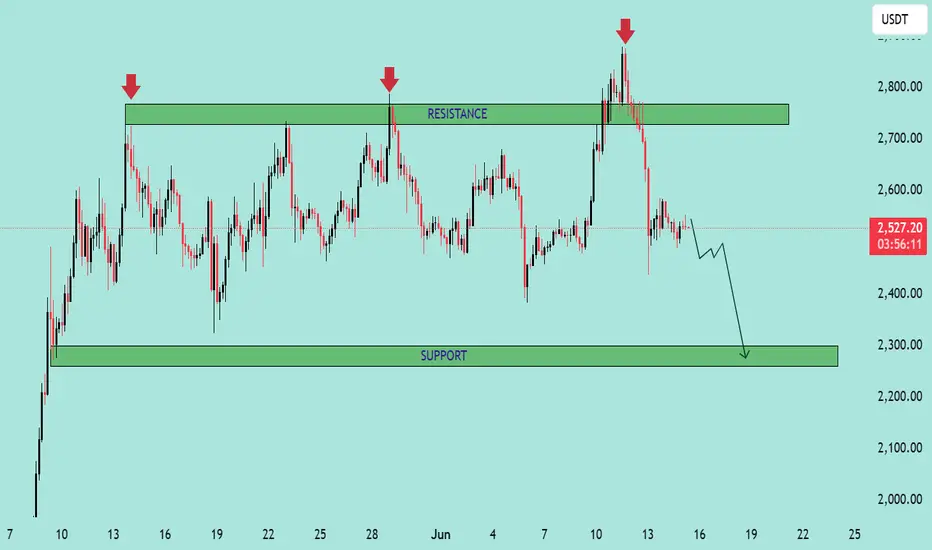
ETH/USDT – Bearish Reversal from Resistance Zone ETH/USDT – Bearish Reversal from Resistance Zone 📉
The chart above clearly illustrates a strong bearish setup on the ETH/USDT pair. Here's a professional breakdown:
📊 Technical Overview:
Resistance Zone (~2750–2850 USDT):
Marked by three distinct rejections (highlighted by red arrows).
Every attempt to break above this zone has resulted in a sharp price rejection, indicating strong selling pressure.
Current Price: 2529.69 USDT
Price has already broken below the immediate support formed after the last rejection.
The pair is now trending lower with bearish momentum.
Support Zone (~2250–2350 USDT):
This is the next major demand zone where previous accumulation took place.
The projection arrow indicates the likely path toward this area.
🔍 Price Action Insights:
Repeated failure to break resistance confirms a triple top pattern, a classic bearish reversal signal.
The recent sharp drop from the top is accompanied by strong bearish candles, showing momentum.
Minor consolidation might occur before continuation downward, as suggested by the zigzag arrow.
📉 Conclusion:
If bearish momentum sustains, ETH/USDT is likely to drop toward the 2,300 USDT support zone. A break below could open the door for even lower levels, while any bounce would need to reclaim the 2,700 USDT level to shift sentiment.
📌 Traders should watch for lower highs and bearish confirmations before entering short positions.
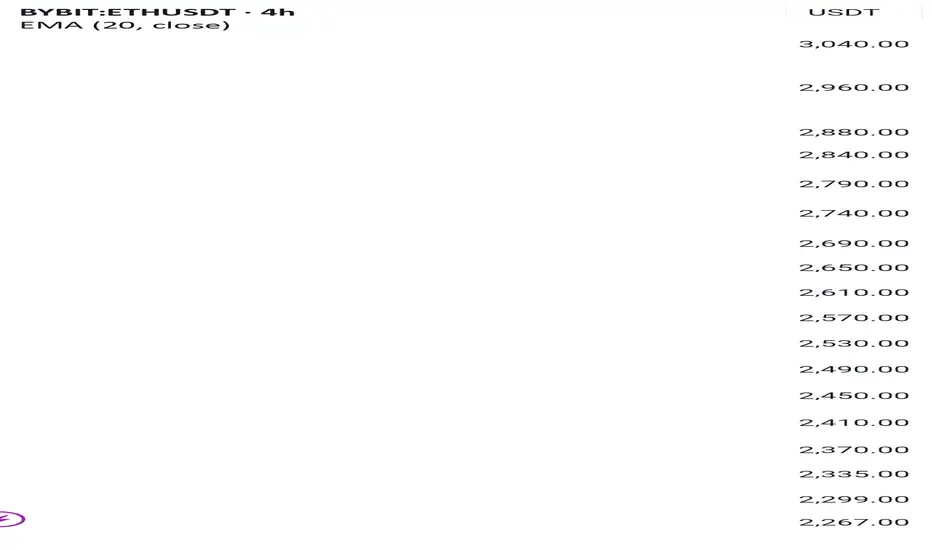
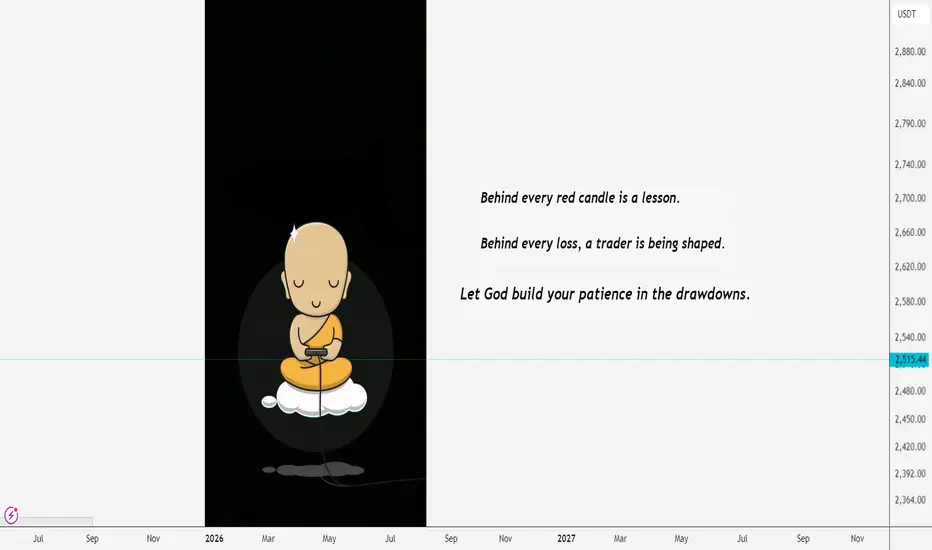
Let the Market Teach You PatienceEvery red candle has a reason. Every drawdown has a lesson.
In this journey, it's not just about profits, it's about who you become.
As traders, we don’t just manage risk, we grow through it. Let patience, discipline, and humility shape you in silence, just like the markets do.
This is the mindset behind the candles.
#PEACE
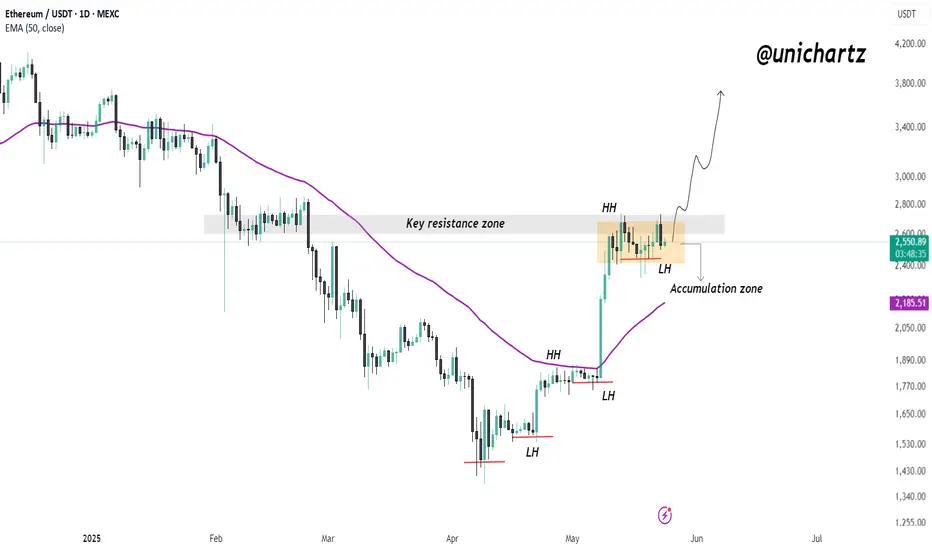
ETH Technical Structure: Bullish Bias Unless This Level BreaksEthereum is at an interesting spot.
After forming a clear bullish structure with Higher Highs (HH) and Higher Lows (HL), ETH entered an accumulation zone right below the key resistance zone.
Currently, price is retesting the 50 EMA + 100 EMA confluence zone — a critical area of demand. This level has previously acted as a strong support, and the Stoch RSI is bouncing from oversold territory, signalling possible bullish momentum ahead.
If ETH holds this accumulation zone and the EMA support, we could see another push toward the key resistance zone or even a breakout. However, if this zone fails, a deeper pullback toward lower support levels is likely.
For now, watch how price reacts here — this is a decision point.
If you liked it, do comment and follow us for regular market updates.
THANK YOU

ETH Staying Bullish – Break Above Could Target $3K+$ETH/USDT Update
ETH is moving strong, forming clear higher highs and higher lows. Right now, it’s ranging in an accumulation zone just below key resistance.
As long as it holds above the 50 EMA and recent low, the trend looks bullish. A breakout here could send it flying toward $3,000+.
Still healthy, still in play.
DYOR, NFA
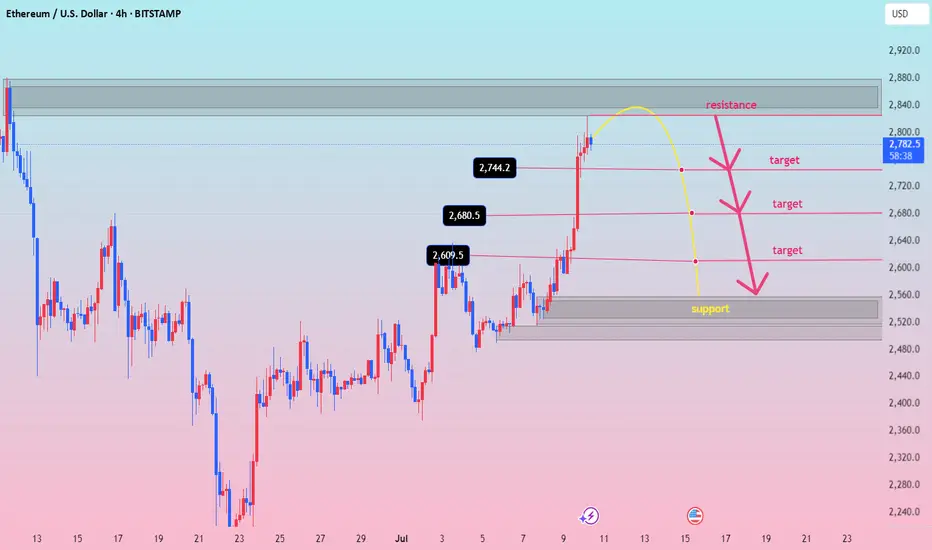
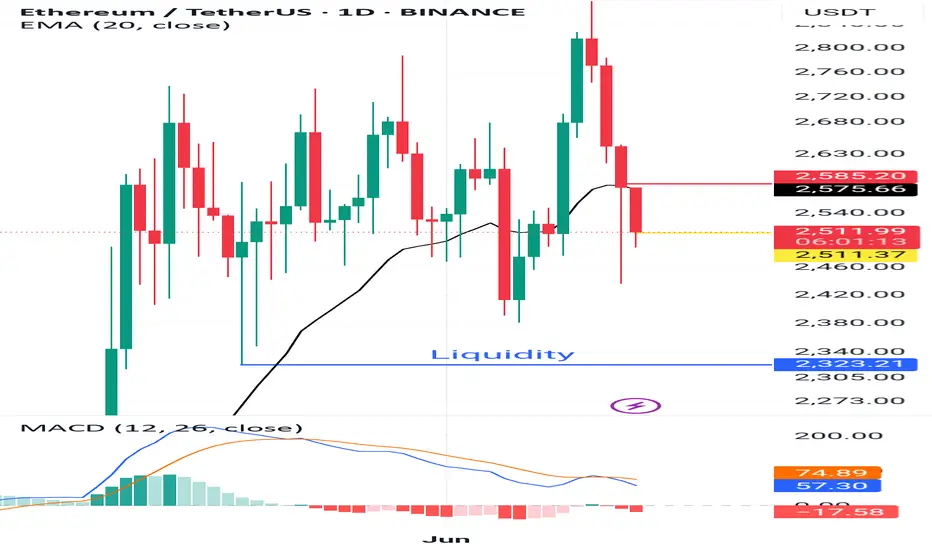
ETHUSDT: Possible Minor to Major Corrections May HappenETHUSDT has a higher chance of experiencing a minor or major correction in the coming days, although we haven’t confirmed this yet. We need more confirmation before we can be certain about the future of ETH. However, if the price decides to undergo a major correction, it’s likely to drop to our second area, where it’s expected to fill the liquidity gap and then reverse, continuing towards our three targets.
Please use this analysis as secondary bias only or even only for educational purposes. Always conduct your own analysis and risk management before trading or investing in cryptocurrencies, as they carry significant financial risk. Good luck and trade safely.
If you want to support us, you can do so by liking the idea, commenting with your views, or sharing it.
Much love ❤️
Have a great weekend
Team Setupsfx_
$ETH Cooled Off After Pump – Healthy Correction Ahead?CRYPTOCAP:ETH pumped hard and touched $2,738 but now it’s pulling back a bit.
If you look at this 6H chart, you’ll notice price didn’t really take a healthy pause on the way up.
It just went straight up.
In my opinion, a pullback toward the $2,100–$2,150 zone would actually be a good thing. That area lines up with multiple supports, EMAs, previous breakout, and trendline, so it’s strong.
This type of dip could reset the momentum and build a base for the next rally.
Stay tuned and follow for more updates!
#Ethereum #ETHUSD #ETHUSDT
