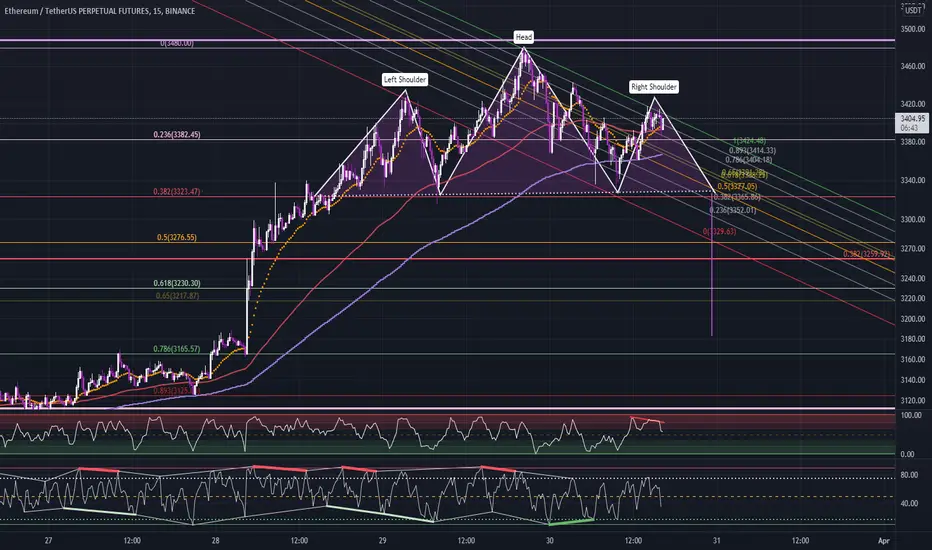
ETHUSDT Potential Short Scalp Set Up 15M Time FrameHead and shoulder formation is forming on the 15m time frame on eth.
Entry: 3300 - 3400
Targes: 3370 - 3360 - 3350 -3340 - 3320 -3310 -3300 - 3280 - 3240
SL: 3500
Ethusdtshort
#ETHUSDT 40% up already! Quick update...ETHUSDT:- Up 40% since our spot entry.
It has been a beast way better than BTC tbh.
Currently hitting the resistance.
Let's see if it can break above the daily 200MA.
For leverage trades though. you can look at the ltf charts to get entries remember we do not long the resistance.
Let me know what you think
Thank you
#PEACE
ETH/USDT SHORTER TF TRADE SETUP Hi guys, This is CryptoMojo, One of the most active trading view authors and fastest-growing communities.
Do consider following me for the latest updates and Long /Short calls on almost every exchange.
I post short mid and long-term trade setups too.
Let’s get to the chart!
I have tried my best to bring the best possible outcome in this chart, Do not consider it as financial advice.
LONG #ETH/USDT
ENTRY: 2900$ - 3000$
SELL- $3050 - $3100 - $3150 - $3200 - $3250 - $3300 - $3400 -
$3500
LEVERAGE: 5X to 10X
STOP LOSS: 2800$
This chart is likely to help you in making better trade decisions, if it did do consider upvoting this chart.
Would also love to know your charts and views in the comment section.
Thank you
ETH IS READY TO EXPLOREHi guys, This is CryptoMojo, One of the most active tradingview authors and fastest-growing communities.
Do consider following me for the latest updates and Long /Short calls on almost every exchange.
I post short mid and long term trade setups too.
Let’s get to the chart!
#ETH UPDATE
As per my previous ETH chart ETH break out this falling wedge pattern and currently, it is bouncing from the 50 ma support.
We are expecting a bounce up to the $5500 level.
If it broke the 50 ma support then the chart will be invalidated.
I have tried my best to bring the best possible outcome in this chart, Do not consider it as financial advice.
This chart is likely to help you in making better trade decisions, if it did do consider upvoting this chart.
Would also love to know your charts and views in the comment section.
Thank you

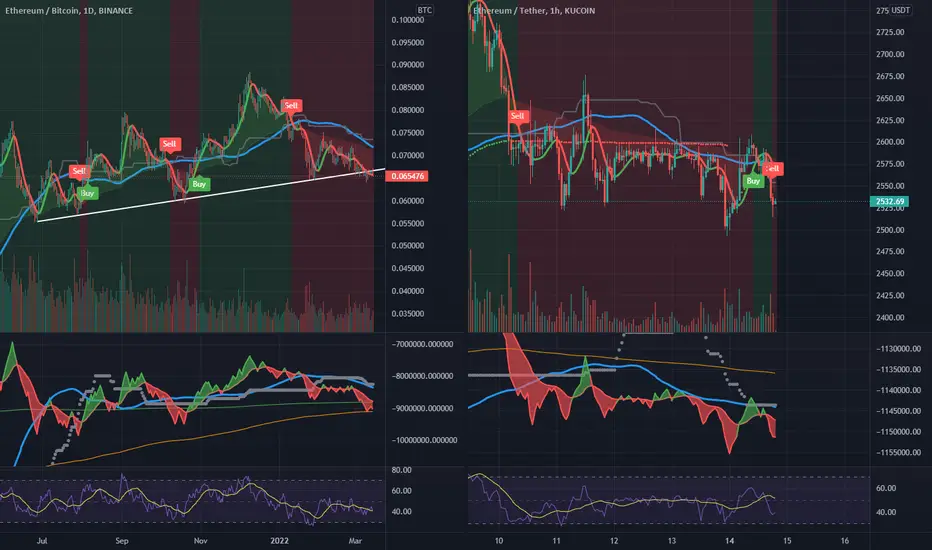
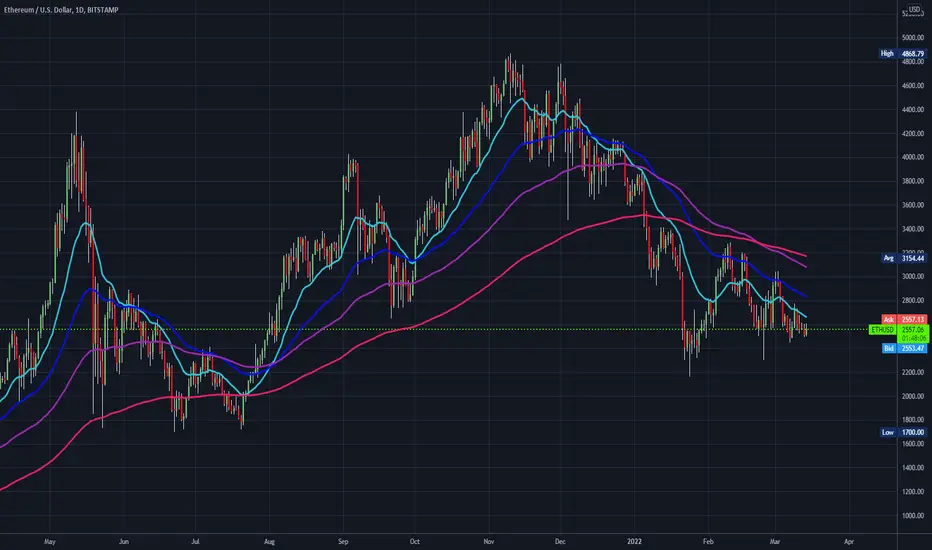
ETH SHORTETH/BTC falling out of its 9 months long trendline.
ETH/USDT Volume looks horrible and it just retested the grey + blue trendlines on the Volume Indicator.
The Blue trendline is currently around 2,572 on Kucoin for SHORT
I'm hoping for UP then DOWN
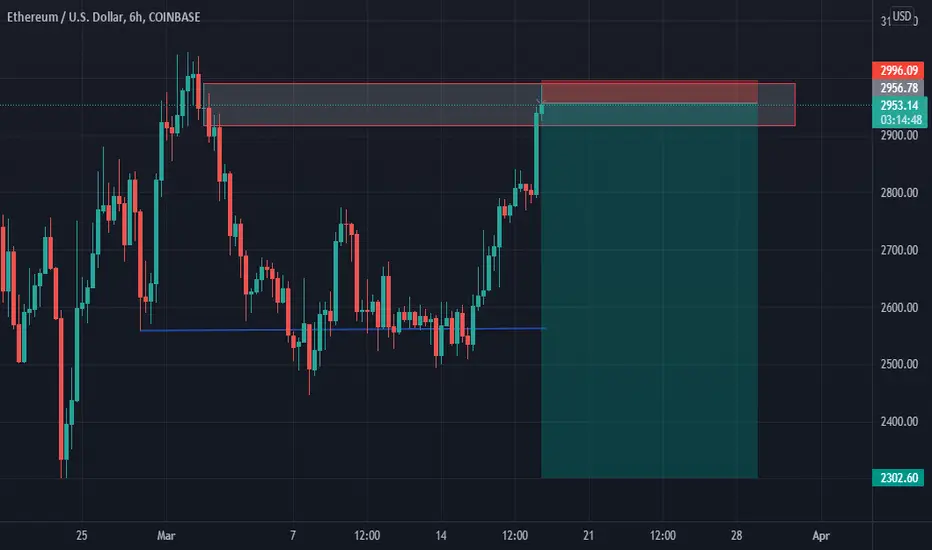
ETHEREUM SHORT ANALYSIS 19TH March 2022Yesterday we saw the price of ethereum come into our last point of supply and I was a bit unsure whether to hold the trade after taking it, coming into mid day today I saw a clear bearish Lower timeframe confirmation on the 5 mins and 1 min giving the indication that market will likely sell of from that zone and as you can see the trade is still valid and the zone has not been violated. if this trade plays outs we are most likely to see price fall from 2900 to around 2000 there by aim for the weekly key level at 1700 area. Cheers happy weekend!

ETHUSD SHORT 18TH MARCH 2022I am selling ethereum seeing a very stong supply zone where price has reacted from and looking to see this pair fall further down into 2300 price area..
ETHUSDT LONGTERMethusdt
Enter it to the entry point and then run out of sale and wait for your profits (and I think it can go down more).

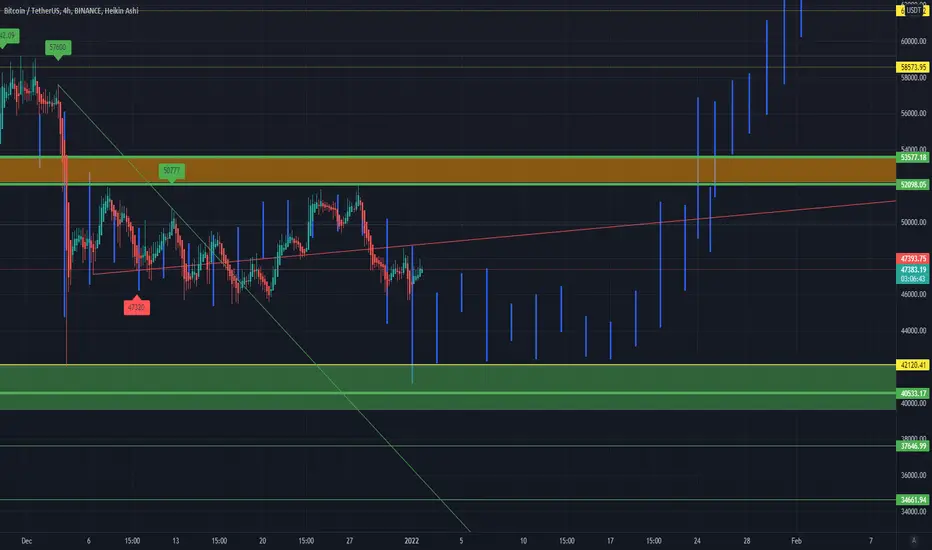
BIG SHORT - BIG BITCOIN LONG POSITIONSTOP-LOSS = 55300$
SHORT BEGIN = 51800- 48700
SHORT STOP = 42200- 41800
LONG POSITION = 41300-41500
LONG STOP-LOSS = 37300$
Everyone is waiting for 40 thousand dollars.
We certainly will not wait for 40 thousand dollars.
We will open our positions much sooner.
It is very risky. Stay away from leveraged trading.
It is definitely not investment advice. You can lose all your money.
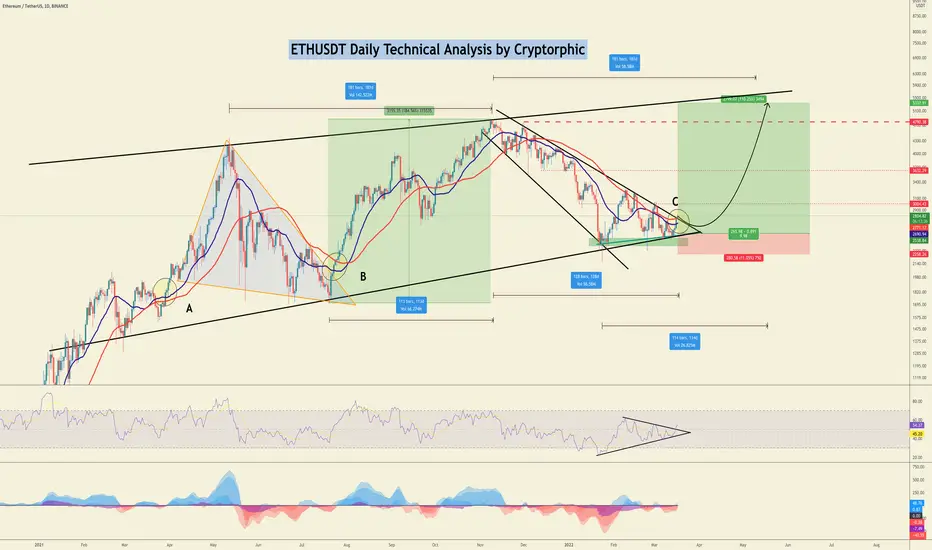
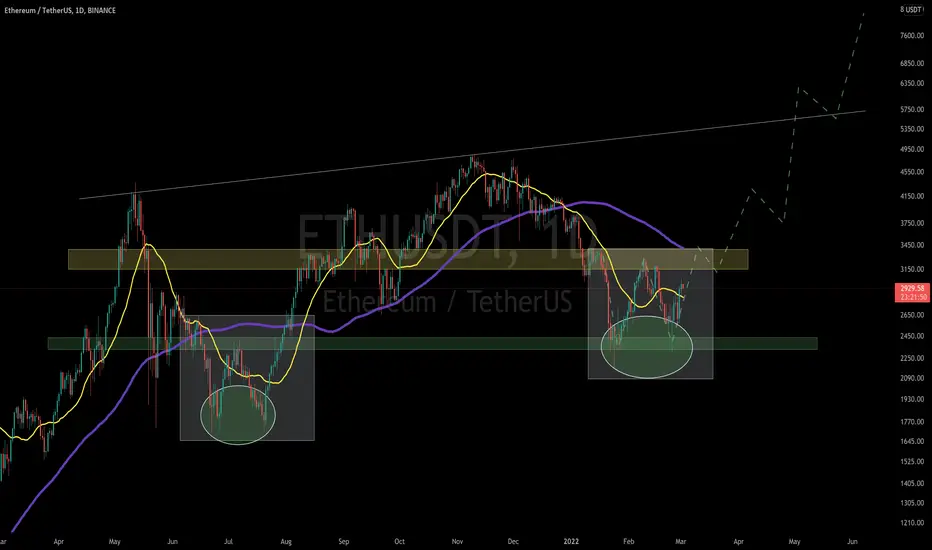
#ETHUSDT Reasons WHY ETH could reach $5k by the May 2022!!Gained 2k new followers in the last 6 weeks.
Thank you so much to all of you for your consistent support.
Now, let's get to the chart.
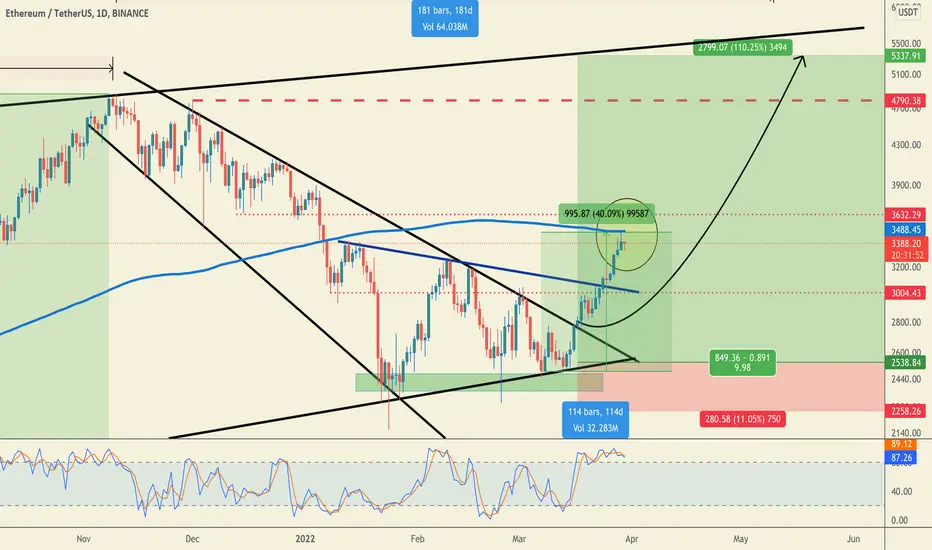
ETHUSDT is trying to break out of the channel.
A daily close above the channel would confirm the breakout.
It has been almost 128 days since the price is trading inside this falling wedge channel.
Technically a successful retest with green candle confirmation would result in a positive rally towards $3k $3.5k and even $4k.
Few conditions need to be fulfilled here:-
1. It maintains the channel resistance turned support.
2. Previous breakouts above the blue MA have resulted in a multiweek green market.
3. The blue MA needs to get above the Red MA which will be a positive sign.
4. As per fractals it could roughly reach the $5k target if the above conditions are done.
5. From possible bottom to higher target takes 114 days which gives us 3rd week of May 2022.
Do observe the chart there is more information given, do observe.
My thoughts:- I am bullish on ETH looking at the current PA but one more shakeout to trap the bears and liquidate the late longs would be the best time to enter if you don't have it yet. $2422 to $2600 is the best area to buy with an invalidation point of a daily close below $2177.
Hope it helps, if it does do hit the like button and share your views in the comment section.
Thank you
#PEACE
ETH WILL EXPLODE SOON IMOHi guys, This is CryptoMojo, One of the most active tradingview authors and fastest-growing communities.
Do consider following me for the latest updates and Long /Short calls on almost every exchange.
I post short mid and long term trade setups too.
Let’s get to the chart!
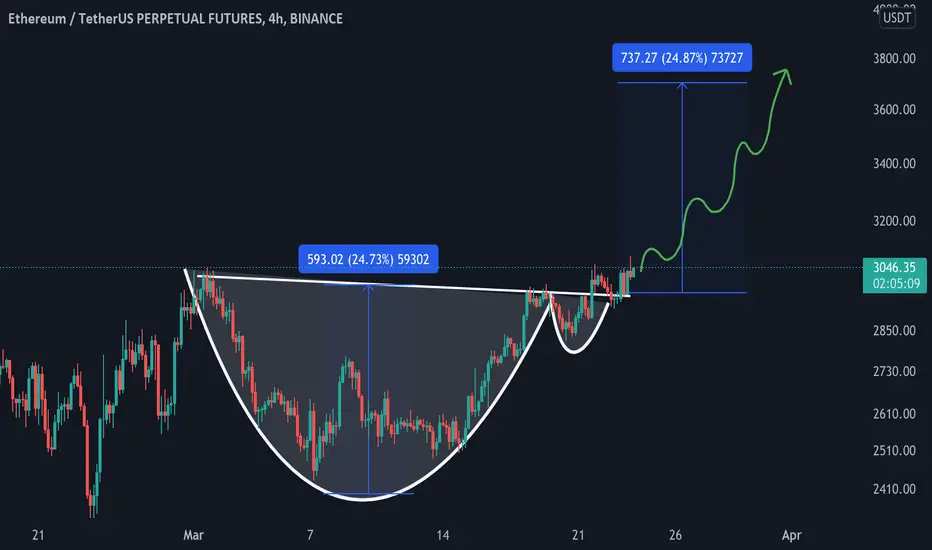
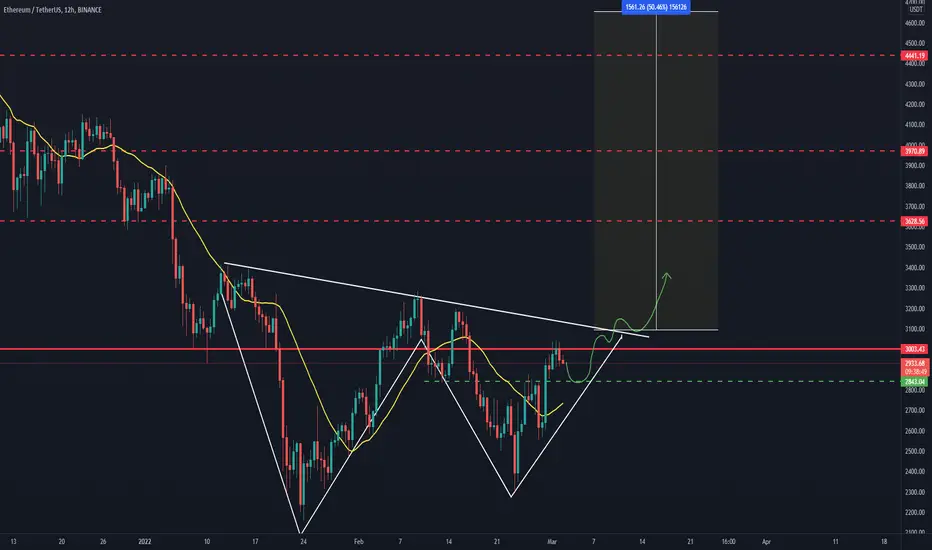
ETH is making this bullish expanding triangle pattern.
Currently, it is having upper resistance of this expanding triangle pattern if it breaks and closes upside this resistance then we can bounce up to new ATH.
Let's see how the market reacts in a few hours.
I have tried my best to bring the best possible outcome in this chart, Do not consider it as financial advice.
This chart is likely to help you in making better trade decisions, if it did do consider upvoting this chart.
Would also love to know your charts and views in the comment section.
Thank you

ETHUSD-Ethereum Forms Descending TriangleThe Ethereum market rallied initially on Friday but gave back the gains to show somewhat weak price action. The $2500 level underneath continues to be important, and I think it will offer a significant amount of support. I fully anticipate that the market may test that region in order to see whether or not it can break down below it. That is a region of support that I think extends down to the $2400 level, so it is going to take a significant amount of work to break down through there.
With that being said, it does not necessarily mean that we cannot do it, just that it may take some effort. The market has been a bit of a mess for a while, and we recently had that “death cross”, when the 50-day EMA crosses below the 200-day EMA. The indicator tends to be a little bit late, but it is something that will attract a certain amount of attention anyway.
On the upside, if we were to break above the $2750 level, it could open up a move towards the $3000 level. Breaking above the $3000 level then could be up significant signal to start going long. In general, this is a market that I think is going to continue to struggle and I am starting to believe that we are going to go into a “crypto winter”, which is when markets do very little and simply grind sideways for what seems like a lifetime. This is generally after a massive selloff, and that is most certainly something that we have seen around the crypto markets.
Ethereum is plagued at the moment by a delay in the so-called “Ethereum 2.0” release. People are starting to get a little bit impatient, but the fact that we have a tight monetary policy in the United States does no favors either. After all, the crypto markets are far out on the risk appetite spectrum, so it is going to take a very loose monetary policy to make that attract as much trading capital as it would from institutions over the last couple of years. In general, you can also make an argument that we are forming a descending triangle still, and if we break down below the support level, we could very well slice through the $2000 level eventually.
Will ETH be able to break the 3k resistance? Hi guys, This is CryptoMojo, One of the most active trading view authors and fastest-growing communities.
Do consider following me for the latest updates and Long /Short calls on almost every exchange.
I post short mid and long-term trade setups too
Let’s get to the chart!
I have tried my best to bring the best possible outcome in this chart, Do not consider it as an
ETH is making this symmetrical triangle pattern .
Currently, it is lying on the downer support line of this symmetrical triangle or we have 21ma as local resistance and
RSI is showing some bullish diversion.
let's see price can break the ma or not.
This chart is likely to help you in making better trade decisions, if it did do consider upvoting this chart.
Would also love to know your charts and views in the comment section.
Thank you

ARE YOU READY FOR SELL? ETHUSDTARE YOU READY FOR SELL? ETHUSDT
He is expected to touch the line because he will know how to go down
SELL ETHUSDT SELL NOW TO TAKE YOU PROFIT I'M SURE FOR THAT

ETH IS READY TO GO FOR NEW ATHHi guys, This is CryptoMojo, One of the most active trading view authors and fastest-growing communities.
Do consider following me for the latest updates and Long /Short calls on almost every exchange.
I post short mid and long-term trade setups too
Let’s get to the chart!
I have tried my best to bring the best possible outcome in this chart, Do not consider it as an
ETH is making this symmetrical triangle pattern.
Currently, it is lying on the downer support line of this symmetrical triangle or we have 21ma as local resistance and
RSI is showing some bullish diversion.
let's see price can break the ma or not.
This chart is likely to help you in making better trade decisions, if it did do consider upvoting this chart.
Would also love to know your charts and views in the comment section.
Thank you

ETH/USDT 4HOUR UPDATE BY CRYPTOSANDERSWelcome to this quick ETH/USDT analysis.
I have tried my best to bring the best possible outcome in this chart.
ETH/USDT looks bullish and as I told in bitcoin that bitcoin can bounce if bitcoin bounces then ETH/USDT can also bounce from here as well as old coin of USDT pair can also be pumped. eth/usdt support $2440k-$2500k and resistance $2670k-$2720k
Sorry for my English it is not my native language.
Do hit the like button if you like it and share your charts in the comments section.
Thank you.

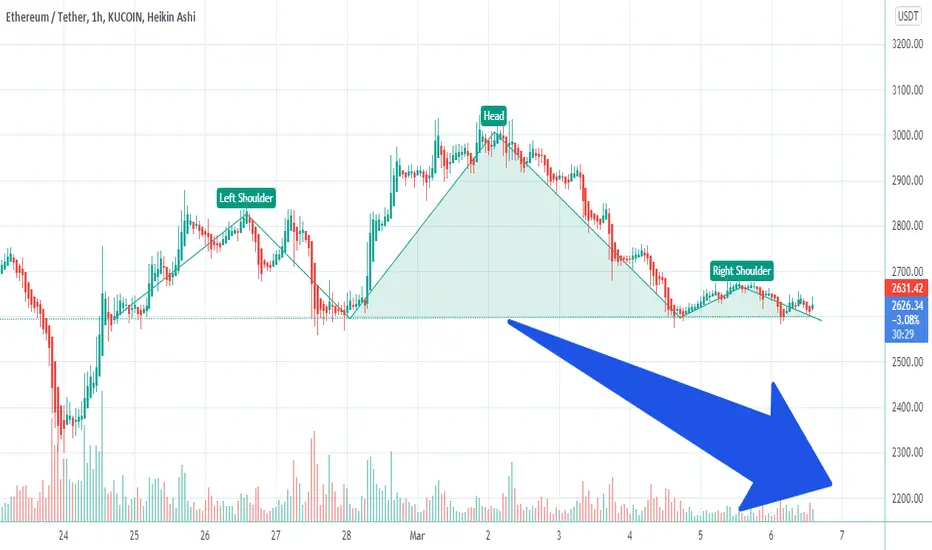
EthusdtI think this is another head and shoulders again in 1hour for ether if it break 2597 $.
You have 3 option
1. You can sell ethusdt in 2600 and buy that in 2200$ in futures .
2. you can buy ethdown in binance or eth3s in kucoin.
3. You can wait for buying eth in 2200 $.
ETH/USDT 4HOUR UPDATE BY CRYPTOSANDERSWelcome to this quick ETH/USDT analysis.
I have tried my best to bring the best possible outcome in this chart.
ETH/USDT look bullish and as I told in bitcoin that bitcoin can bounce if bitcoin bounces then ETH/USDT can also bounce from here as well as old coin of USDT pair can also be pumped. eth/usdt sopprot $2667k-$2728k and resistance $2899k-$2960k
Remember:-This is not a piece of financial advice. All investment made by me is under my own risk and I am held responsible for my own profit and losses. So, do your own research before investing in this trade.
Happy trading.
Sorry for my English it is not my native language.
Do hit the like button if you like it and share your charts in the comments section.

ETH/USDT 12 HOURS UPDATE Hi guys, This is CryptoMojo, One of the most active trading view authors and fastest-growing communities.
Do consider following me for the latest updates and Long /Short calls on almost every exchange.
I post short mid and long-term trade setups too.
Let’s get to the chart!
ETH is making this higher low w pattern but it has not yet been confirmed. it got rejected from the $3000 level or it can come around the $3800 support level.
Let's see price can hold this level or not.
I have tried my best to bring the best possible outcome in this chart, Do not consider it as an
This chart is likely to help you in making better trade decisions, if it did do consider upvoting this chart.
Would also love to know your charts and views in the comment section.
Thank you
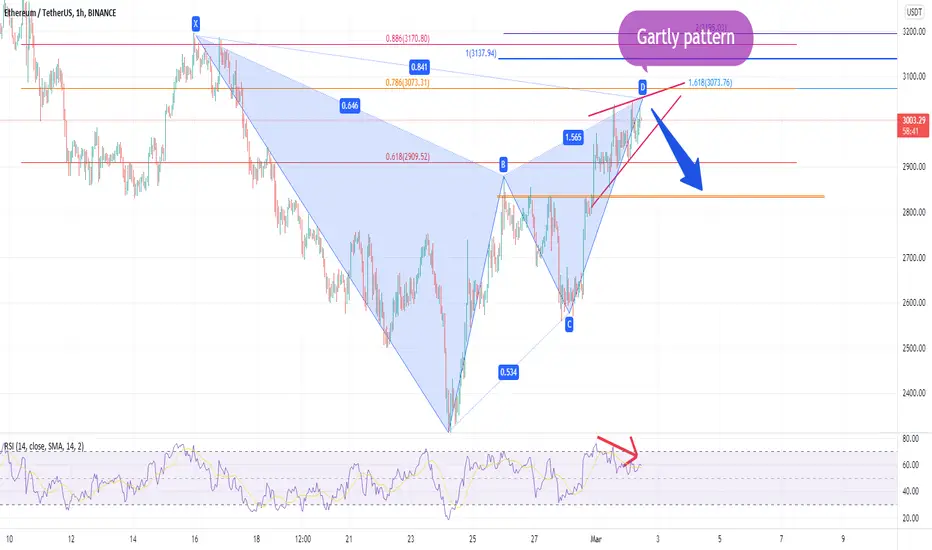
ETHUSDT is about to fallYou can see a Gartly pattern is about happen in the 1H chart therefore we can expect Ethereum to fall down to lower prices.
There is also a divergence between the Price and RSI indicator at the moment so we can expect that ETH will move down at least to the previous level which is shown in the chart.
.
What do you think about ETH?
ETH/USDT 1DAY UPDATE BY CRYPTOSANDERSWelcome to this quick ETH/USDT 1 day analysis in the chart
I have tried my best to bring the best possible outcome in this chart.
hello folks
Looking at eth/USDT it looks like the bubble top pattern created earlier may bounce back to the first double top so I can go to $3161k and $3418k from here and back to $3100k for a retest. bounce back as $5500k,
This is not a piece of financial advice.
Sorry for my English it is not my native language.
Do hit the like button if you like it and share your charts in the comments section.
thank you.
ETHUSDTGood time to go long in ETHUSDT.
Broke the trendline, easy target of 250+ points.
Trade safe. Manage risk. Be profitable.
Please follow us for more simple trading analysis and setups. Also let me know in the comment in case you have any queries.
Disclaimer :- This is just my view. Please analyze charts yourself and then decide to take any trades.
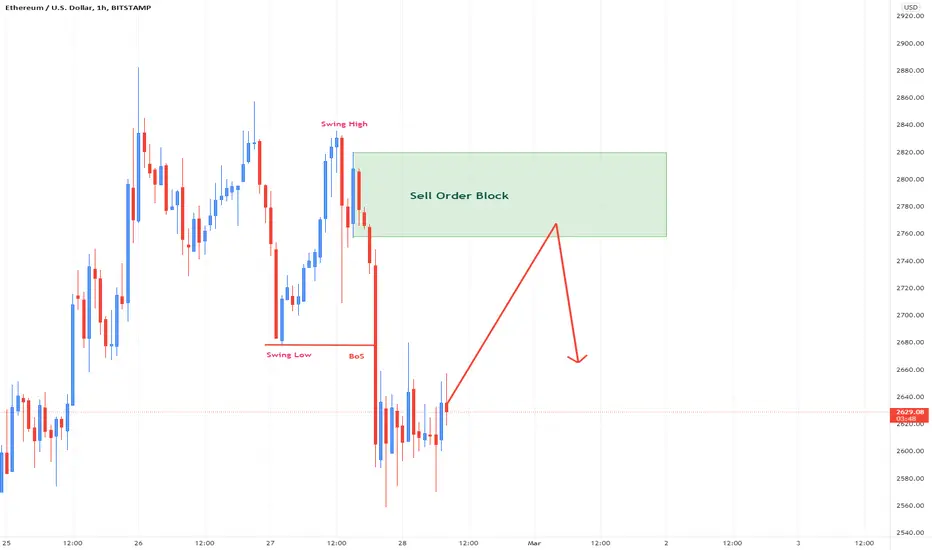
ETHUSD Chart H1Here is my view for ETHUSD on H1. The price should go down, you can put a pending order on the Order block or find an entry on LTF within OB Zone. Trade Safe!