ETH.12h. Having kept $362, sellers will continue to fall to $250We continue our series of ideas dedicated to the target $250.
The level $363 , which was support for a long time, has now become resistance . If in the coming days the Ether price does NOT fix above $362, then Ether will continue to fall to $250.
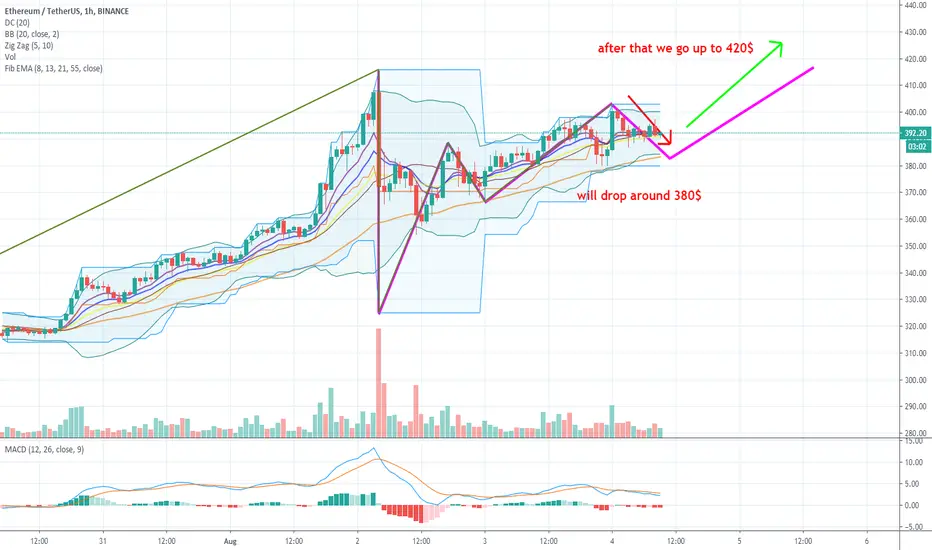
In the previous idea, we said buyers had a chance to test $425. However, despite the great support of this coin from the DeFi projects, the price was unable to fix above $388. But our first global target has not changed.
Alternative scenario . To reverse current situation, buyers need only to fix above $362. In this case, we will update the idea and consider the targrets from above in more detail. So far they have been set roughly.
Like and subscribe to us to be aware of all the ideas updates.
Ethusdtshort

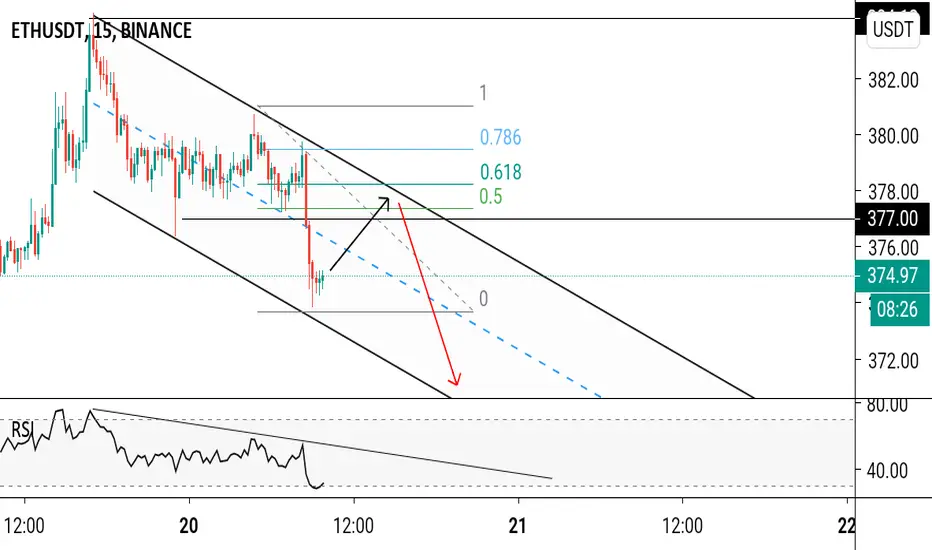
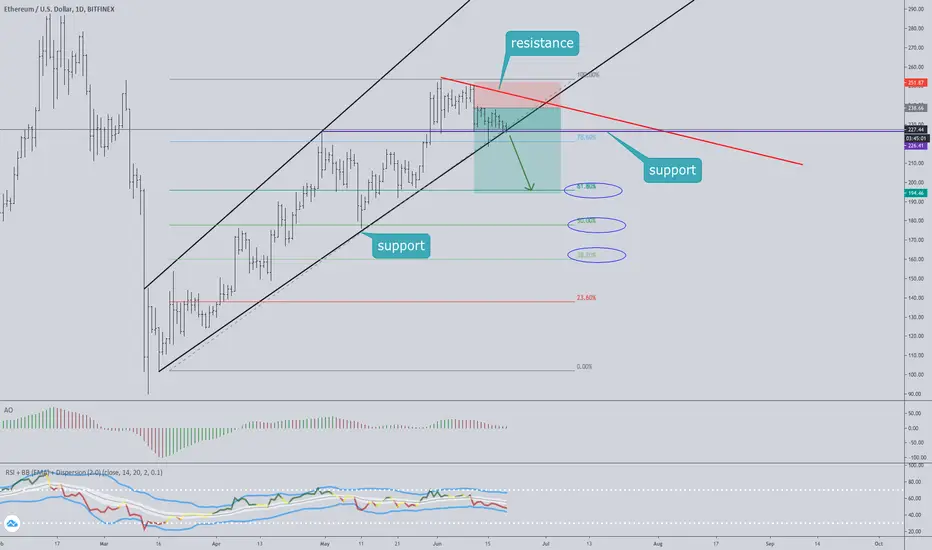
ETHUSDTPotential SELL re-entry at bounce off download channel resistance + fibonacci retracement levels ↘️.
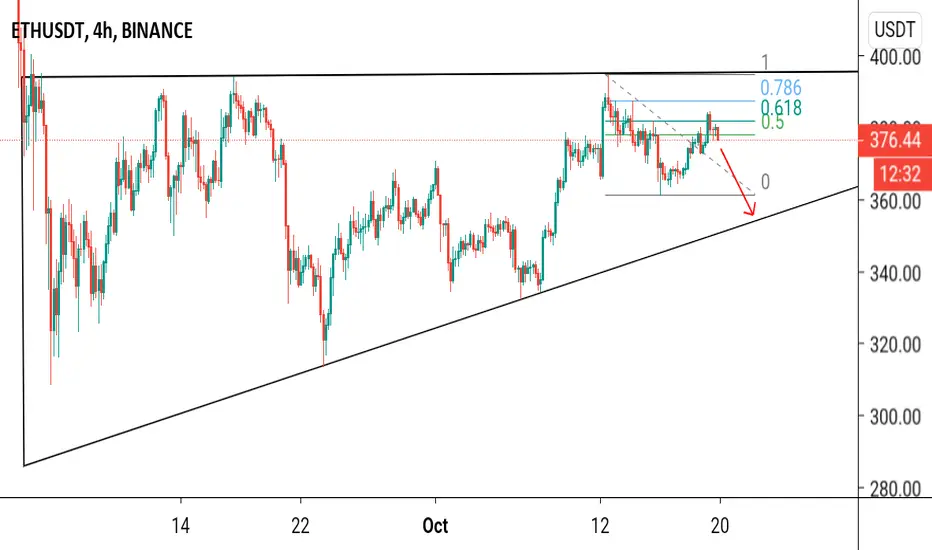

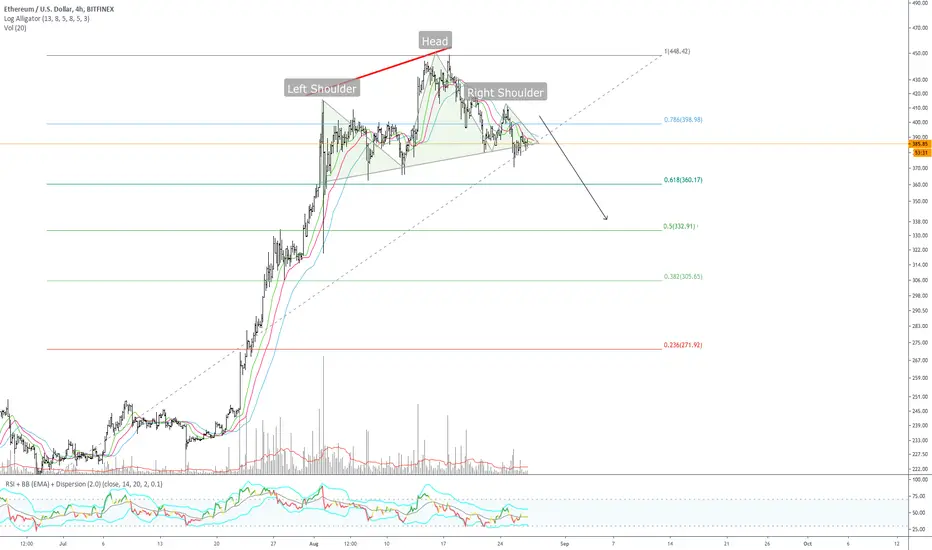
ETHUSD 4H-TIMEFRAME ANALYSISETHUSD 4H-TIMEFRAME ANALYSIS
Hello ladies and gentlemen
This is my new idea for Etherum
My idea is that ETH In the short term, it will continue to decline
Real support is between 250 and 240 It would be good to test it (the goal of breaking the wedge)
I hope my idea is clear
Support me by like and share
Good luck


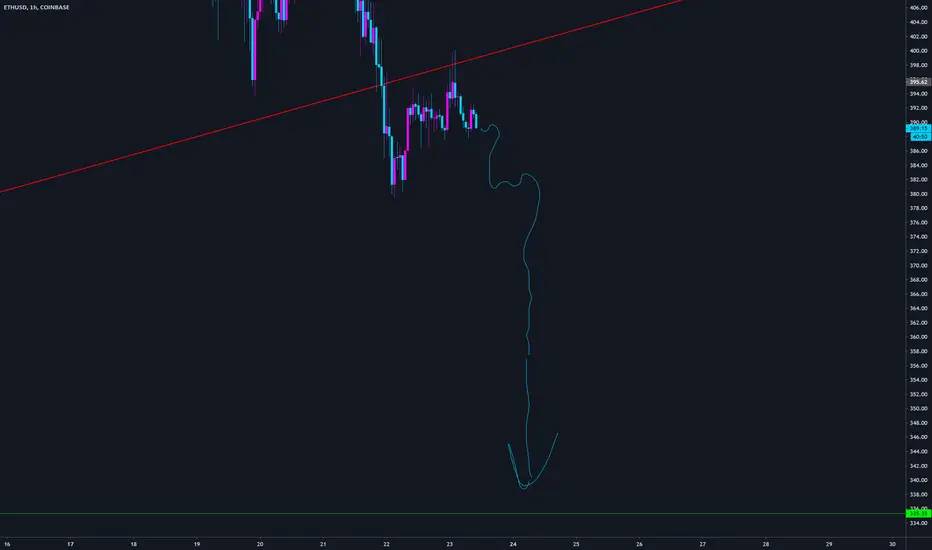
ETH/USD - up trust The world does not give this pattern.
Only after its cancellation will go long.
And now I do not believe in growth.
There was no Aptrast yet.
I trade only on futures.
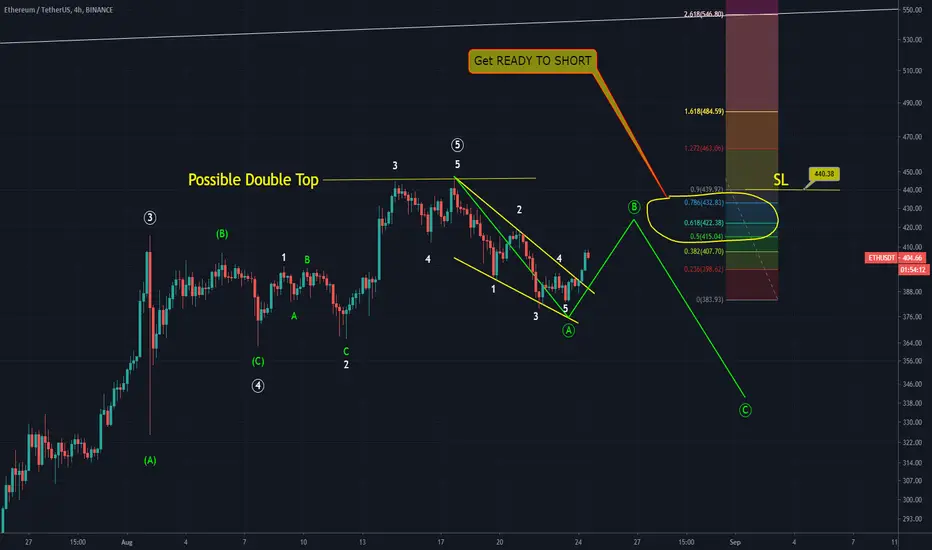
GET READY TO SHORT ETH USDT / ELLIOTT WAVE ANALYSISFeel free to short when everybody is hell bullish
Short at yellow circle FIB 0.5 / FIB 0.618 and FIB 0.786
and SL at 0.90
Cheers....
ETHBTC ONE MORE GO UP AND CORRECTION. ELLIOTT WAVE ANALYSISHello folks,
I try to count wave structure of ETH BTC pair. It seems we are at ascending wedge of Wave (iv) of Big Wave 1. After completing Wave (v) we should see a correction whic is W2. After then a big rally big W3 that will carry us new highs.
Please feel free to share your ideas and thoughts.

ETHUSDT Mid Term Trade!Hello, dear friends
ETHUSDT Mid Term Trade!
If you like such format of my quick analyzes, support idea with like. I'll try to find more opportunities for making 💰
Always in touch with you🧡
Follow us please to make more chart
Sincerely Your DrDonIQ
Short is relevant.At the CME exchange the price has stopped at $286.
This is the level where my first target will be.
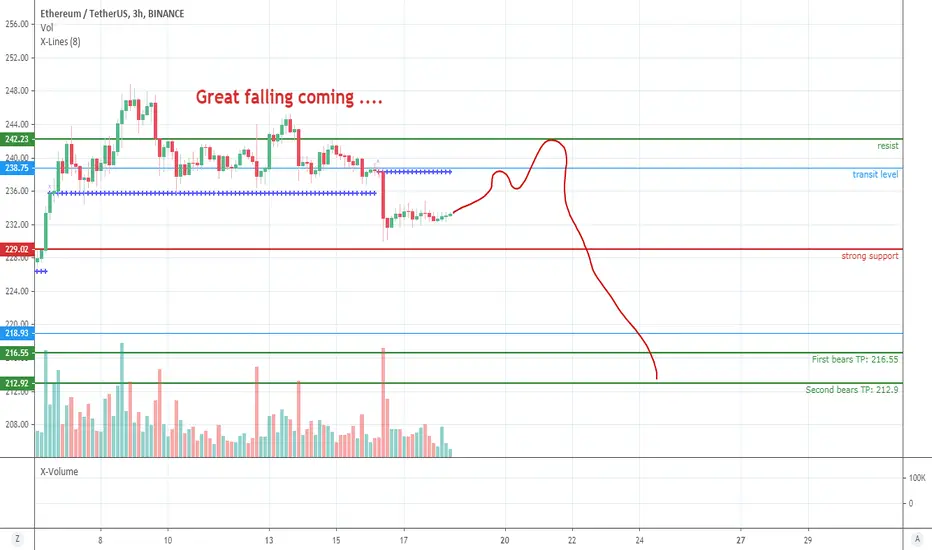
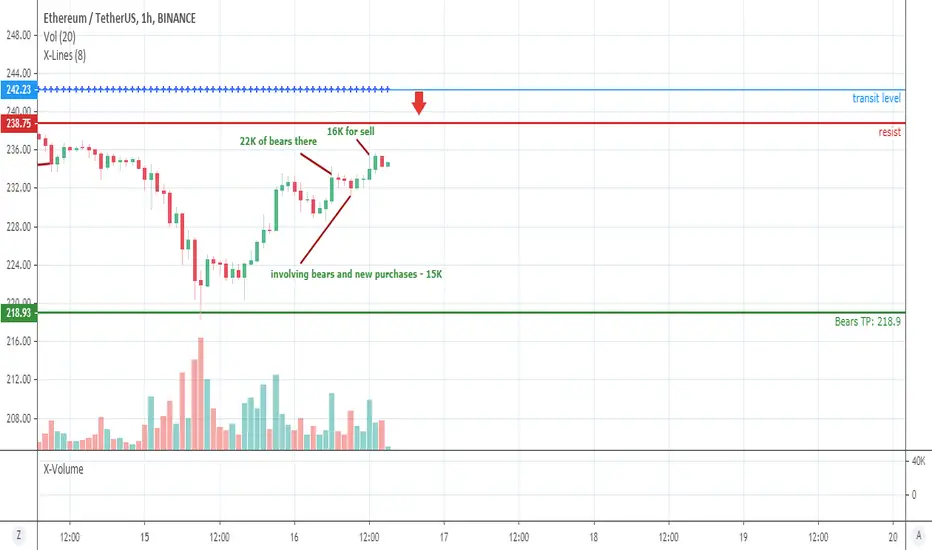
ETHUSDT, great falling to 212 in near future.Hi everyone. X-Volume script show too much newly open contracts above 238. Now we have situation when price going to support 229 and get there 70K involving bears. On this money we can go up to 238 and then will falling to 212.
Levels thanks to X-Lines script (link below).
Waiting your likes!
ETHUSDT, strong short after fake resist breaking.Hi friends. ETHUSD showing fake resist breaking. Why? Becouse we have more then 45K contracts waiting for sell above 231. Volume analysis thanks X-Volume script. Levels - X-Lines script.
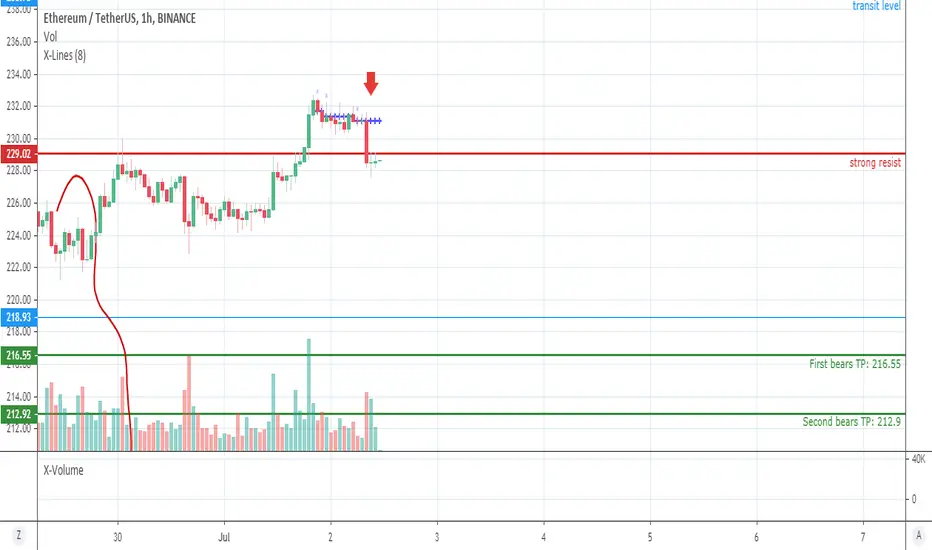
ETHUSDT, short continue. Target 212.9.Hi everyone. In last idea about ETH i do mistake with calculating price action. And now we got under 229 anf fall will continue. we have more than 40K newly open contracts above 218. My opinion next target for bears: 216.55 and 212.9.
Waiting your likes. Levels thanks to X-Lines script.

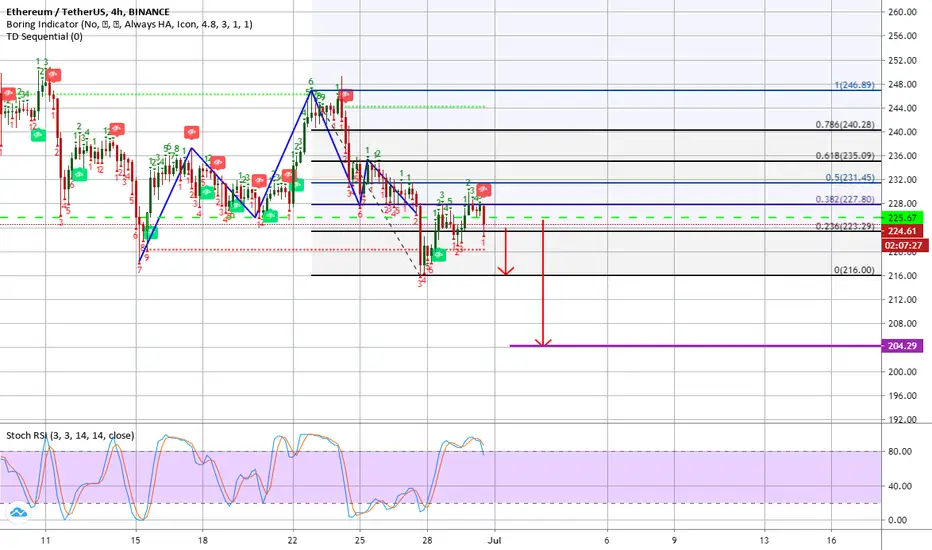
ETH - Long Short If 4H Head and Shoulders Pattern Works TP1 : 216 USDT; TP2: 204,29 USDT
It looks Bearish like BTC.
Closing under 223,29 USDT is better for short entries.
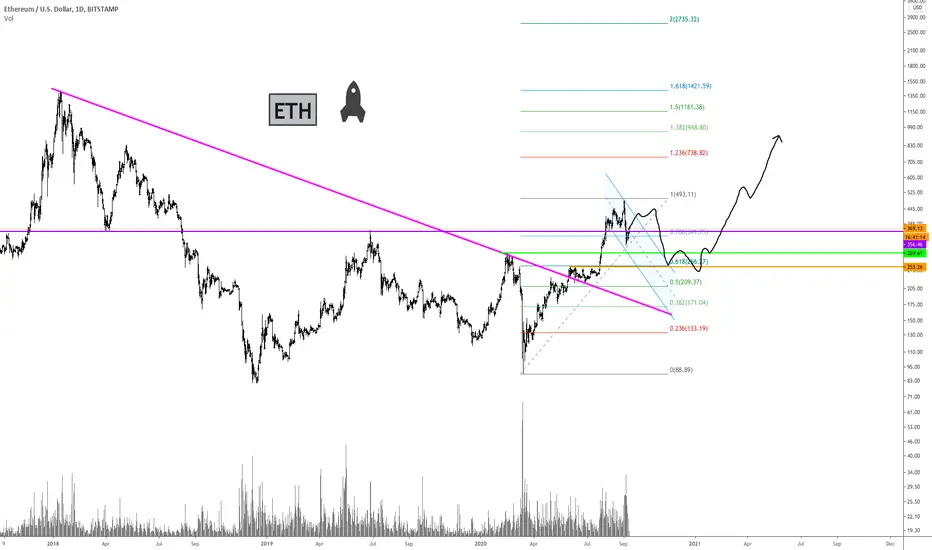
ETH has enormous potential, let's shakeout all bears, okay?ETH has enormous potential, let's shakeout all bears, okay?
shorrt target 150-190$
long target 600$

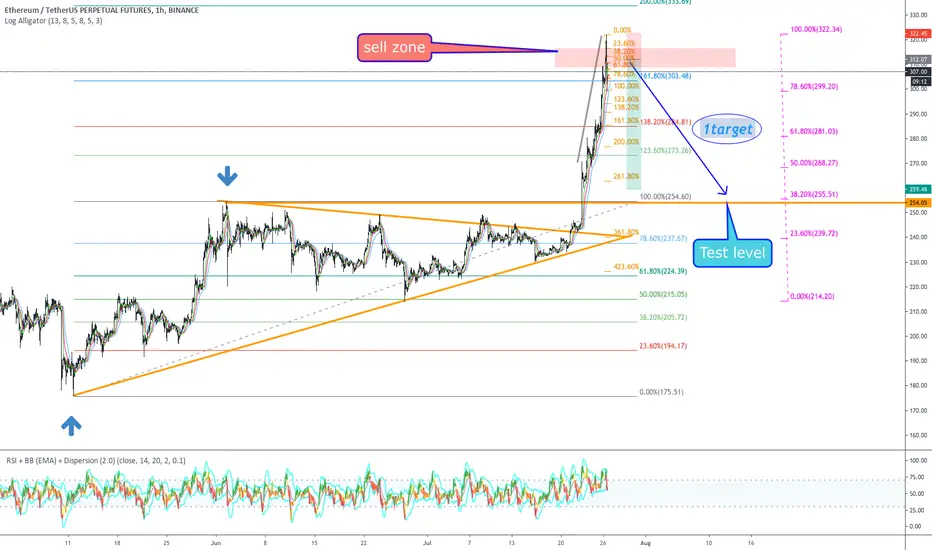
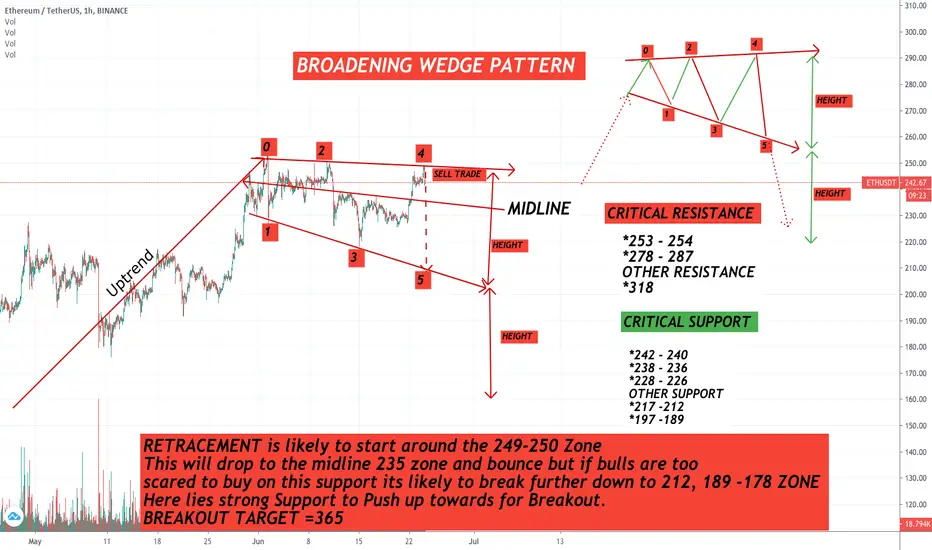
ETHEREUM SHORTING, SELLERS SHOOTING THE SHORTS(Is $185 likely?)Do you think Ethereum will Hit $200 Before $300 zone? The Bears are setting their SHORT filled with hungry arrows to hit $200 but will the Bulls allow this happen with the countless support around $239 - $235 zone?
well here is my view on ETHUSDT current situation.
A RETRACEMENT is likely to start around the $249-$250 Zone as a result of the strong RESISTANCE in this zone caused by the weekly trendline(Weekly Downtrend Top trendline) which ETHUSDT has been in for some time now
This will push it down to drop all the way to the midline $235 zone where a strong SUPPORT lay awaiting. Here ETHUSDT is most likely to bounce but if bulls become too scared to buy (I expect a bounce most likely) on the support, ETHEREUM will most likely break down further to $212, $189 -$178 ZONE strong Support to Push up towards for Breakout.
BREAKOUT TARGET = $365.
Let me know what you think below, DO you think ETHUSDT will Hit 200 before 300?
ETH/USD - roller coaster.my position:
Sale by impulse. The sales area is 50%.
You could say there's a lot of support down there. That's what MM is counting on.
For people to buy and average positions near strong zones.
I've heard many times from experienced traders that they expect a price in the range of $170-180.
And my shorts to reach the $170-180 zone
ETHUSDT, short active again. Target 218.9?Hi, everyone. We have big volumes of newly opened contracts above 231. X-Volume show total 38K for sell above 231. But there is small chance that it can be purchases. So my opinion short. I will update.
Levels thanks to X-Lines script (use it for free - link below).
ETHUSDT, short to 218.9 is active!Hi friends, so what about ETHUSDT? We have strong accumulation by higher prices above 235. I mark all newly opened contracts on the chart window. Like you see we have much more contracts for selling. So i think our bears target 218.9 is actual more then ever!
Levels thanks to X-Lines script (you can use it for free - link below). Waiting your likes. Follow me.
