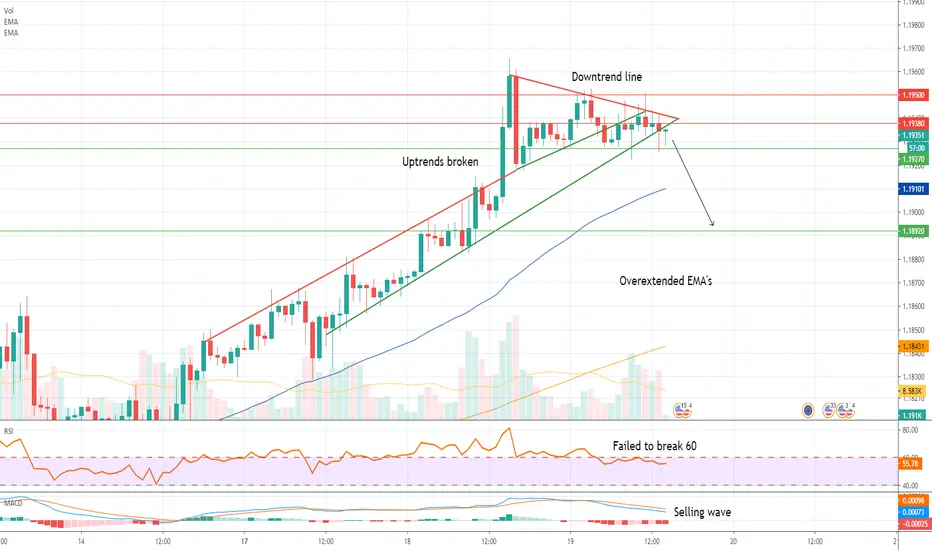
EUR/USD is Expecting a Correction.Hey, I am back with another Technical analysis this time Looking at EUR/USD pair.
EUR/USD has seen a very strong rise, from 1,17100 to to almost 1.12 in a week but haven't seen a correction yet.
The daily chart is showing a Regular bearish divergence.
And the 15 min chart is barely holding on the support level,
Although I like the RSI which finding support at 40.
How to play this?
I am in short since 1.19501, you can also try to short somewhere at 1.19380, and TP at 1.18920 , risk reward 3:1 is very easily achievable here, hopefully with this information you can calculate the Stop loss yourself.
And that's it from me, don't forget to like this idea if you agree that E/U is a short.
Cheers,
Tibor
EU
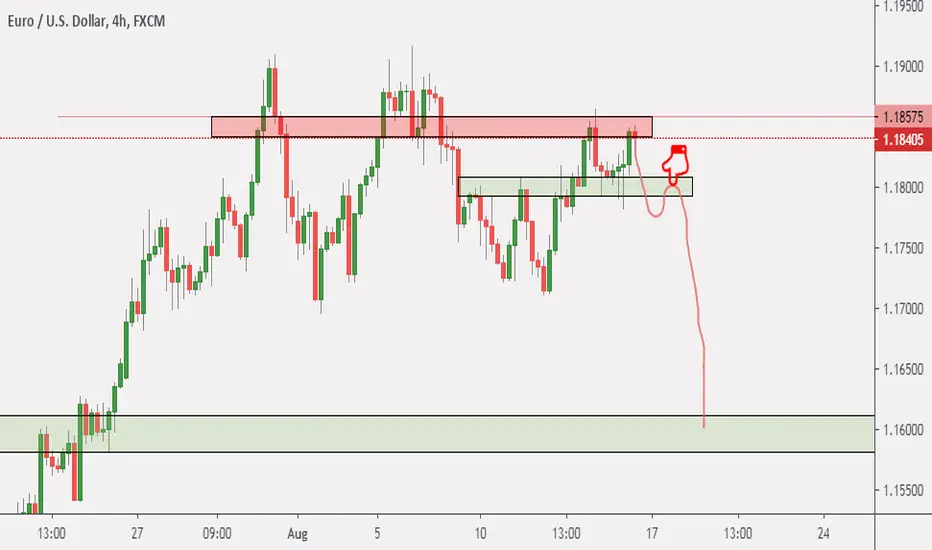
eurusd longsame analysis as Eurjpy but this demand zone was found on a normal s/r zone (green), main bias is still short but only looking for a buy right now.

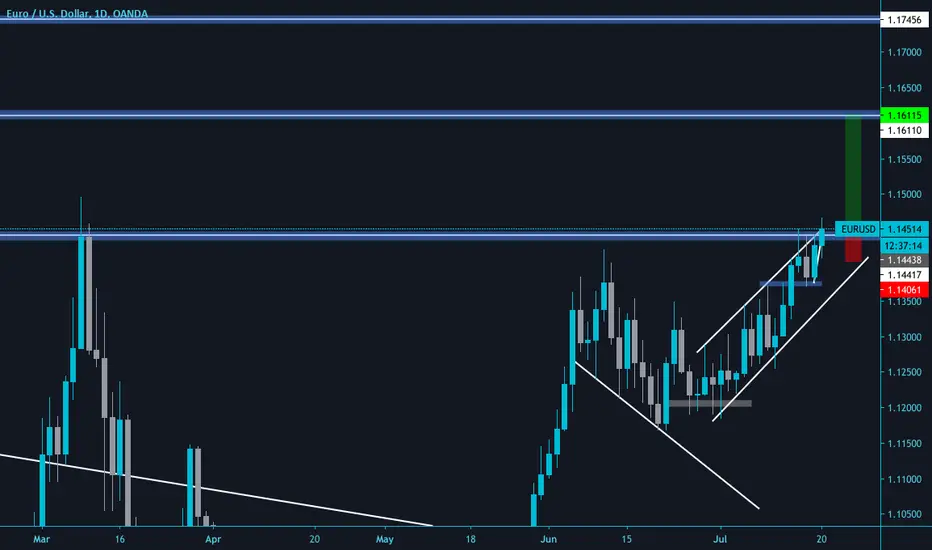
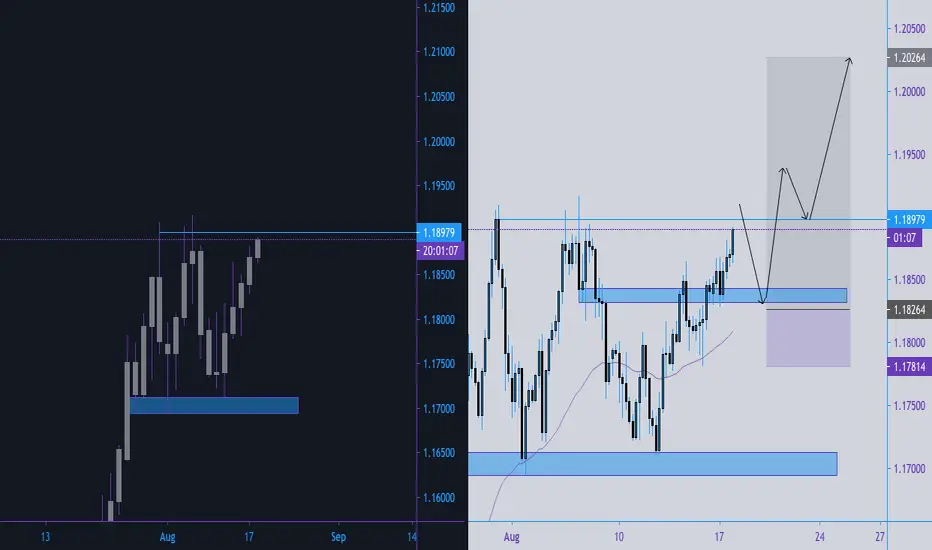
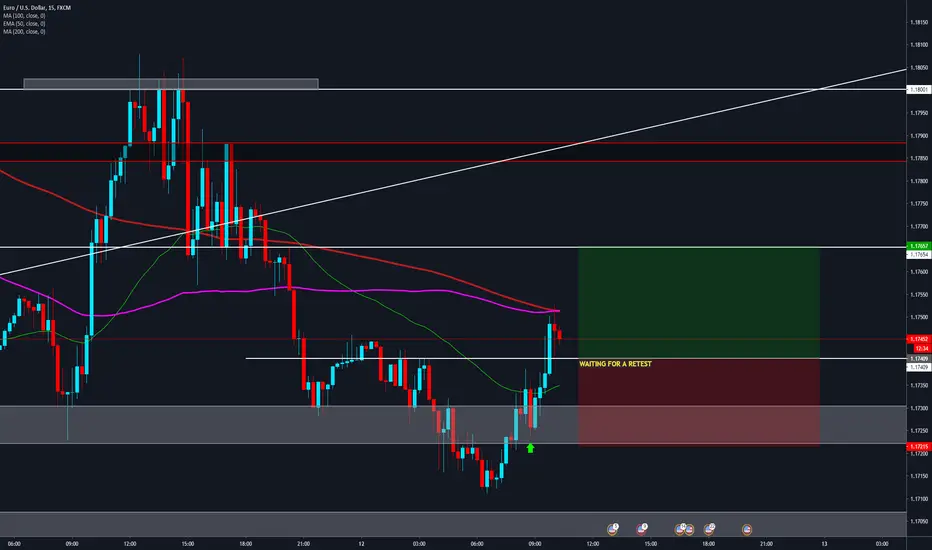
EU SkyrocketA you can see we are waiting for a retest of a broken zone to skyrocket and touch the next level of a previous Sup/Res.
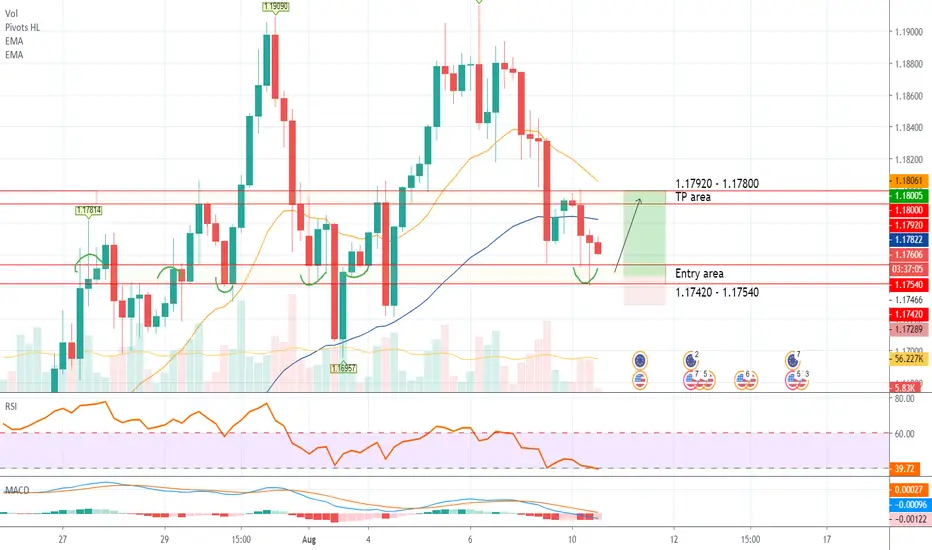
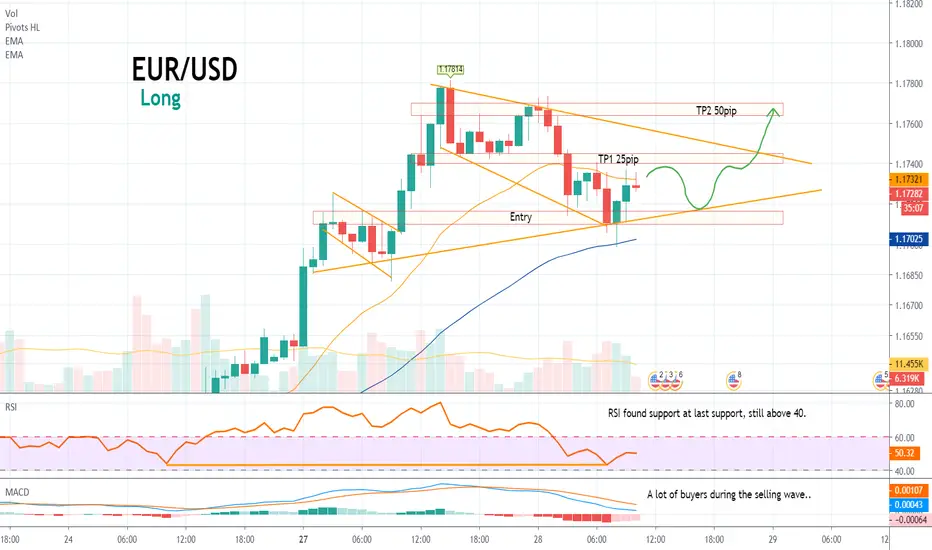
EUR/USD - Long Idea.Hey, I am back with another Idea, this time looking at EUR/USD pair.
E/U is still in uptrend and has shown a good bull demand at support area on which we want to enter Long entry and take profit at resistance area, easiest static way to trade with good risk reward ratio.
Entry area
1.17420 - 1.17540
TP area
1.17920 - 1.17800
Good luck with trading! Don't forget to follow in order to miss out on another good trades.
eurusd longeurusd is approaching my s/r zone (green). Waiting for price to either approach s/r zone or stop hunt (red).
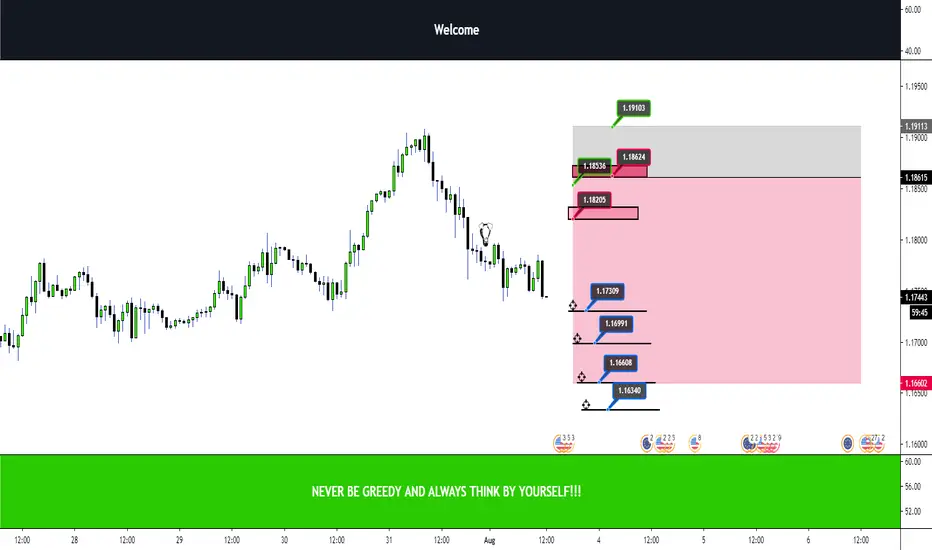
EURUSD Margin Zone Analysis Hello Traders,
Don't forget that we go SHORT only if TRIGGER FOR SHORT happens!
TRIGGER FOR SHORT is American Session Close below PINK ZONE!

eurusdeurusd was respecting support zone (grey), price wicked out to take out retail traders stop loss' and to grab liquidity to go continue going up when the market opens

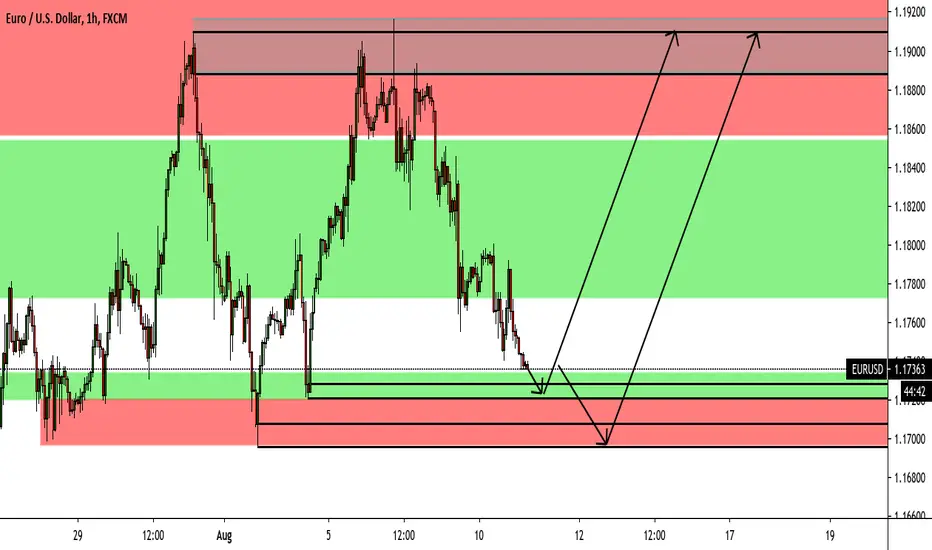
EUR/USD - Another Long?Hey, I am back with another Forex idea, this time looking at EUR/USD pair.
So my last Technical analysis was on EU again, on point, so don't forget to follow me in order not to miss out on such good opportunities, .
And this time, I still don't see a reason to short EUR/USD as DXY is very weak, and EXY is pretty strong. Also there is no technical side of the chart, that is showing some bear signs, so once again, long EU.
The preferred entry is
1.17100 - 1.17160 ( I am in since 1.17100)
TP 1
1.17400 - 1.17450 (25 pips)
TP 2
1.17640 - 1.17700 (48 pips)
Good luck with your trading!
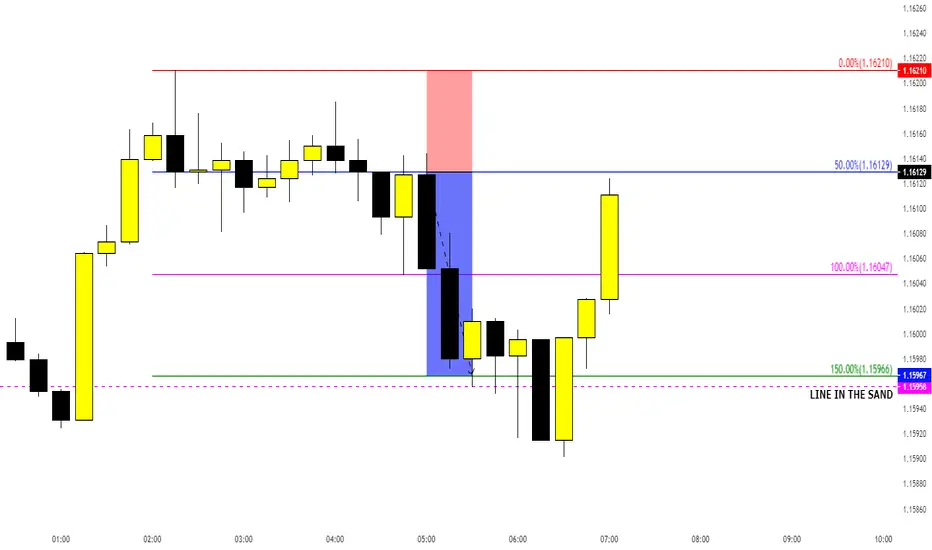
EU 1H 50% Retracement Entry on multiple time framesUsing the analysis from the 50% retracement strategy on the 1H time frame I have entered on the 1m TF using the same retracement strategy. This allows me to enter with a significantly smaller stop loss and in turn the ability to become risk free in a far shorter space of time
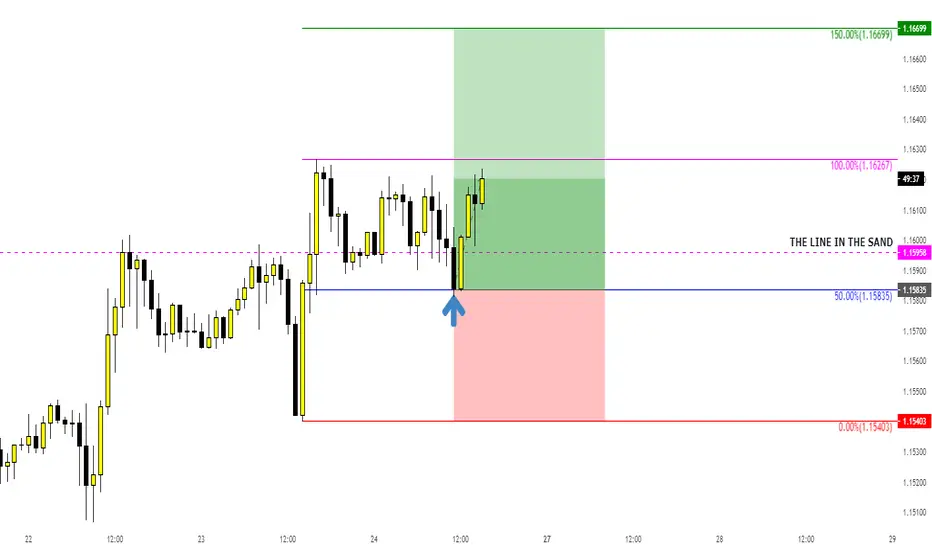
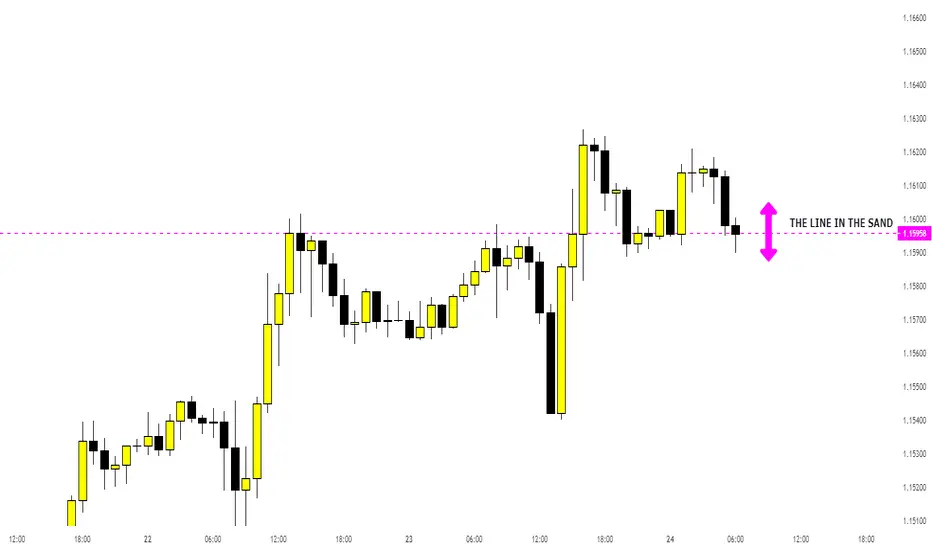
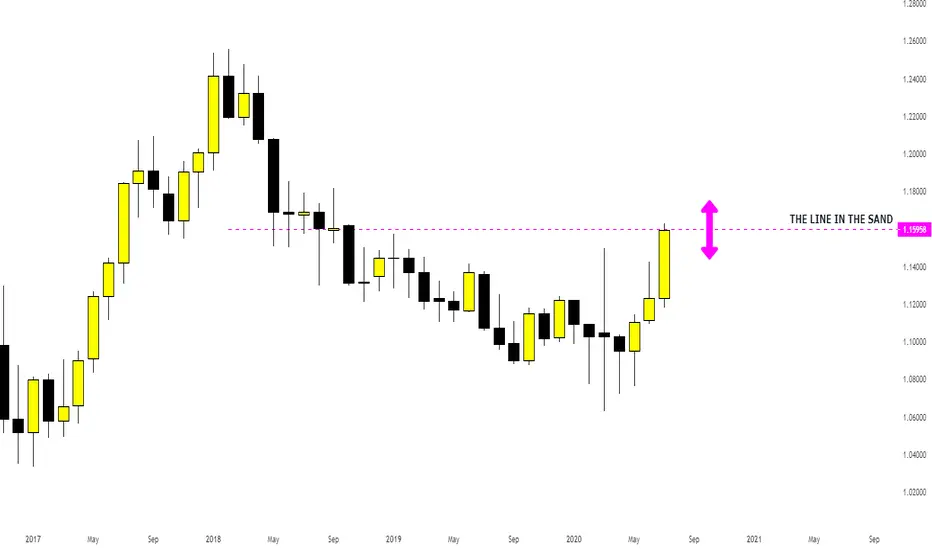
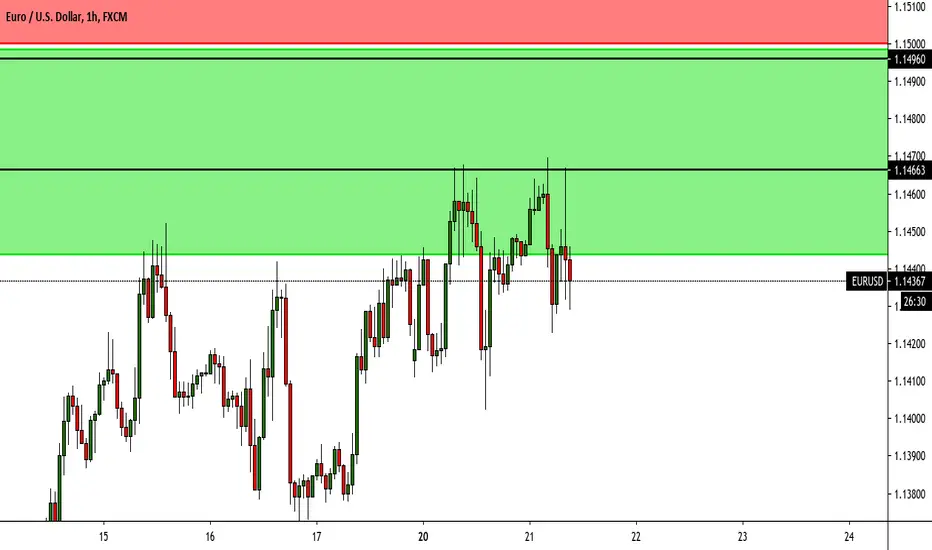
15M EU 50% RETRACEMENT ENTRYDue to the Monthly TF Line in the Sand analysis I will be looking for Bearish entries above the line and Bullish entries below.
The 50% retracement strategy that I use is a very simple construct that can be applied on any time frame. It is in fact the reason for the line in sand based on the Monthly time frames most recent swing high/low.
This 15m example demonstrates the placement of the Entry, Stop and initial target of this system.
Setting the initial target at 1-2 (Risk to reward) allows me to become risk free in the most efficient way possible.
Once the 1-2rr target is met I will close 50% of my position and move my stop loss to the entry line. This action will secure profits equal to the amount risked and allow the remaining 50% of the position to potentially continue to Target two at 1-4rr.
Should Price return to stop out the position I will still have secured a 1-1 Risk to reward ratio.
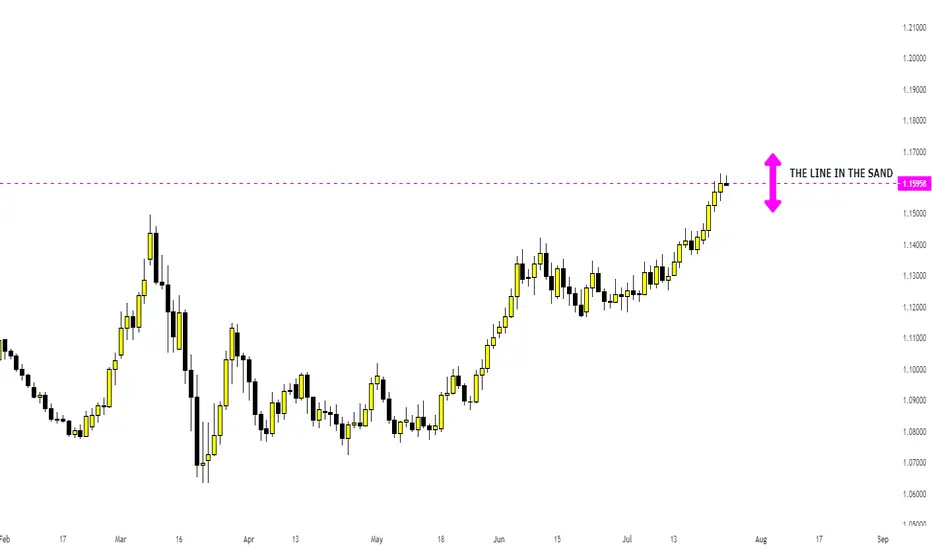
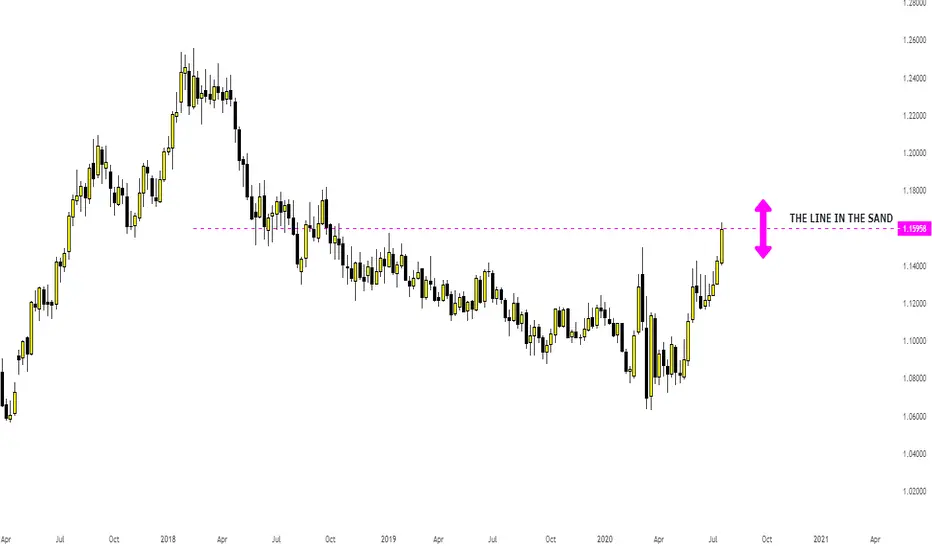
The line in the sandPRICE HAS REACHED A CRITICAL LEVEL!
The Bears need an injection of new shorts to continue the bear trend from the Financial crises of 2008.
The Bulls require an injection of new longs to counter the renewed bearish sentiment.
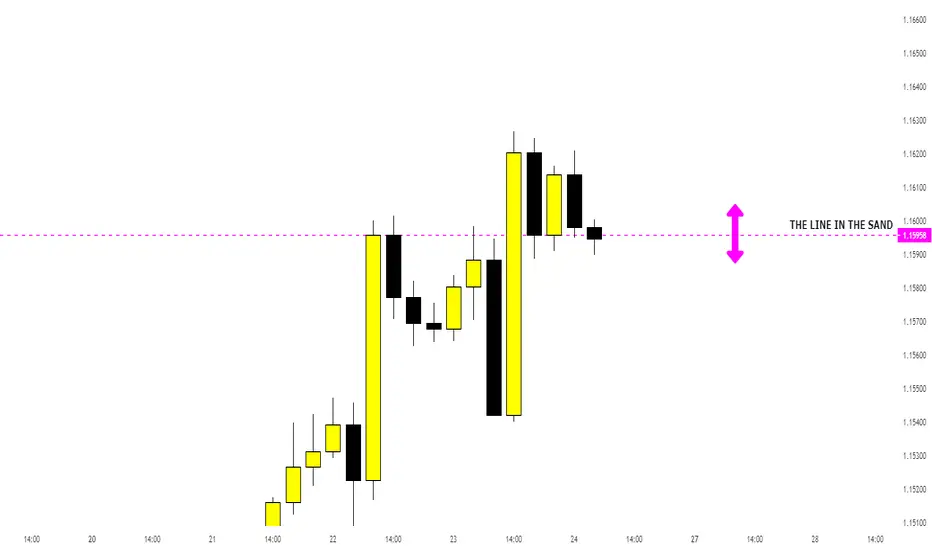
Moving to lower time frames, Price Action begins to show the significance of this level.

The line in the sandPRICE HAS REACHED A CRITICAL LEVEL!
The Bears need an injection of new shorts to continue the bear trend from the Financial crises of 2008.
The Bulls require an injection of new longs to counter the renewed bearish sentiment.
Moving to lower time frames, Price Action begins to show the significance of this level.
The line in the sandPRICE HAS REACHED A CRITICAL LEVEL!
The Bears need an injection of new shorts to continue the bear trend from the Financial crises of 2008.
The Bulls require an injection of new longs to counter the renewed bearish sentiment.
The line in the sandPRICE HAS REACHED A CRITICAL LEVEL!
The Bears need an injection of new shorts to continue the bear trend from the Financial crises of 2008.
The Bulls require an injection of new longs to counter the renewed bearish sentiment.
The line in the sandPRICE HAS REACHED A CRITICAL LEVEL!
The Bears need an injection of new shorts to continue the bear trend from the Financial crises of 2008.
The Bulls require an injection of new longs to counter the renewed bearish sentiment.
Dax daily: 21 Jul 2020What we saw on Dax yesterday was a nice 'fakeout' example of the 12 882 S/R zone and a good example of the reactive activity below the key level and Thursday's fair price. Buyers stepped in to correct the early morning impulsive pressure an as expected, the price headed towards our target and almost hitting 13 119.
Important zones
Resistance: 13 235, 13 519
Support: 13 093
Statistics for today
Detailed statistics in the Statistical Application
Macroeconomic releases
NIL
Today's session hypothesis
Yesterday's mood on Dax and on the US indices was fairly positive. Not only there is a vision of clinical testing results of the Covid-19 vaccine, but market participants expected a progressive dialogue at the EU Economic Summit and finding a deal after many days of talks. EU finally reached a deal overnight as the member leaders found stimulus of 750 Billion Euro fiscal recovery fund and this comprises of grants and low-interest loans. After this news, Dax jumped higher to open with a big ascending gap, levelled between two S/R zones. We anticipate the positive mood continuation with the chance of pullback towards 13 093 as this corresponds with yesterday's high.

EUR/USDCould this be the break of a key level we need for EU to climb toward 2500 area? leave your thoughts below.
We've hit this area back in 09/03/2020 and didn't manage to break the key level but if we get a daily close above this key level this could be a position worth investing into.