EUR-CAD
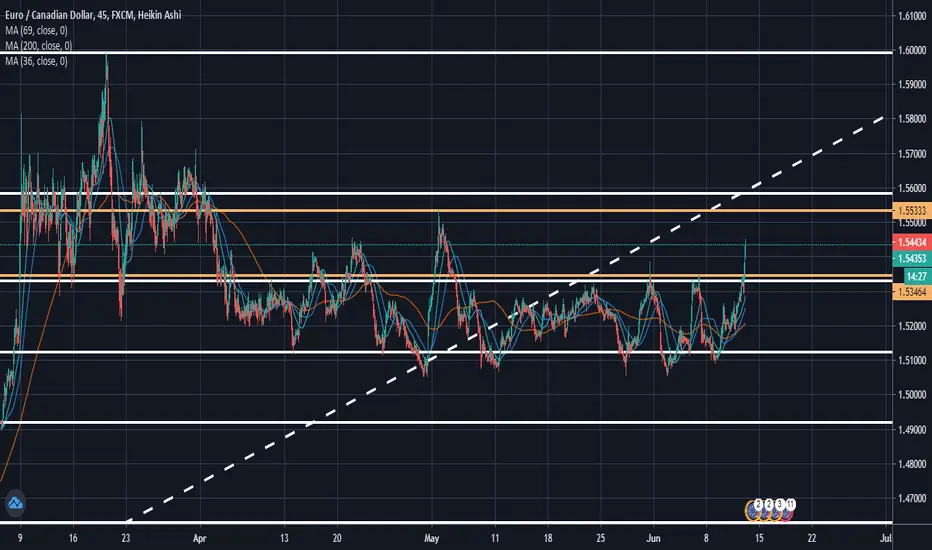
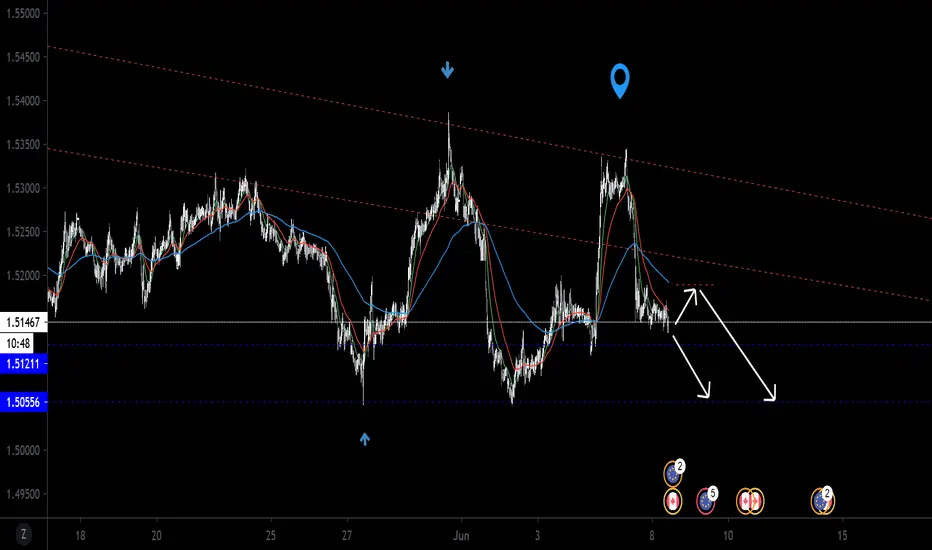
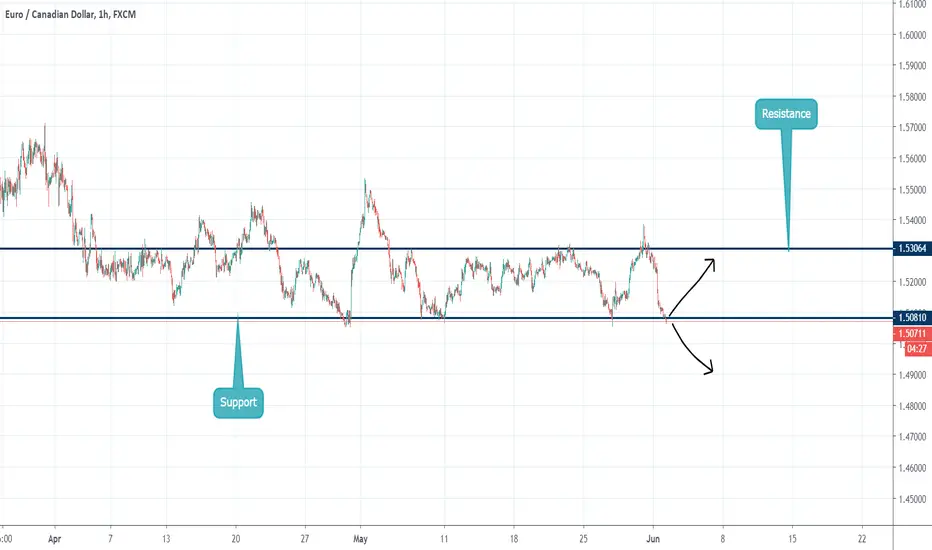
EURCAD price is testing smaller TF resistance will it bounce? This is a full breakdown of my perception of price action on higher time frames! I take my entries using smaller time frame confirmation and you should, too. If you have any questions about this trade or my strategies feel free to ask them in the comment section below!
Let’s make some money together!

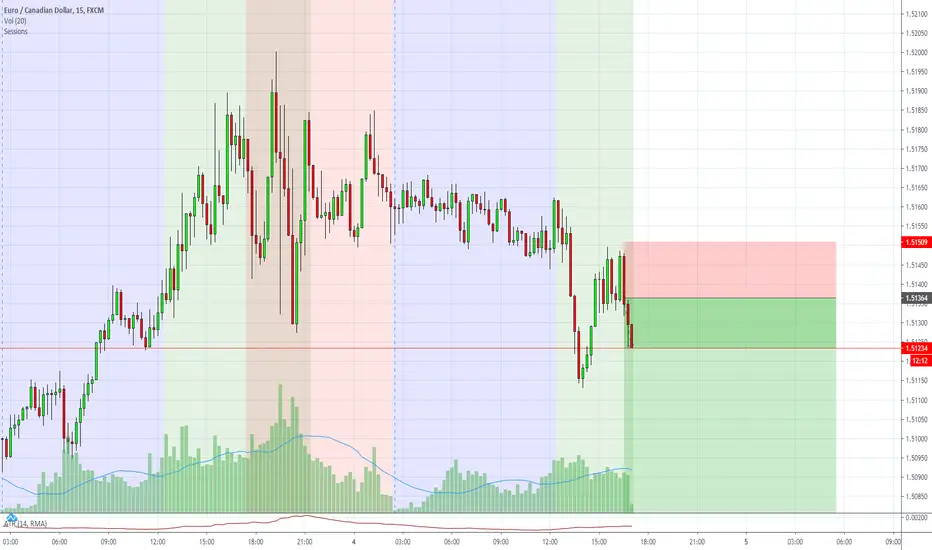
I Don't Like To Say I Told You So... But I Told You SoPrice hit take profit level. Sweet bit of profit for the morning.
Now lets see how price reacts with the key level of 1.51000. currently see a retest. But lets watch this and see exactly what price wants to do.
Thanks :)
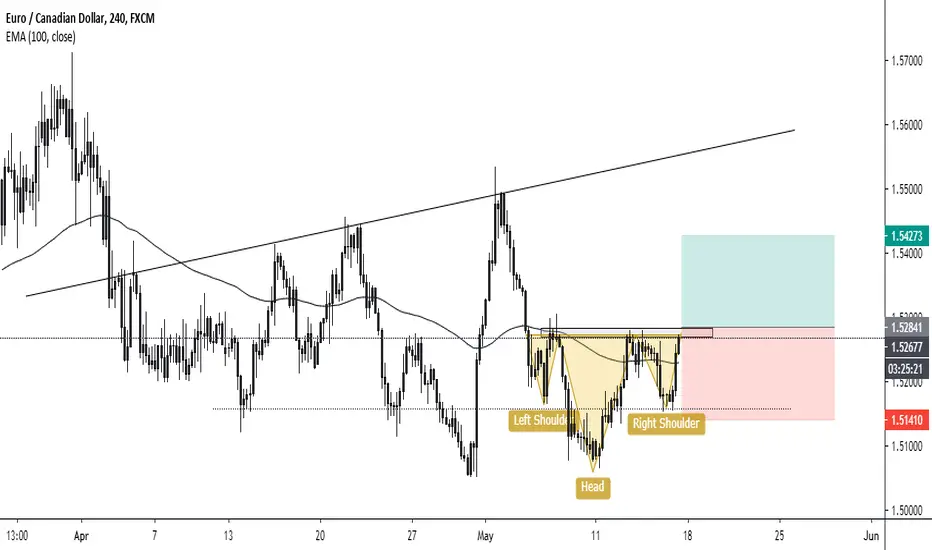
Head & ShouldersH & S, possible long. Probably wait for a break and retest. Although a dip in the oil price may have contributed the CAD weakening slightly, so it might bounce back downwards here again while oil gains some momentum back. Will wait and see what happens
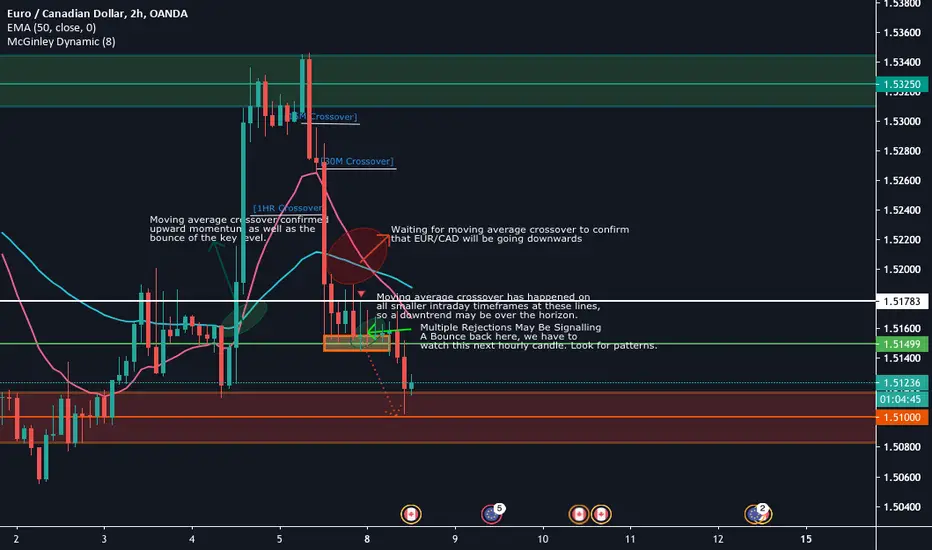
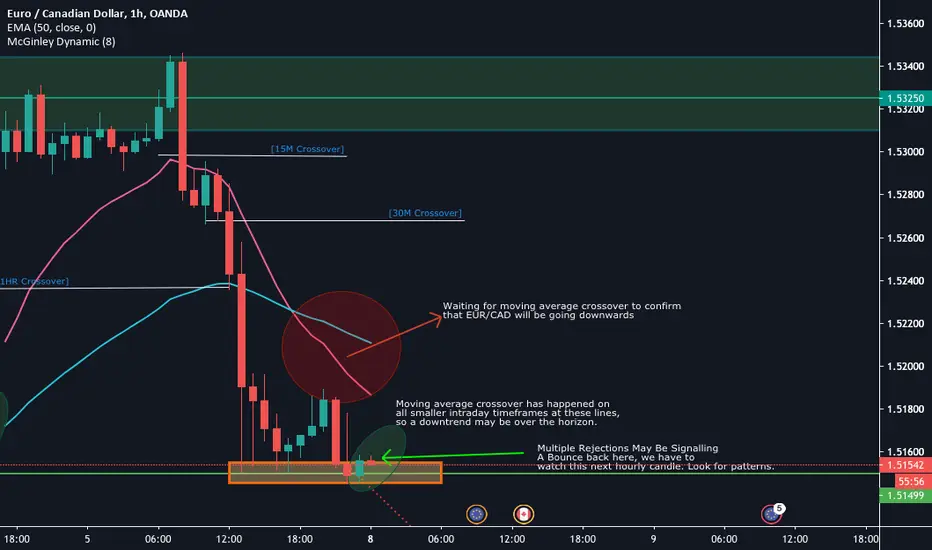
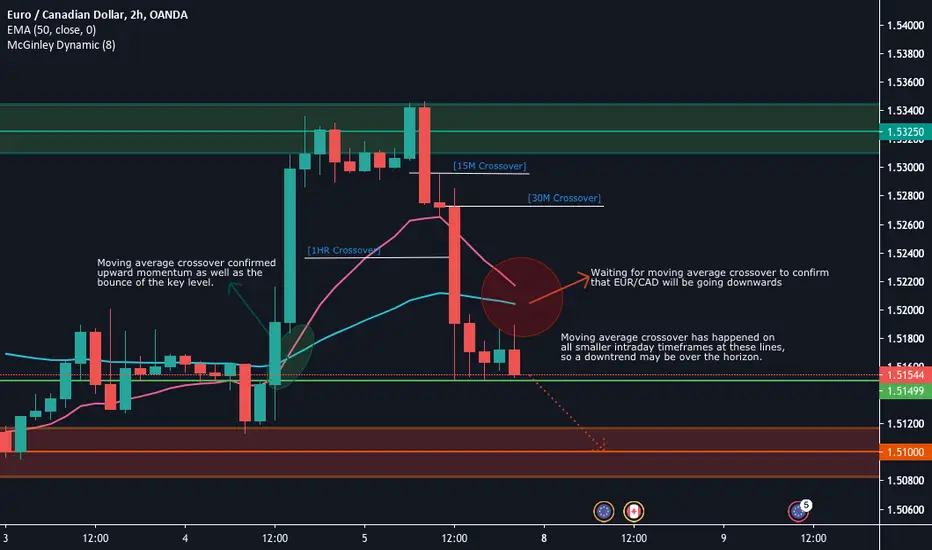
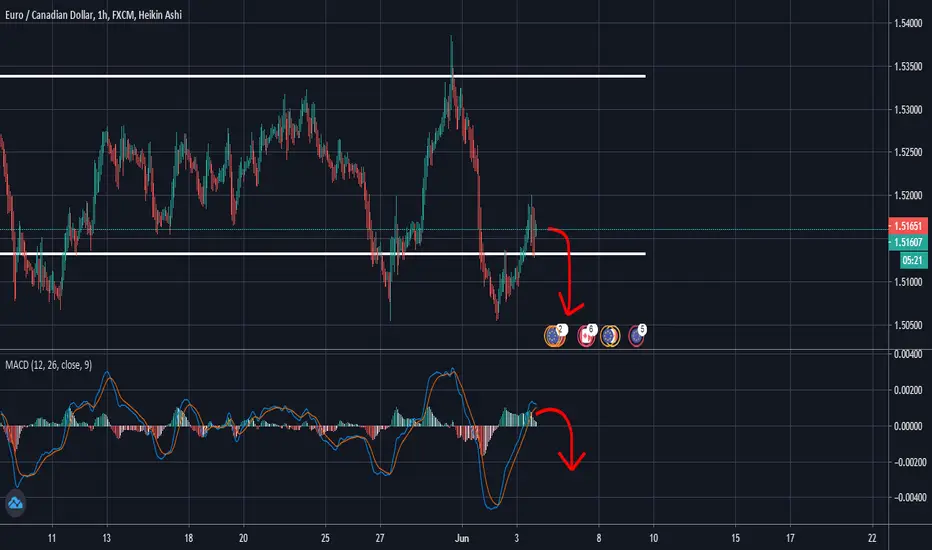
Intraday ShortMN-W1 price above ema-20/50/200. D1 price is above ema-200, price appears to be consolidating on as ema-20/50 are intertwining with consolidating falling wedge pattern. Price has bounced back several times from the high of 24-03-20, each time before reaching its price target a correction appears suggested by price trending above H4-ema-20/50.
D1-MACD bearish with increase in divergence. H4-MACD bearish with increase in divergence. H1-MACD bullish with increase in divergence, however price is still below ema-20/50/200. This could suggest possible oversold condition on -H1 meaning a correction is due on the shorter timeframe before resuming bearish trends. From the bearish trend starting 05-06-20 price has constantly respected the 5m-ema-20 breaching it and testing 5m-ema-50, however, recently price has now gone as far as testing the 5m-ema-200 and reversing with the equal support from the macd which was not the case previously.
1) SELL -H1: Market Execution
Stop Loss: 1.5160
Take Profit: 1.5060
2) If price is still in its correction stage, wait for price to move above 1.5190 which 15m-ema-200 which may be prices next target.
SELL -H1: Sell Stop: 1.5190
Stop Loss: H1-ATR above entry
Take Profit: 1.5060
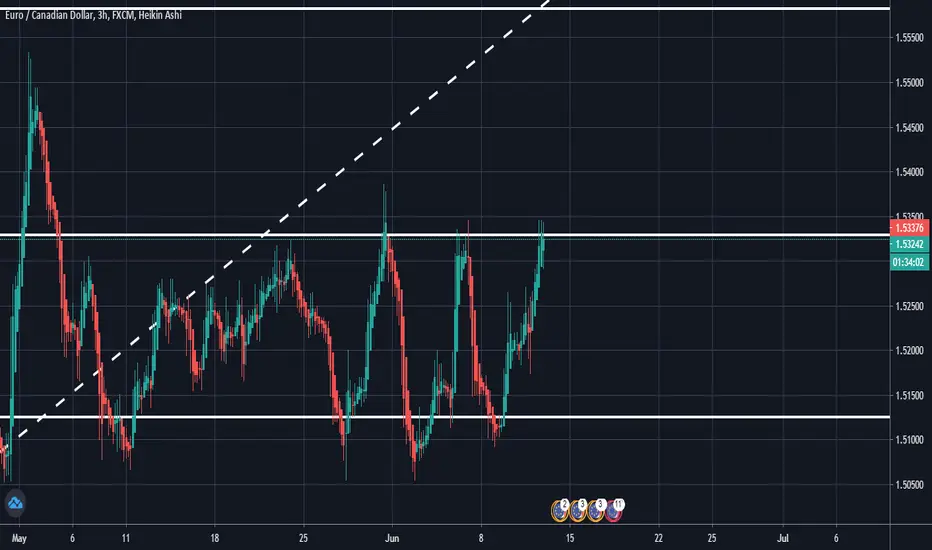
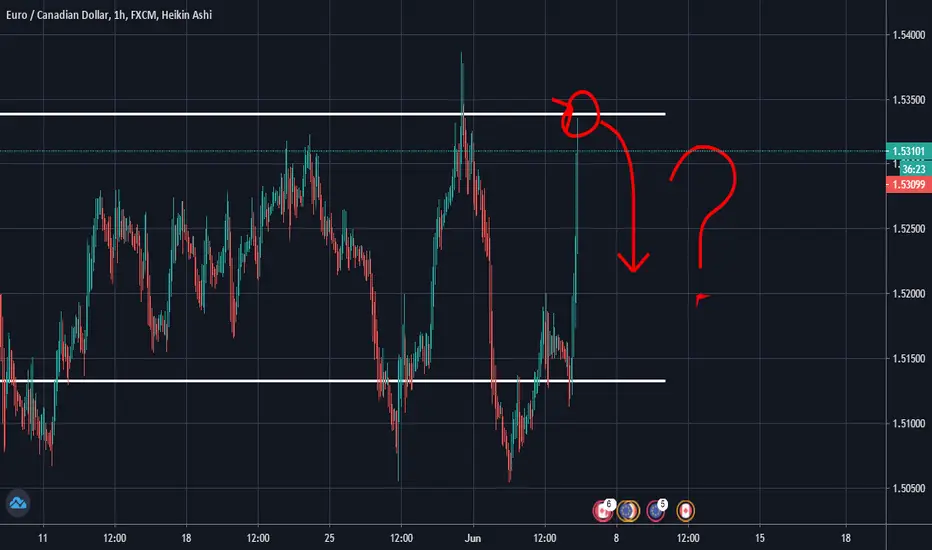
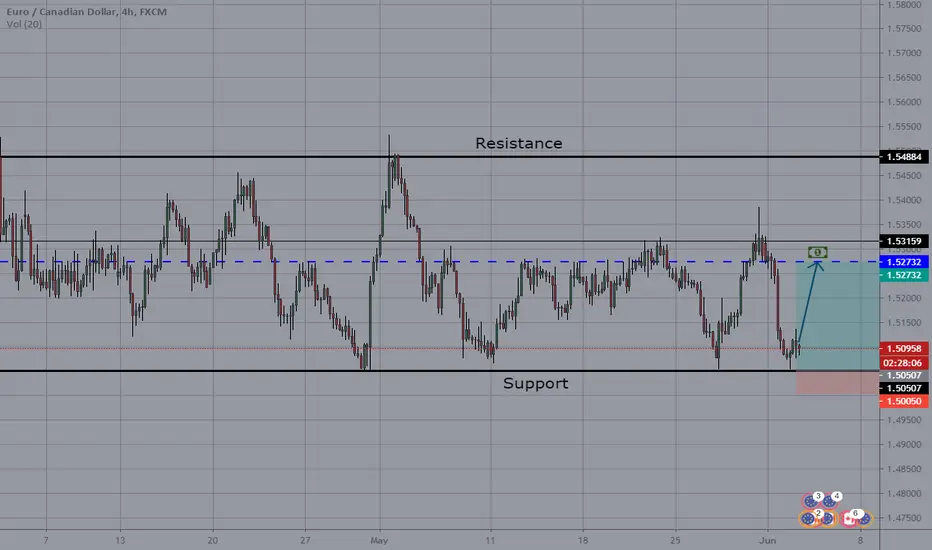
EUR/CAD Long? Short? Who KnowsPrior to this analysis I said we may be going short but we may still be going short if support is broken. Watch this one.
The EUR/CAD Debate..Well Im not going to bore you with a whole lot of writing.
The analysis is above.
Please let me know what you think.
Thank you :)
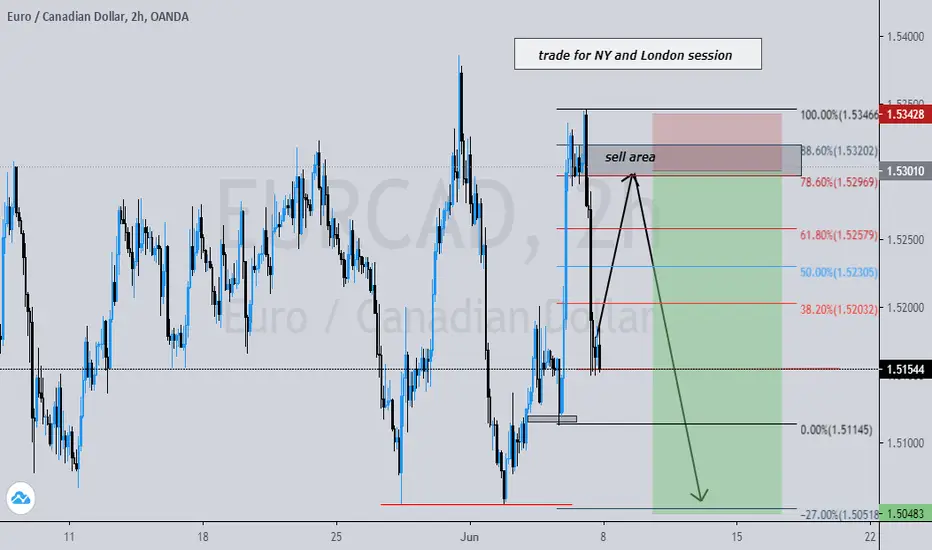
EURCADTrade for NY and London session.
Or if we have some News for cad and euro.We looking for reversal.

EURCADAfter bullish candle on EURUSD, this pair specifically should head down as it reached a new resistance, use risk management!

EURCAD UPDATE! This is a full breakdown of my perception of price action on higher time frames! I take my entries using smaller time frame confirmation and you should, too. If you have any questions about this trade or my strategies feel free to ask them in the comment section below!
Let’s make some money together!

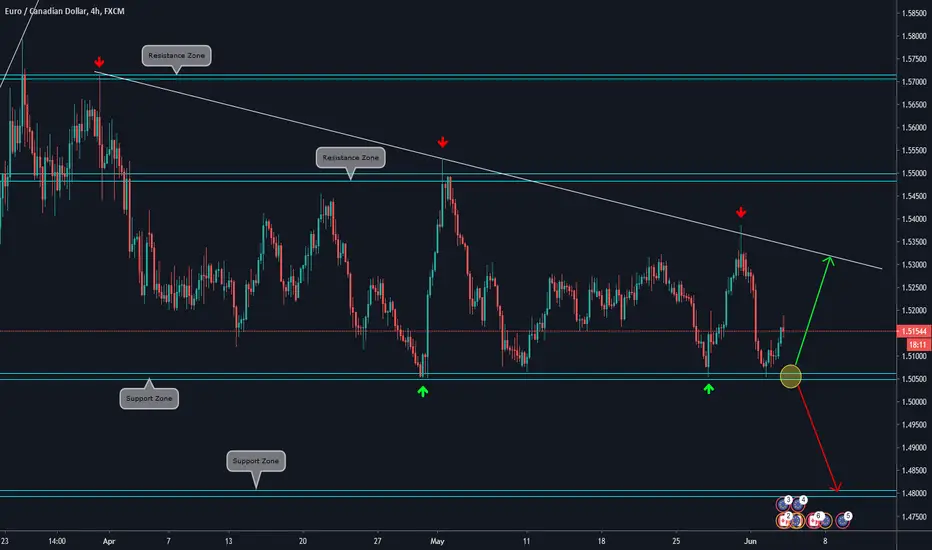
EUR/CAD Short Term Bullish Move by ThinkingAntsOk🔸 4H CHART EXPLANATION:
.
.
🔸 Price bounced at the Support Zone.
.
🔸 In a lower timeframe, the Descending Trendline of the previous bearish impulse has been broken.
.
🔸 We consider that it has potential to reach the Descending Trendline.
.
🔸 Will look for a lower timeframe bullish setup.
🔸 DAILY CHART ANALYSIS:
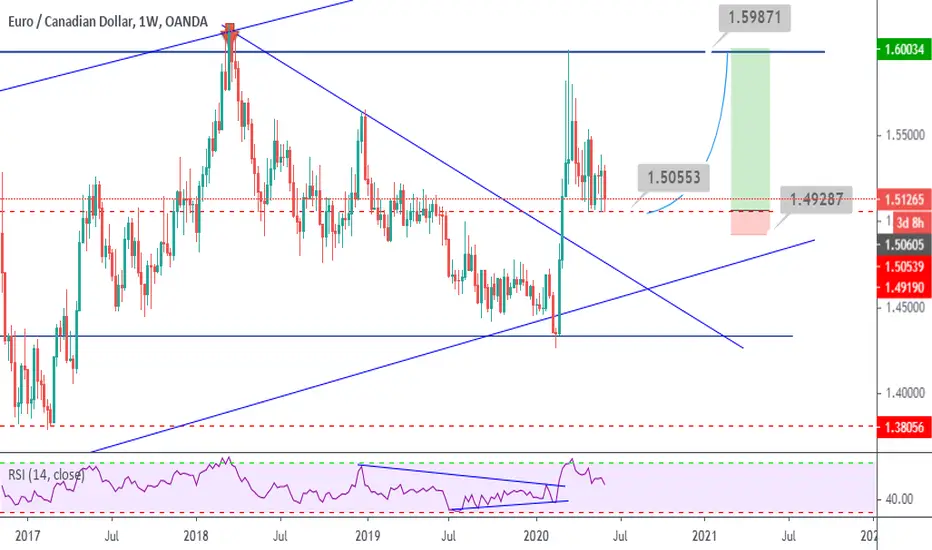
EUR|CAD The resumption of growth.Hello, everyone. Thanks for reading.
You can buy, risk reward is good.
Thanks for reading
Dont foreget to leave a like if you liked my idea

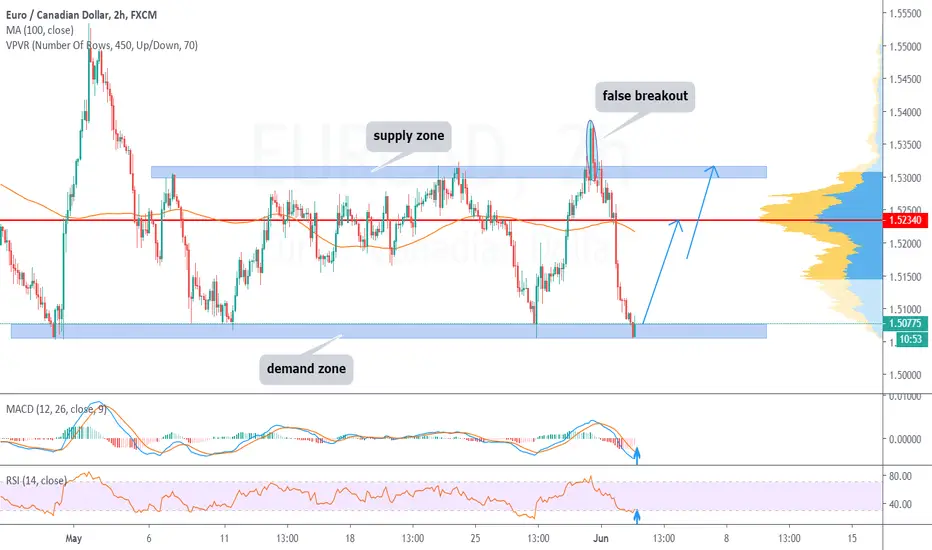
EURCAD LONG TRADEEURCAD is in trading between levels 1.5055 and 1.5315
Pair rebounded from demand zone at level 1.5055
MACD shows weakness in bearish momentum
RSI reached oversold region
It's expected for coming strong bullish movement to first target HVN at level 1.5234
then target supply zone at level 1.5315
ANALYSIS ON EURCADHello my fellow traders, hope you all are making some profits. We are here with our new analysis so that we can increase those profits for you. Let’s get into the analysis.
As we can see, the price is at its support. One can wait for confirmation.
Let us know your views on this in the comment section. Thank you all.
There is good news for our followers. We will be analyzing on-demand. So let us know which pair you want our analysis on and we will get it for you. Do like and follow us.
Ryan.R..Lopes
EURCAD Price has pulled back and is almost to the .50 fibb levelThis is a full breakdown of my perception of price action on higher time frames! I take my entries using smaller time frame confirmation and you should, too. If you have any questions about this trade or my strategies feel free to ask them in the comment section below!
Let’s make some money together!
