USDJPYUSDJPY. Weekly Forecast. Looking short on this as well as USDCAD. Would really be surprised if this did not play out but its forex so lololol,
EUR-CAD
EURCAD and the SILENCE.Actually we can expect the acumulation in the key level, afet of this, is probable that the value want to go down or rise to reteste the uptrend to fall after fo this.

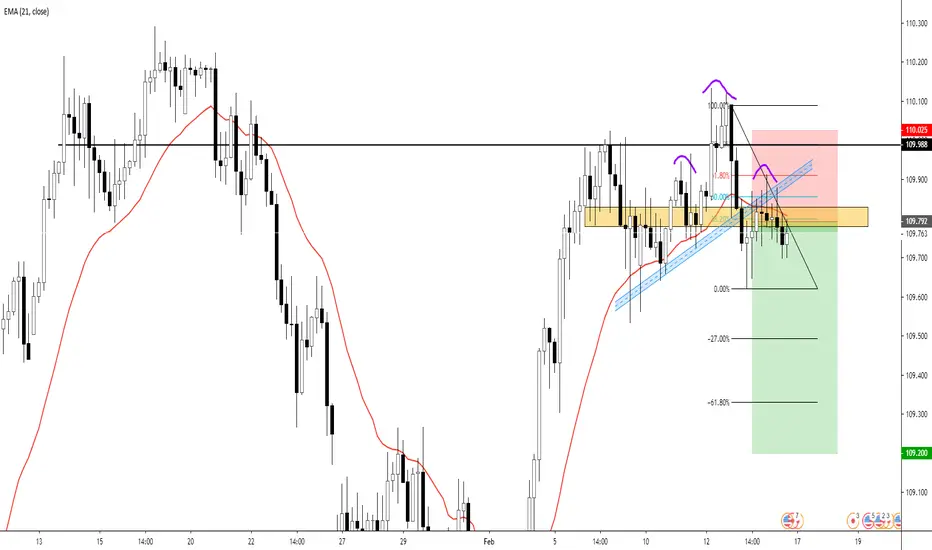
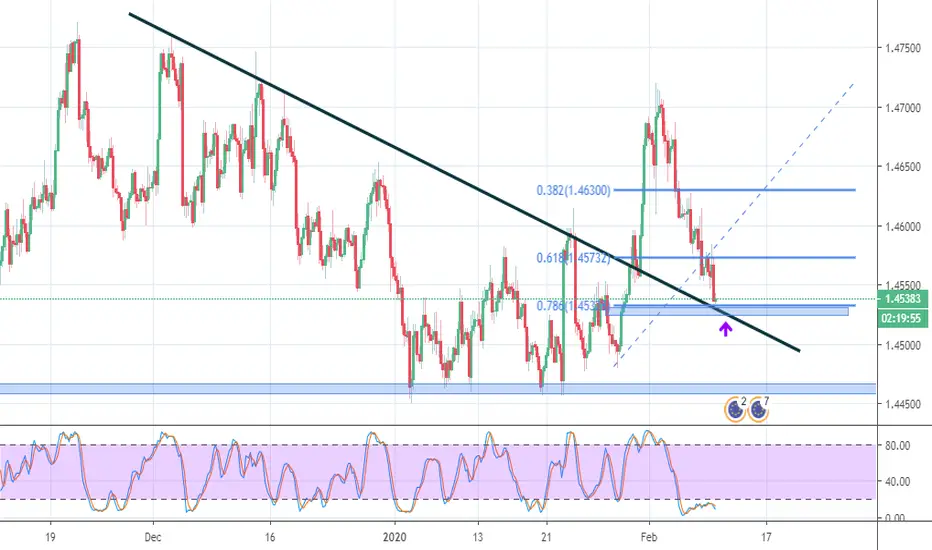
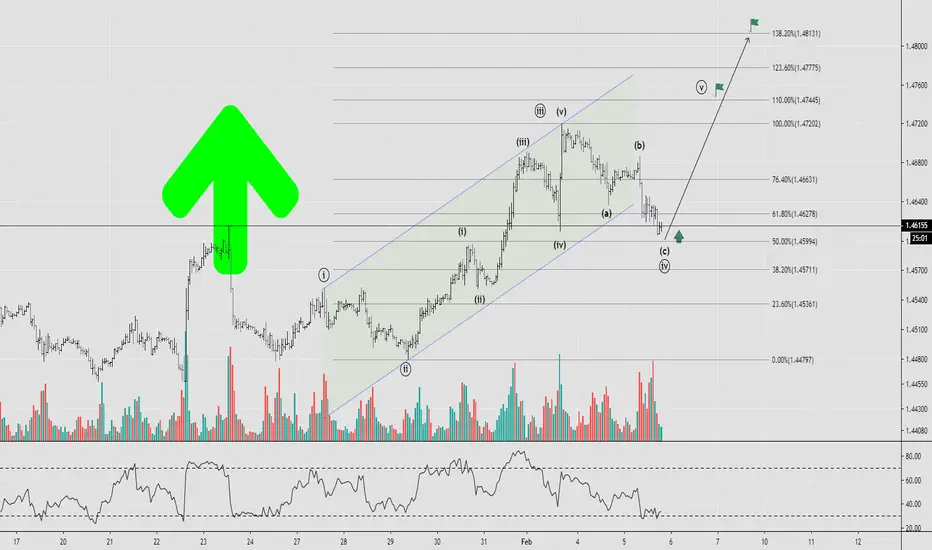
Retracement Determines Next MoveKeeping this short and sweet this week.
All the pairs I'm updating are based on Friday's big move. The focus is to determine price direction and next setups. I don't have enough info yet for the next major moves. So trade zone-to-zone.
BULL TPS:
From the 1.45942 zone…
• 1.46382
• 1.47075
• 1.47542
BEAR TPS:
• 1.45942
• 1.45571
• 1.45161
• 1.46641

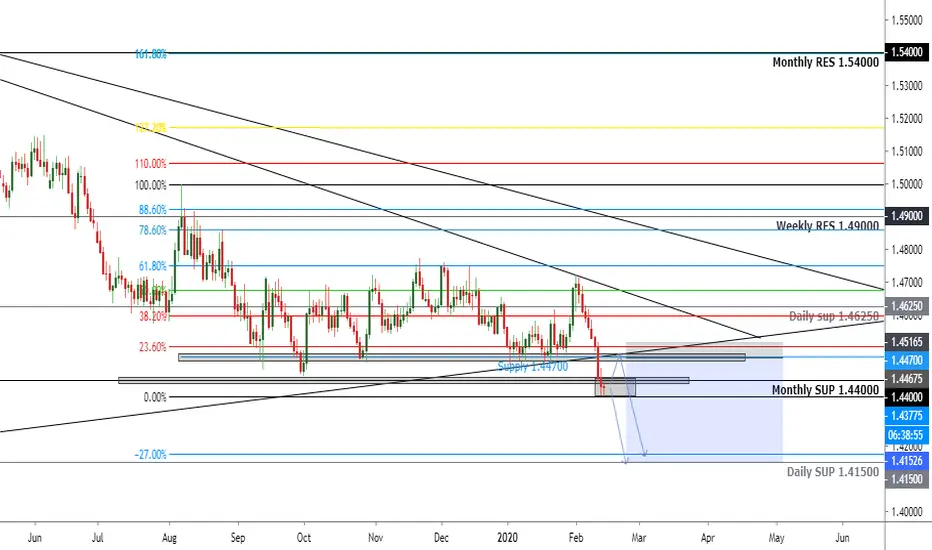
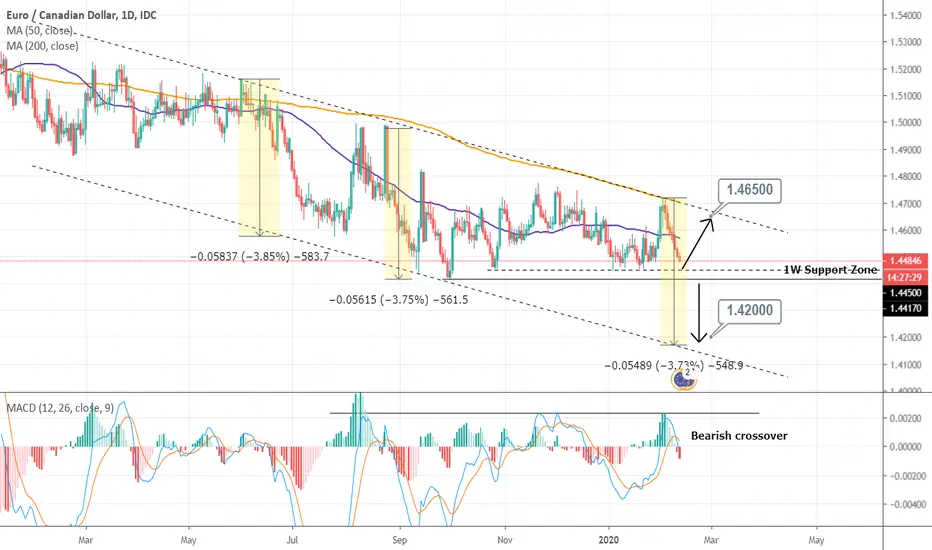
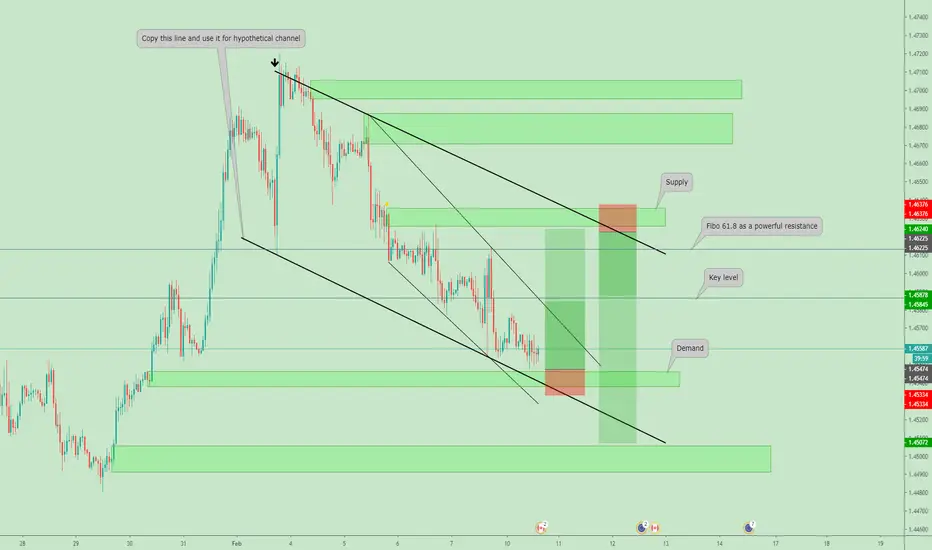
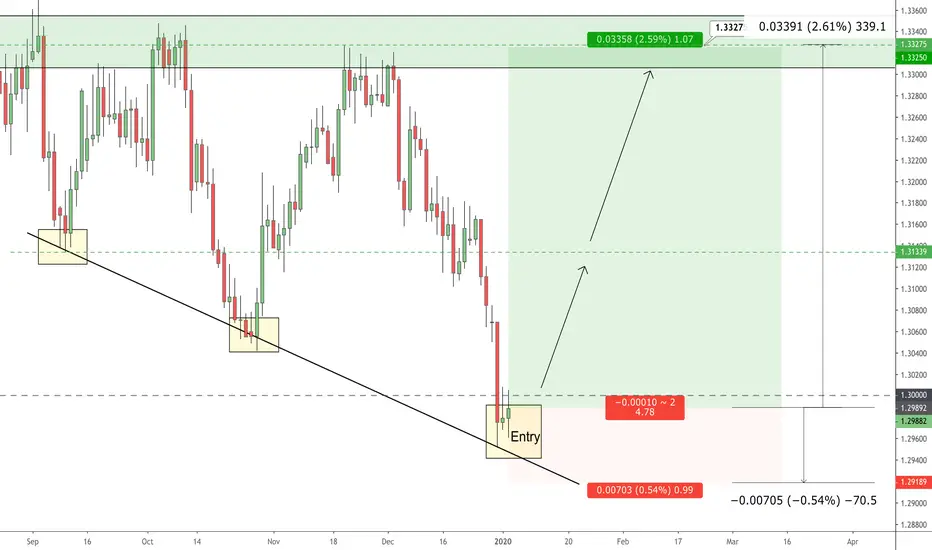
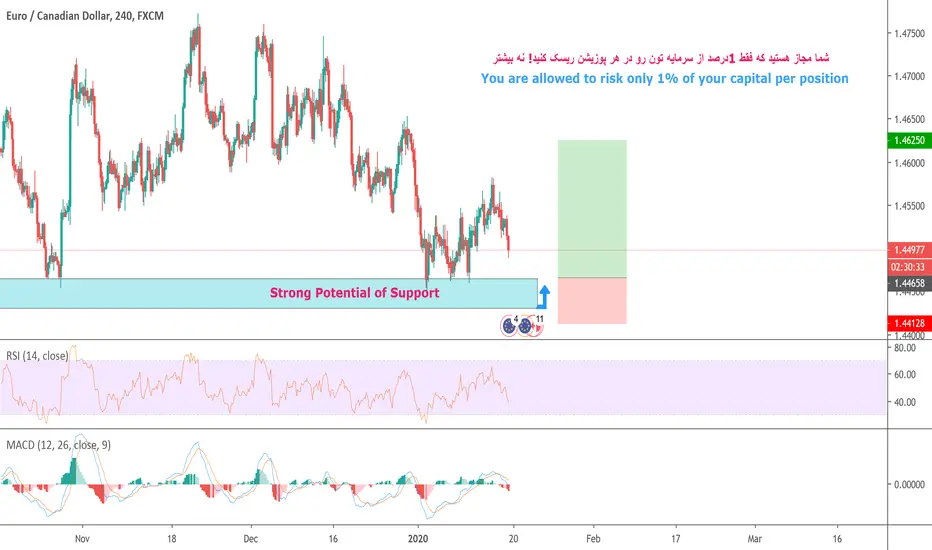
EURCAD Action plan on support testPattern: Channel Down on 1W.
Signal: (1) Bullish as long as the 1W Support holds. (2) Bearish if it breaks.
Target: (1) 1.46500 (2) 1.42000.
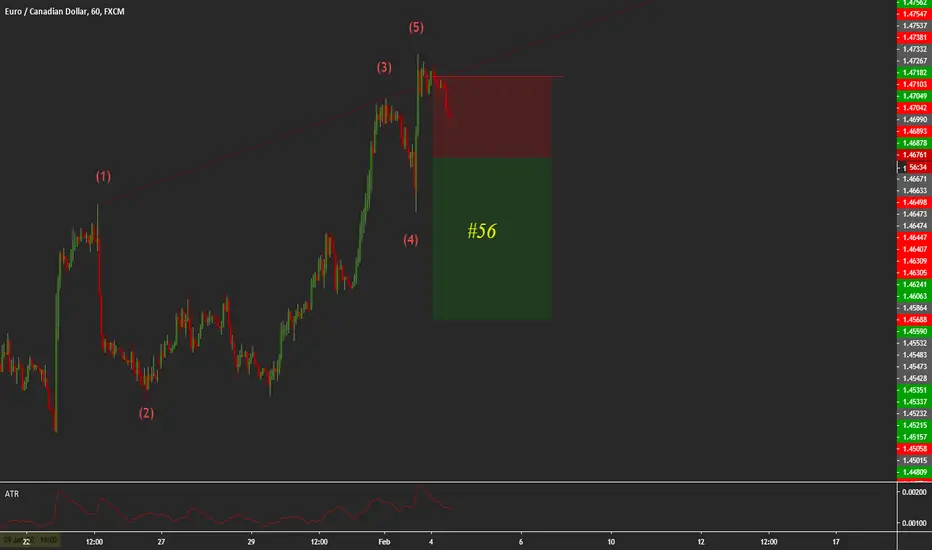
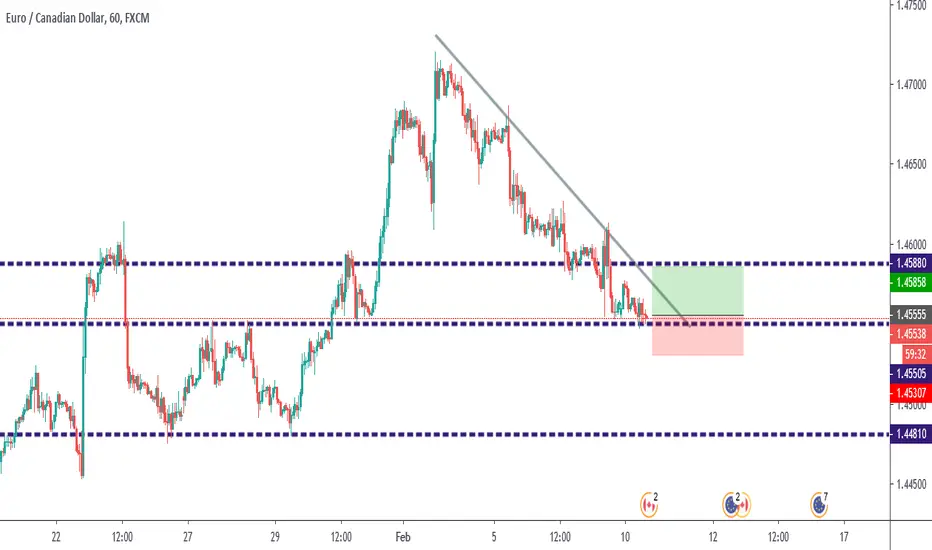
WOL3.1 #56EURCAD sell stop 1.46474
SL 1.47042
TP 1.45337
R= 56.8 pips
Si el precio llega a 1.45905, mover SL a 1.46361
BUY EURCADPossible Scenario For EURCAD In Important Level of Fibonacci After Break Structure in 4H
When I Entry? When The Price Break The Trendlike in 1H.
Good Trading For You.
EUR CAD Wall Rejects Price As Weekly Support NearsEUR CAD IS trying to break the wall of resistance but it met with failure
We are going to attempt to break and once we do - we can go into a huge bullish run

eur cad target top of weekly resistance level aslong after support at .618 - looking for upside to .5 of first impulsive then take off further up from there to weekly resistance level

eur cad bullish begins long to resistancelong to 4 hour resistance trendline
we see impulsive move then retrace down to past .5 fib level of weekly one then buyers pushing price to .5 fib level support
now we can see support on .5 fib level weekly - now entry on support of daily trendline and .5 fib level supports - as weekly wick to the upside - great - now we can move into next impulsive move to the trendline resistance area as target

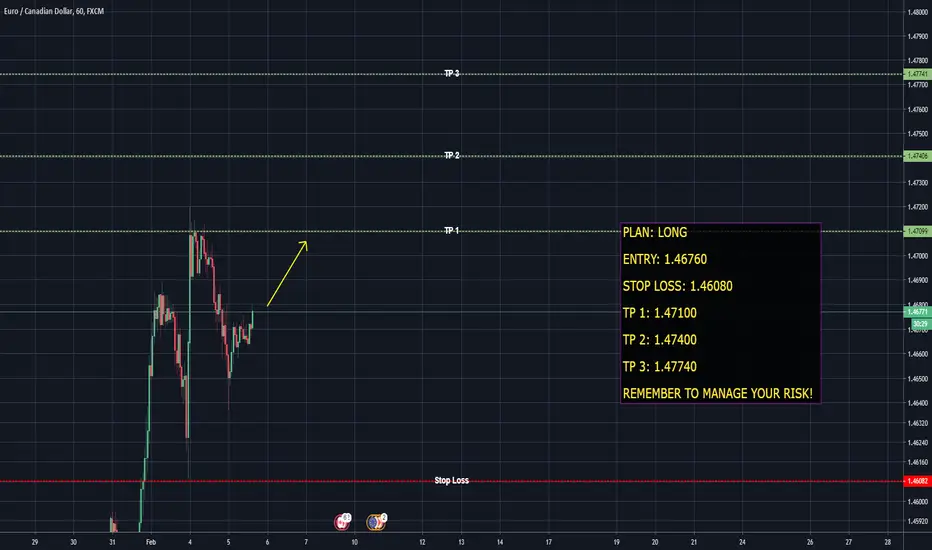
EURCAD - Long opportunityPAIR IN FOCUS: EURCAD
PLAN: LONG
ENTRY: 1.46760
STOP LOSS: 1.46080
TP 1: 1.47100
TP 2: 1.47400
TP 3: 1.47740
REMEMBER TO MANAGE YOUR RISK!
EURCAD - Buy 05/02/2020Friends, please before reading, support this idea with your Like and any Comment, thanks.
You can buy EURCAD from 1.462-1.46
Stop-loss at 1.457
You will find more trading ideas in SAV Finance community.
USDCAD Buy Signal with target (+333pips) for more trades like this, leave a comment if you support
22:32:10 (UTC)
Tue Feb 4, 2020
USDJPYUSDJPY idea. Looking to add to my short position from the 110 level. Been MIA for a grip. Currently studying in Rome. Slowly getting back into markets now that I am settling in and the markets are starting to get back to normal sentiment after the 1st month of the year
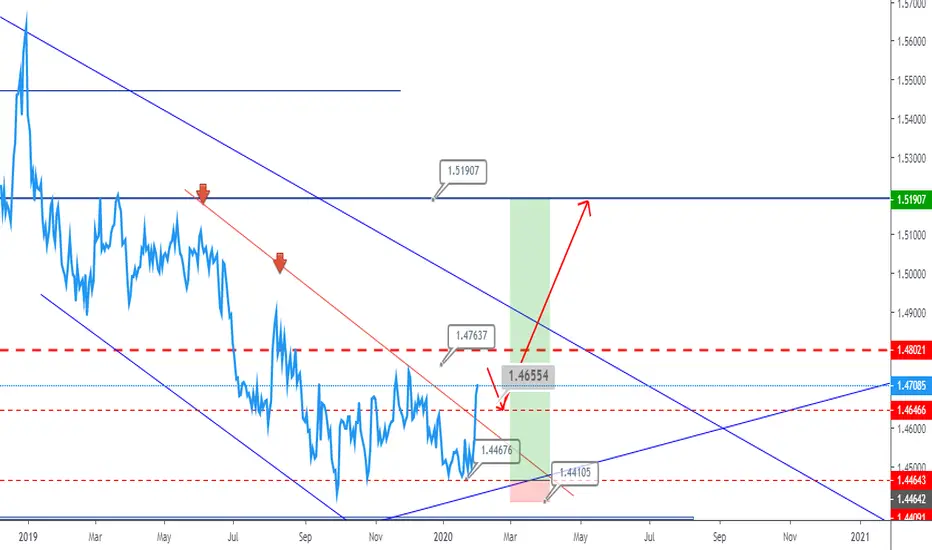
Eurcad Buy Swing FEB Week 1 Hi All ,
updated chart on this pair , we are waiting for tp1 , as you know this pair has taken forever lol , but we are still on track , the next move is rejection at 1.47637 and we might have a little sell scalp setup at the bullish extension of 1.48021 to 1.46554 where we would more buy entry to final tp .
Please note i'm not looking or actively wanting to sell euro till mid july/ aug . So will long any pullbacks .
Many Thanks .
EUR-CAD - ( Buy Long Period )Hi, This position is only for a Long period of time - estimated pips between 100 - 200 pips
Good luck! :)
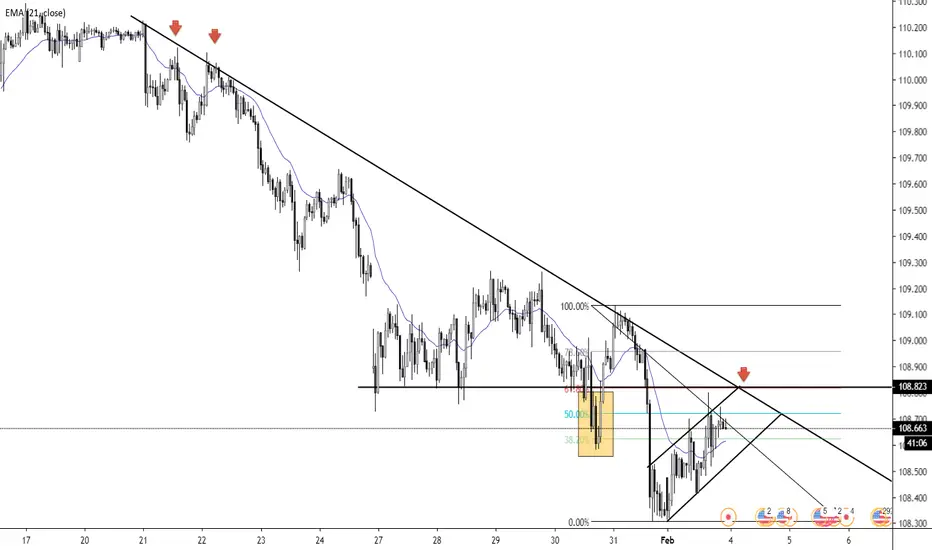
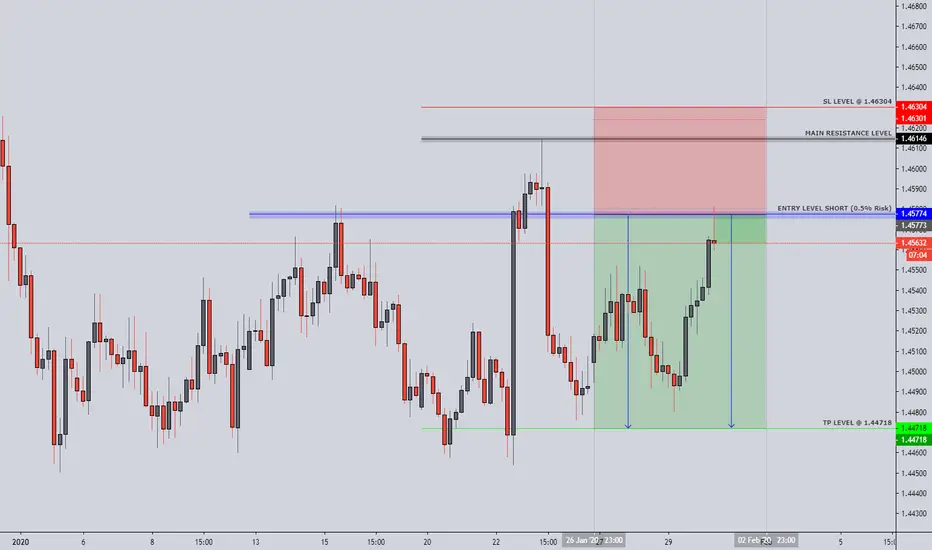
EURCAD - FOREX - 30. JAN. 2020Welcome to our weekly trade setup ( EURCAD )!
-
1 HOUR
Bullish break above previous H1 Highs.
4 HOUR
Prices came back to previous resistance zone.
DAILY
Bearish market in a pullback, great short entries!
-
FOREX SETUP
SELL EURCAD
ENTRY LEVEL @ 1.45770
SL @ 1.46300
TP @ 1.44720
RR: 2.0
Use 0.5% risk!
(Remember to add a few pips to all levels - different Brokers!)
Leave us a comment or like to keep our content for free and alive.
Have a great week everyone!
ALAN
EUR CAD BUY (EURO - CANADIAN DOLLAR)Hi there. Price is forming a reversal pattern to change its formation. Wait for the price to complete the pattern and watch strong price action for buy.

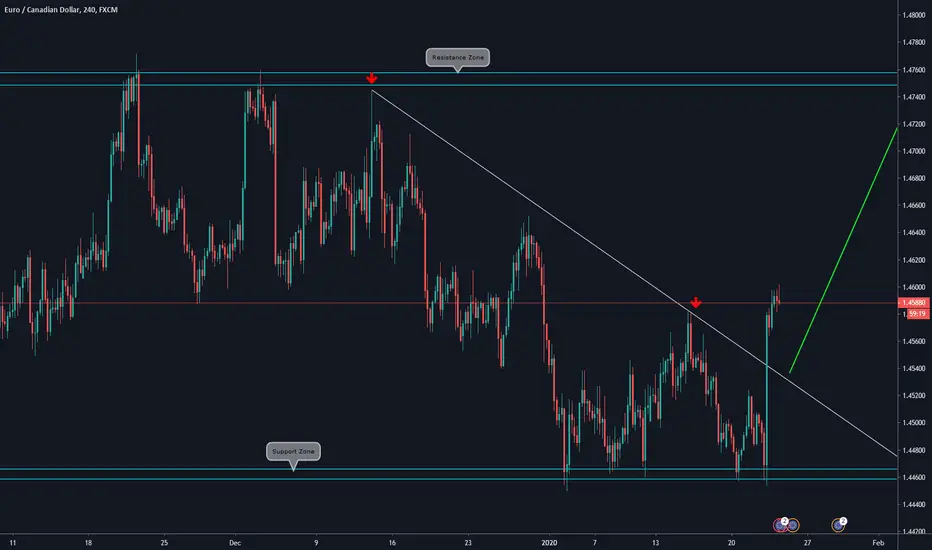
Bullish Scenario on EUR/CAD by ThinkingAntsOk4H CHART EXPLANATION:
Price was on a downtrend, but after bouncing at the Daily Support Zone (detailed on the chart below), it has broken the Descending Trendline. We are waiting for a retracement and consolidation to look for long entries on this pair.
DAILY CHART:
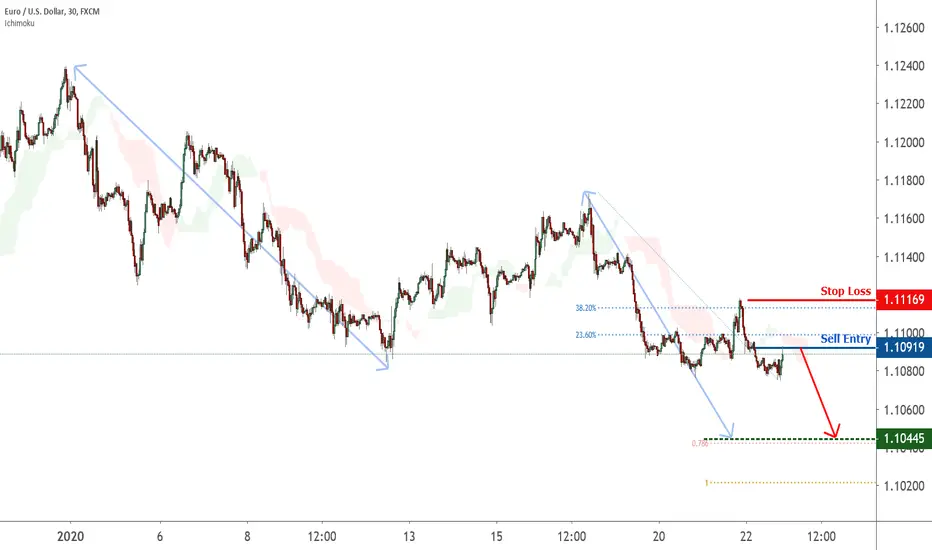
Possible trend shift in EURUSD – going short
The Tidal Shift Strategy has just sold EURUSD at 1.10835. The system recommends entering this trade at any price between 1.10751 and 1.10919. The signal was issued because our Speculative Sentiment Index has hit its most extreme positive level for the past 145 trading hours at 1.18192, which suggests that the EURUSD could be trending downwards.The 14-period Average True Range on a daily chart is 0.00067, so the stop loss has been set at 1.11169. This stop loss order is a trailing stop that will move down as the market moves down. There is no profit target for this strategy. We expect to be closed by the stop loss.Tidal Shift is a trend trading strategy that aims to catch shifts in trend using trader sentiment as an indicator. The strategy looks to buy when the Speculative Sentiment Index reaches its lowest value for the past 145 trading hours, and looks to short when it reaches its highest value for the past 145 trading hours.
Signal ID: 70356
Time Issued: Tuesday, 21 January 2020 22:00:16 GMT
Status: open
Entry: 1.10751 - 1.10919
Limit: N/A
Stop Loss: 1.11169
Any opinions, news, research, analyses, prices, other information, or links to third-party sites contained on this website are provided on an "as-is" basis, as general market commentary and do not constitute investment advice. The market commentary has not been prepared in accordance with legal requirements designed to promote the independence of investment research, and it is therefore not subject to any prohibition on dealing ahead of dissemination. Although this commentary is not produced by an independent source, FXCM takes all sufficient steps to eliminate or prevent any conflicts of interests arising out of the production and dissemination of this communication. The employees of FXCM commit to acting in the clients' best interests and represent their views without misleading, deceiving, or otherwise impairing the clients' ability to make informed investment decisions. For more information about the FXCM's internal organizational and administrative arrangements for the prevention of conflicts, please refer to the Firms' Managing Conflicts Policy. Please ensure that you read and understand our Full Disclaimer and Liability provision concerning the foregoing Information, which can be accessed here.
Past Performance is not an indicator of future results.
EURCAD sell signal op [50pips]
ENTRY: 1.45350+-
TP: 1.45050
TP2: 1.44850
SL: 1.45530
Chart time frame - 4H
Time for reaching TP - 1-2D
Follow, Like, Share or Comment
Thanks on supporting!
All best!
