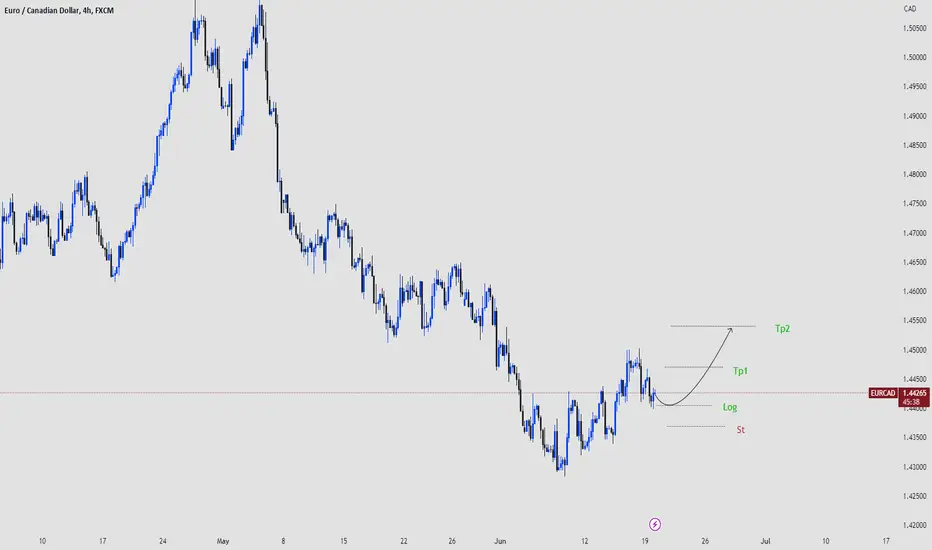
♦️ EURCAD ➡️ Buy 🔺We expect the specified targets from the price.
Log in ➡️ 1.44050
Tp1 ➡️ 1.44700 🟢
Tp2 ➡️ 1.45400 🟢
St ➡️ 1.43700 🔴
EUR-CAD
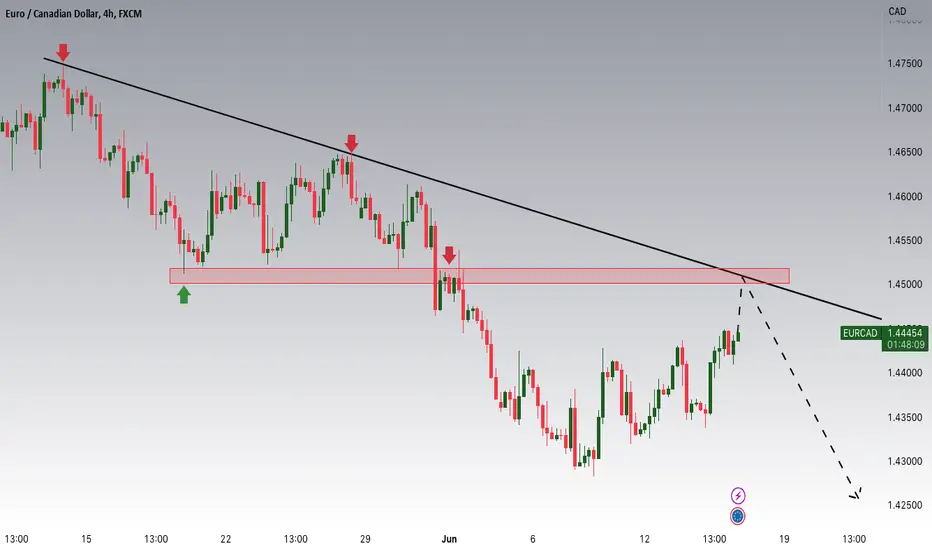
EURCAD Potential DownsidesHey Traders, our focus is on monitoring EURCAD for a potential selling opportunity within the 1.45000 zone. EURCAD is currently in a downtrend and appears to be consolidating while approaching a significant support and resistance zone at 1.45, which aligns with the major trend. Additionally, we should take into account the potential hawkishness of the Bank of Canada (BoC) when considering long positions on CAD.
Trade safe, Joe.
✨ NEW: EURCAD ✨ SWING TRADE ✨TP3 @ 1.4765 (closing ALL Buy Orders)
TP2 @ 1.4625 (shaving 25%)
TP1 @ 1.4466 (shaving 25%)
BSO @ 1.4375⏳
BLO @ 1.4315⏳
TECHNICAL ANALYSIS:
— The EURCAD is currently trading at 1.43431
— The moving averages are all pointing upwards, which is a bullish signal
— The RSI is in the overbought zone, which could signal a potential sell-off
— The MACD is crossing above the signal line, which is a bullish signal
Overall, the technical analysis for EURCAD is bullish. However, the RSI being in the overbought zone that could signal a potential sell-off. Based on this calculated guess, I'm going my chances with a Buy Order(see above)
HIGH IMPACT EVENTS:
— The economic outlook for the Eurozone and Canada
— The interest rate differential between the Eurozone and Canada
— Crude oil prices
— Geopolitical events
FUNDAMENTAL ANALYSIS
Interest Rates:
The European Central Bank (ECB) has raised interest rates twice in 2022, while the Bank of Canada (BoC) has raised rates four times. This has put upward pressure on the Canadian dollar and downward pressure on the euro.
Inflation:
Inflation is slightly higher in Canada. This could lead to further BoC rate hikes, which would continue to put downward pressure on the euro.

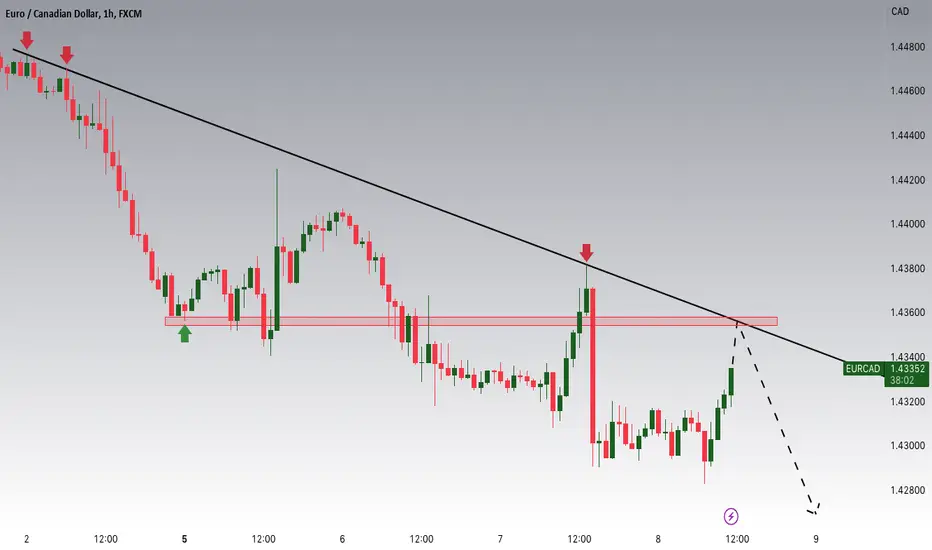
EURCAD Potential DownsidesHey Traders, in today's trading session we are monitoring EURCAD for a selling opportunity around 1.43600 zone, EURCAD is trading in a downtrend and currently is in a correction phase in which it is approaching the major trend at 1.43600 support and resistance zone.
Trade safe, Joe.
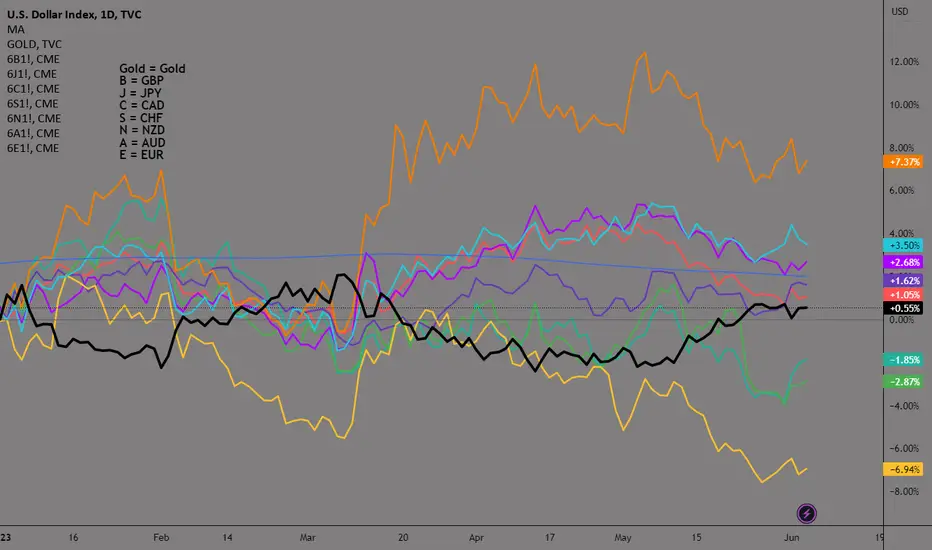
Year To Date Currency PerformanceSee Chart For Currency Performance YTD
Gold biggest performer while JPY the weakest.
Ecad pullback to short**Find out more from my Tradingview Stream this week**
***************************************************************************************
Hello there!
If you like my analysis and it helped you ,do give me a thumbs ups on tradingview! 🙏
And if you would like to show further support for me, you can gift me some coins on tradingview! 😁
Thank you!
Disclaimers:
The analysis shared through this channel are purely for educational and entertainment purposes only. They are by no means professional advice for individual/s to enter trades for investment or trading purposes.
The author/producer of these content shall not and will not be responsible for any form of financial/physical/assets losses incurred from trades executed from the derived conclusion of the individual from these content shared.
Thank you, and please do your due diligence before any putting on any trades!
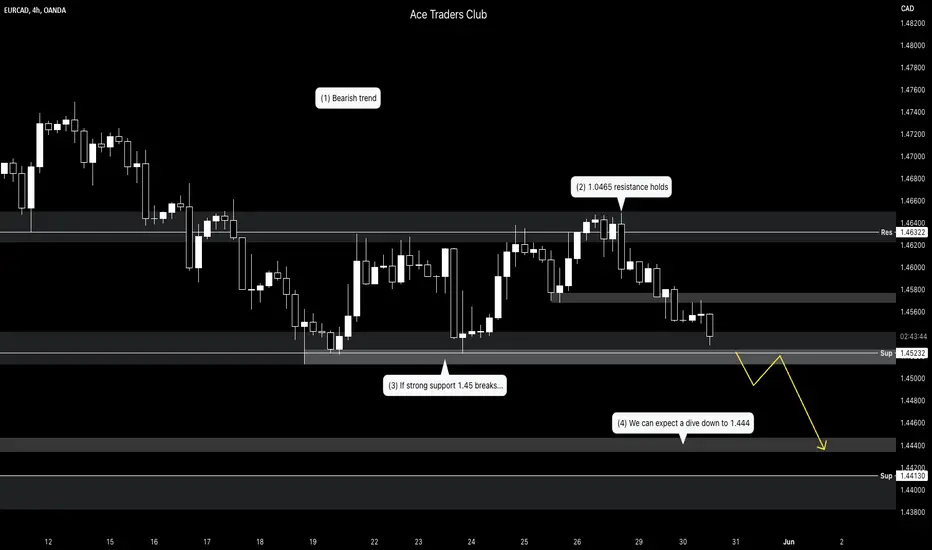
EURCAD Downside PotentialHey Traders! 👋
For Day 19/100 of our challenge, we will look at EURCAD downside potential this week.
- Recently rejected 1.0465 resistance
- Now heading towards 1.45 strong support
- When 1.45 breaks, we can expect 1.444 to be met
This is based on seasonality and retail positioning. Check them out for yourselves 👍
Have a great start to the week. Hope you enjoyed your holiday 🥂
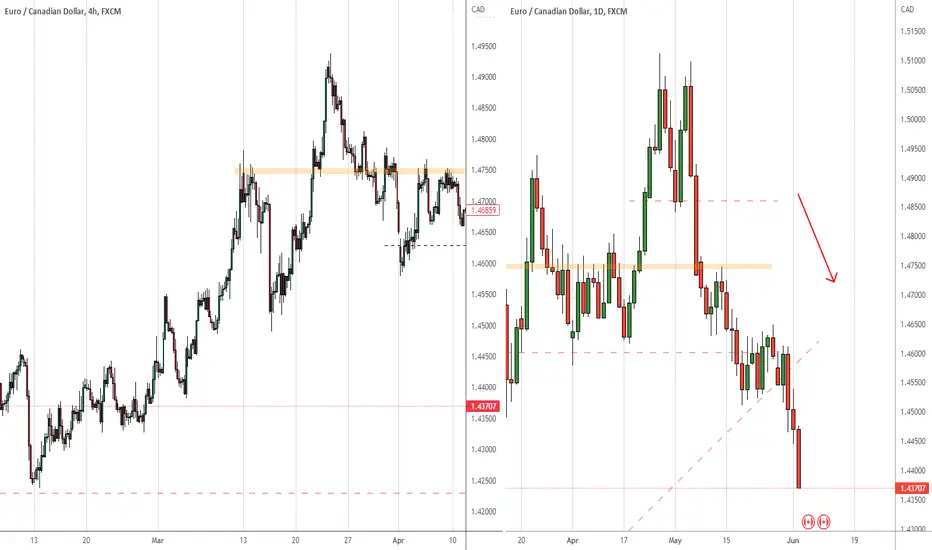
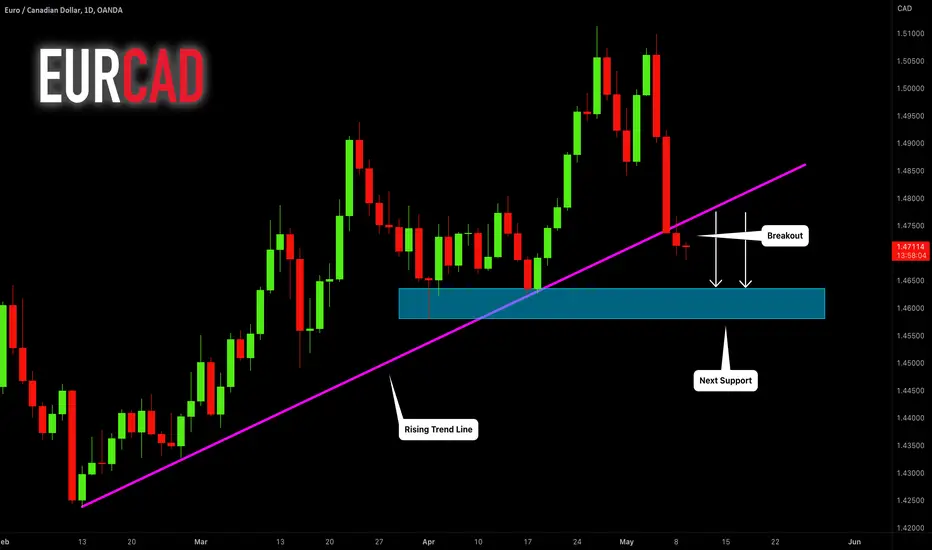
EURCAD: Important Breakout 🇪🇺🇨🇦
EURCAD broke and closed below a solid rising trend line on a daily.
It looks like the pair may go lower now.
Next support - 1.4646
For entries, consider the occasional retest of a broken trend line.
❤️Please, support my work with like, thank you!❤️
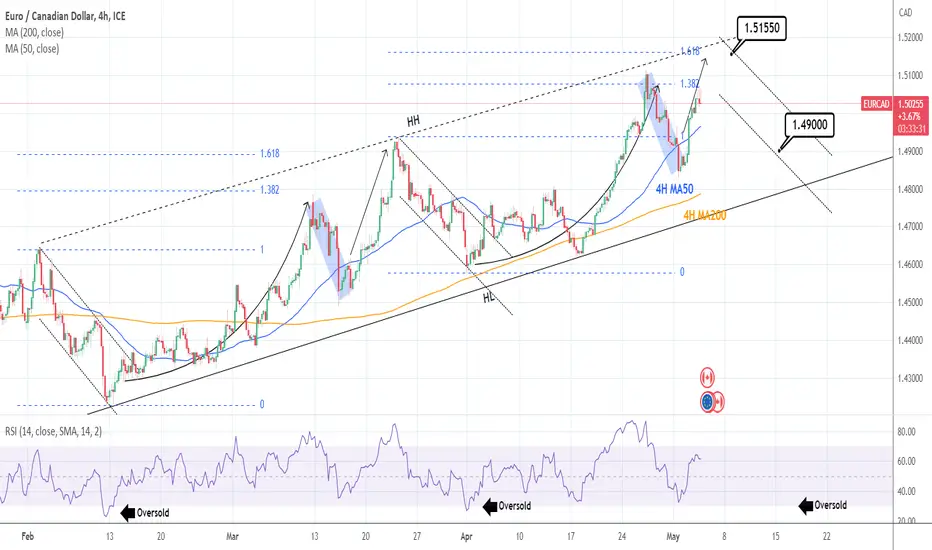
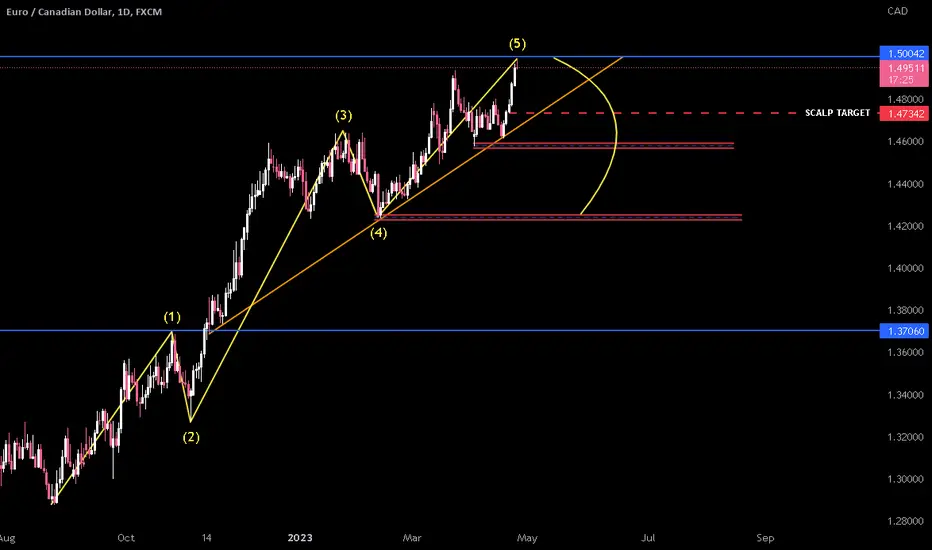
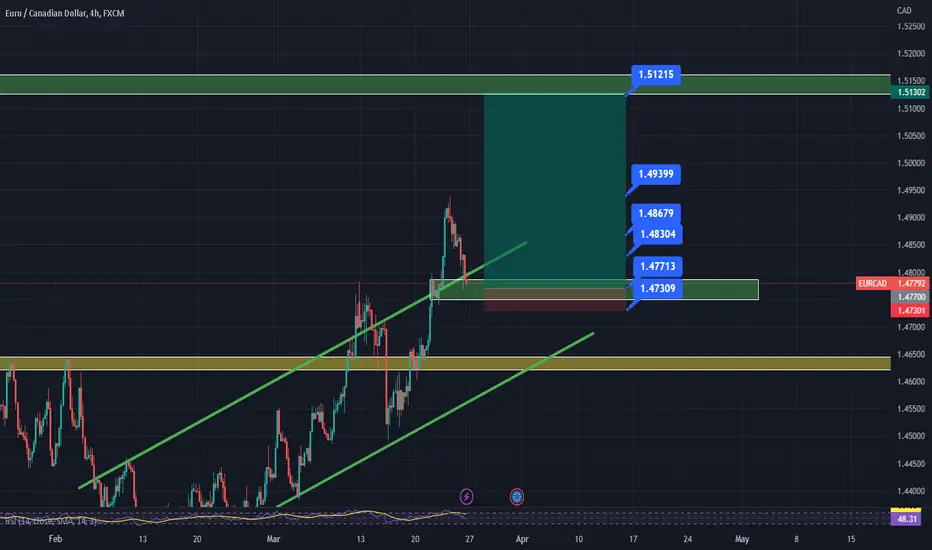
EURCAD: Last buy round then sell to the 4H MA200.EURCAD is on a very consistent bullish pattern since February giving low risk buy signals on the HL trendline and sell signals on the HH trendline. This is well illustrated by the bullish technicals on the 1D time-frame (RSI = 63.779, MACD = 0.009, ADX = 34.173). The price is currently on the final bullish wave to the HH trendline, and we will stay long with TP = 1.51550. That is the 1.618 Fibonacci extension, which marked the previous Higher High (HH). Then we will sell targeting the 4H MA200 (TP = 1.4900).
Prior idea:
## If you like our free content follow our profile to get more daily ideas. ##
## Comments and likes are greatly appreciated. ##

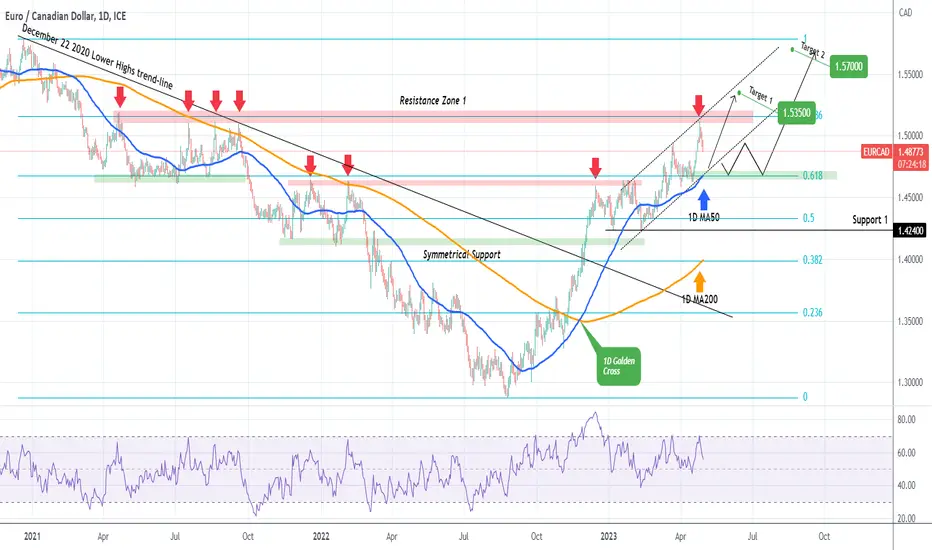
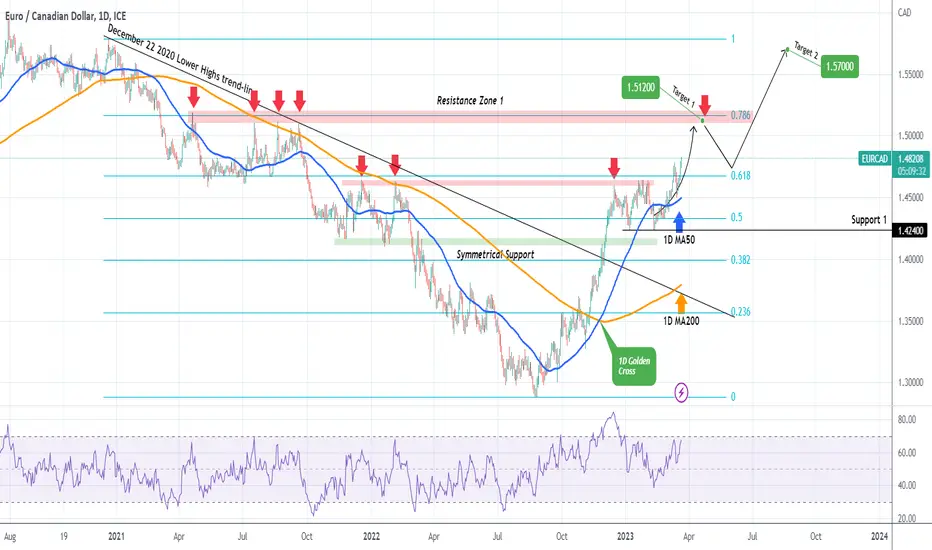
EURCAD Halfway to its long-term buy zone.The EURCAD pair hit the first target we set on our late-March analysis:
The pattern that emerges is a Channel Up and the next high probability buy entry is located exactly at its bottom on the 1D MA50 (blue trend-line). If the price breaks below the Channel Up, we may see a prolonged accumulation on the 0.618 Fibonacci level. As you see the Fibonacci levels have been targeted since the rise started last August and filled the gaps on all Lower Highs during the Bear market. The next gap to be filled is none other than the December 22 2021 High. Our long-term target in both scenarios is 1.57000.
-------------------------------------------------------------------------------
** Please LIKE 👍, FOLLOW ✅, SHARE 🙌 and COMMENT ✍ if you enjoy this idea! Also share your ideas and charts in the comments section below! **
-------------------------------------------------------------------------------
💸💸💸💸💸💸
👇 👇 👇 👇 👇 👇
EUR CAD | TRADE ALERT | DECRYPTERS HI People Welcome to Decrypters
A potential TRADE SHort Setup for EURCAD
Swing Setup
Ecad breakout and should continue higherEcad has broke out of its consolidation and likely to go higher...just wait for pullbacks
**Find out more from my Tradingview Stream this week**
***************************************************************************************
Hello there!
If you like my analysis and it helped you ,do give me a thumbs ups on tradingview! 🙏
And if you would like to show further support for me, you can gift me some coins on tradingview! 😁
Thank you!
Disclaimers:
The analysis shared through this channel are purely for educational and entertainment purposes only. They are by no means professional advice for individual/s to enter trades for investment or trading purposes.
The author/producer of these content shall not and will not be responsible for any form of financial/physical/assets losses incurred from trades executed from the derived conclusion of the individual from these content shared.
Thank you, and please do your due diligence before any putting on any trades!
EURCAD long idea — higher high breakEURCAD broke above a significant higher high zone. There is a slimmer chance that it will go down at resistance now since price already broke above resistance level. Just look for a nice break above with a nice pullback and the chances are higher for trend continuation up.
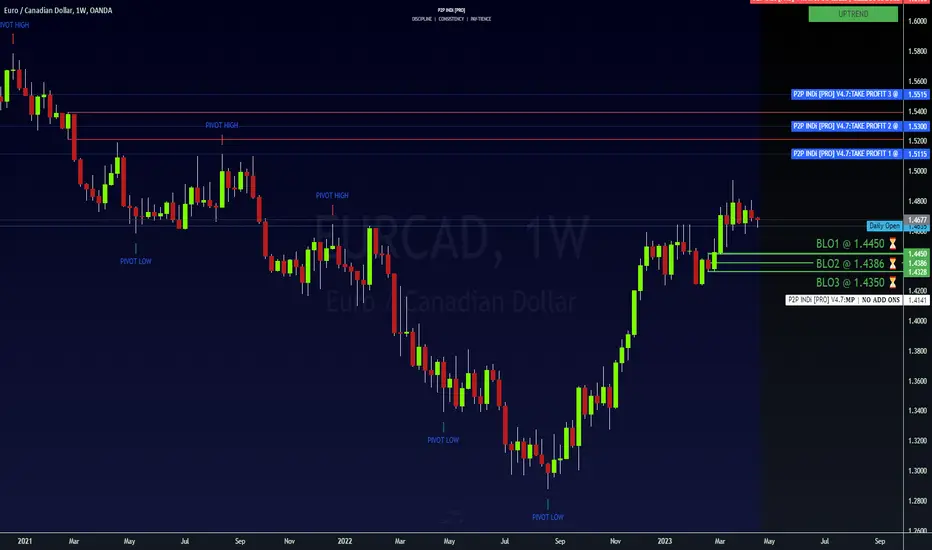
✨ EURCAD...UT (10M/1W) ✨From Today's Webinar
TP3 1.5515 (close trade)
TP2 @ 1.5300 (shave 50%)
TP1 @ 1.5115 (shave 50%)
BLO1 @ 1.4450 📈⏳
BLO2 @ 1.4386 📈⏳
BLO3 @ 1.4350 📈⏳
ADDITIONAL INFO:
— If PA, returns to the Demand Zone (1W) around the 144.00 range then we'll have an amazing long term uptrend opportunity.
— Since the Zone is large. I have chosen to Dollar-Cost-Average (DCA) my entry with three Buy Orders (see above)
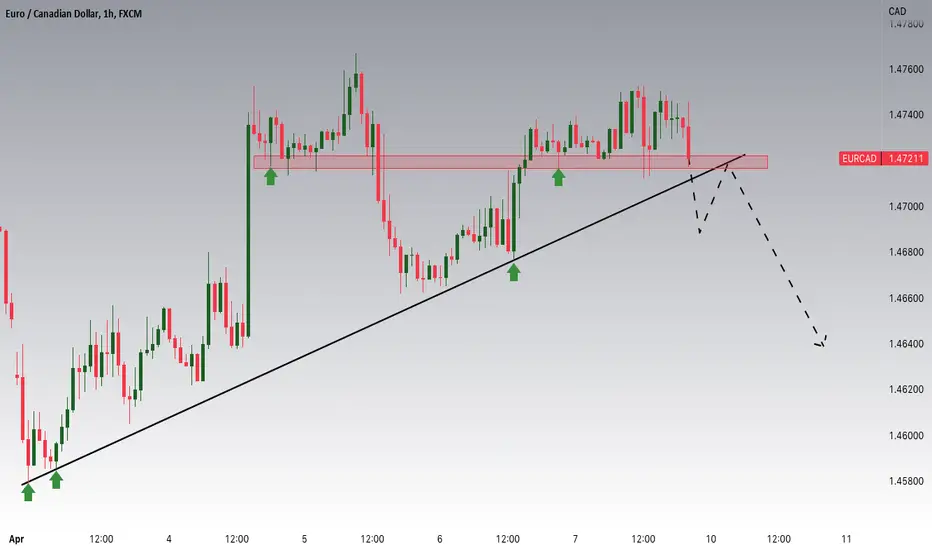
EURCAD Potential DownsidesHey Traders, in tomorrow's trading session we are monitoring EURCAD for a selling opportunity around 1.472 zone, EURCAD is trading in an uptrend but with current CAD positive data we can get a CAD outperformance against the EUR. so if we get any dips below the trend i would be considering a potential retrace of the trend around 1.472 support and resistance zone towards more lows.
Trade safe, Joe.
EurCad generally still on the upa potential inverted H&S..could see more up side once 1.4760 is cleared...
**Find out more from my Tradingview Stream this week**
***************************************************************************************
Hello there!
If you like my analysis and it helped you ,do give me a thumbs ups on tradingview! 🙏
And if you would like to show further support for me, you can gift me some coins on tradingview! 😁
Thank you!
Disclaimers:
The analysis shared through this channel are purely for educational and entertainment purposes only. They are by no means professional advice for individual/s to enter trades for investment or trading purposes.
The author/producer of these content shall not and will not be responsible for any form of financial/physical/assets losses incurred from trades executed from the derived conclusion of the individual from these content shared.
Thank you, and please do your due diligence before any putting on any trades!

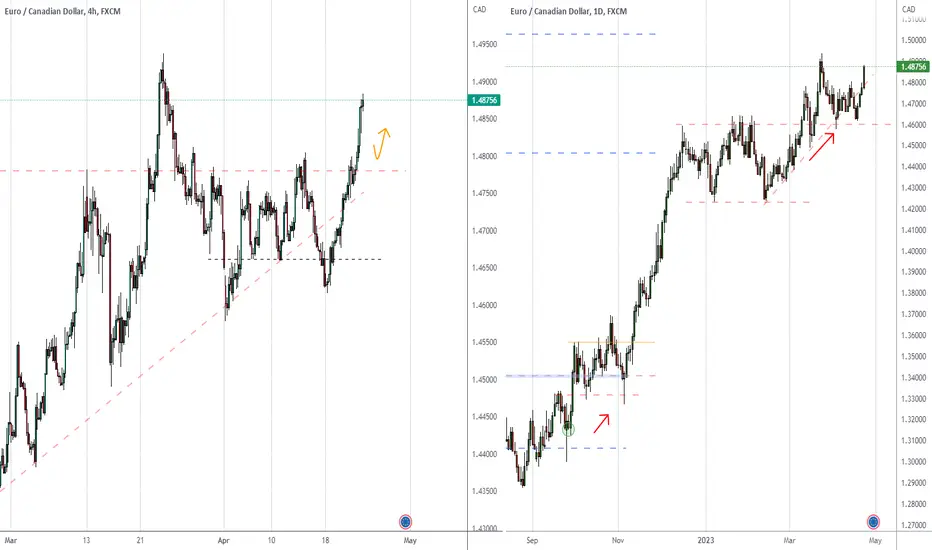
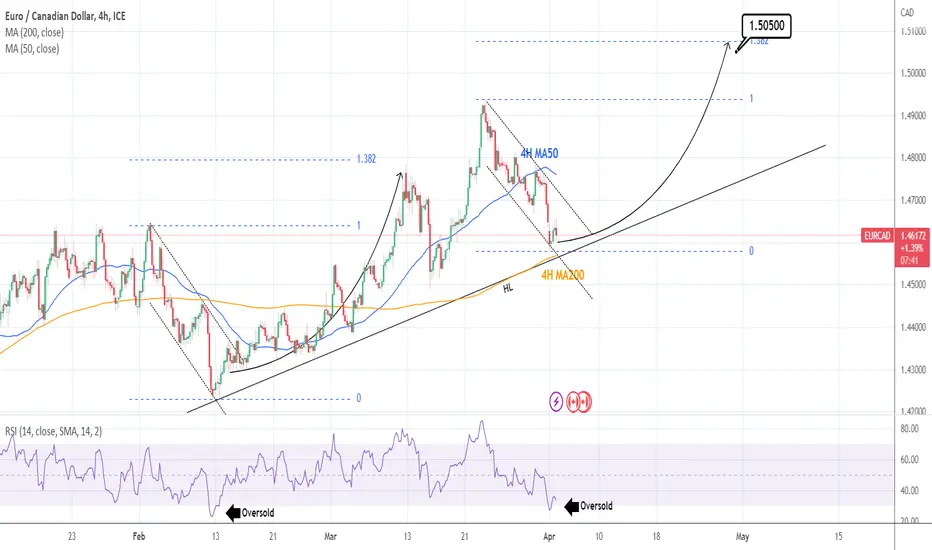
EURCAD: Buy opportunity on the HL trendline and 4H MA200.EURCAD nearly touched the two month HL trendline and the 4H MA200 today. With the 4H technical outlook on the red (RSI = 33.840, MACD = 09.994, ADX = 36.630) this is a strong buy opportunity on a one month time frame. The RSI getting oversold and rebounding, is following the path of the February 10th Low which rose slowly to nearly the 1.382 Fibonacci extension. We are buying, TP = 1.050500.
## If you like our free content follow our profile to get more daily ideas. ##
## Comments and likes are greatly appreciated. ##
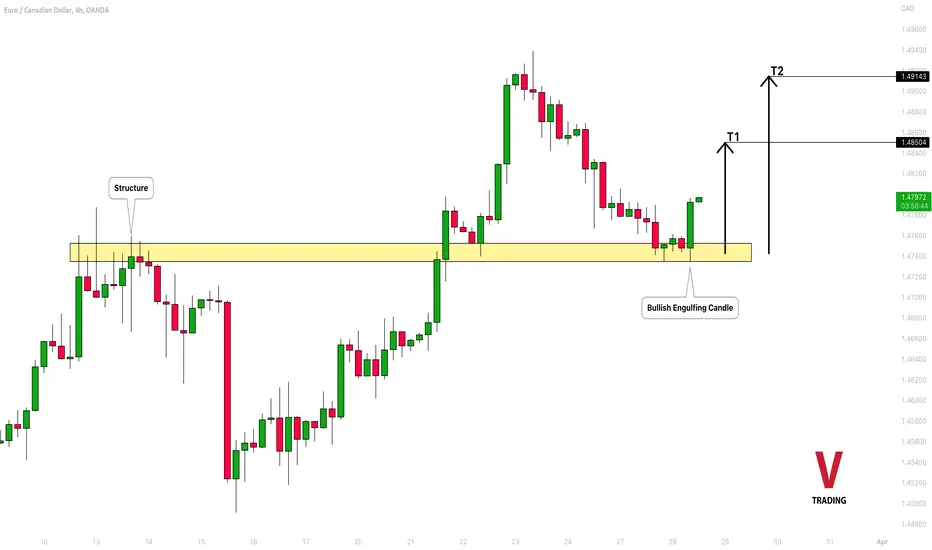
EURCAD: One More Bullish Move Ahead 🇪🇺🇨🇦
EURCAD is taking off from a solid horizontal structure support.
The price formed a bullish engulfing candle on a 4H time frame,
engulfing the range of the last 4 candles.
Chances will be high to see a movement up.
Goals: 1.485 / 1.4914
❤️Please, support my work with like, thank you!❤️
eurcadthis will be my next idea for eurcad it will respect these zone and gonna up if reach stop i will hold sell stop idea
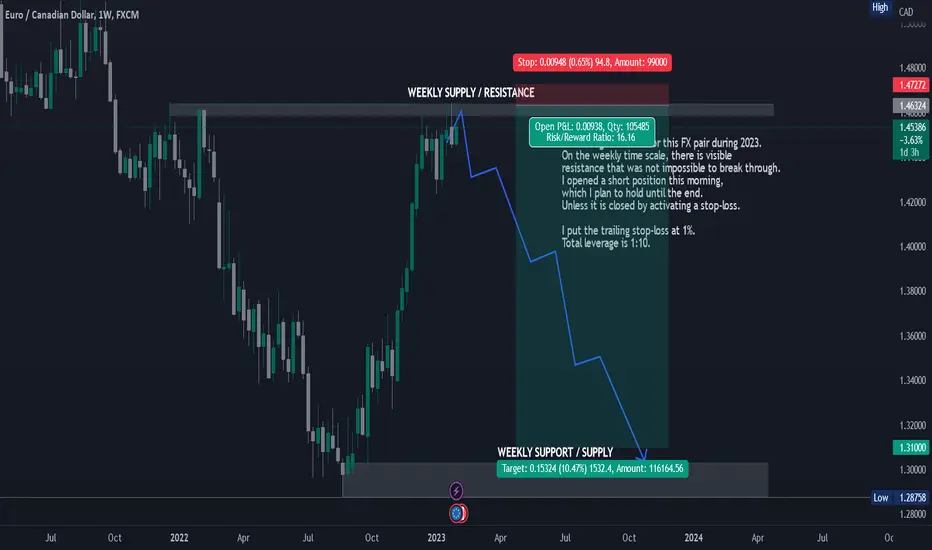
Weekly timeframe - Short EURCAD As it can be seen in the chart, I decided to make a big short on this pair.
Technically, I think it's clear why I think this could happen.
Also, I'll put extra chart with daily time-frame in the description with another reason why I did this.
Also, today's ECB's report - it's hawkish, at least that's what they want it to sound like. But, I think the market will show middle finger, and go opposite direction.
Why? They're to slow with interest rate hikes, and current jump in the Euro strength was just "a dead cat bounce".
This is one big position.
I have another with daily time-frame, and more on a 1H time-frame. :)
Go CAD. :D
EURCAD Bullish supported by the 1D MA50.The EURCAD pair has followed our projected path since the start of the year and recently broke above former Resistance 1:
This was a bullish break-out signal, with Target 1 being at 1.51200. A rejection and pull-back to the 1D MA50 (blue trend-line) again, will be a new buy, with our Target being a little below the December 22 2020 Top at 1.5700.
-------------------------------------------------------------------------------
** Please LIKE 👍, FOLLOW ✅, SHARE 🙌 and COMMENT ✍ if you enjoy this idea! Also share your ideas and charts in the comments section below! **
-------------------------------------------------------------------------------
💸💸💸💸💸💸
👇 👇 👇 👇 👇 👇
EURCAD | LOOKS LIKE IT COULD BE A GOOD BUYHi everyone and happy Monday! :) Let's start from the monthly: the price is aiming to break MA 50 and MA 100, and on the weekly, we have already crossed MA 200, which is a HTF confirmation suggesting a bullish bias in the market. Strong break through the daily resistance and the 4-hour bullish engulfing candlestick closure to confirm our entry. Today we will have two speeches by President Lagarde, one at 2 p.m. and the next at 4 p.m., so please keep that in mind.
