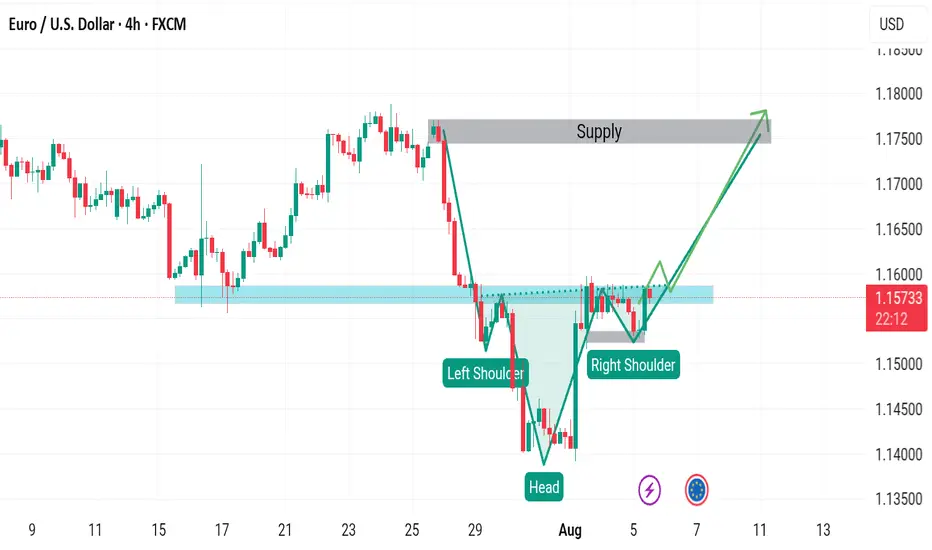
EURUSD BUY SETUPThe price will form a head and shoulders pattern because the candle in the second shoulder is very strong, which indicates that it will break the neck of the pattern. We also have a stronger bounce from below, so I expect an uptrend.
EUR (Euro)
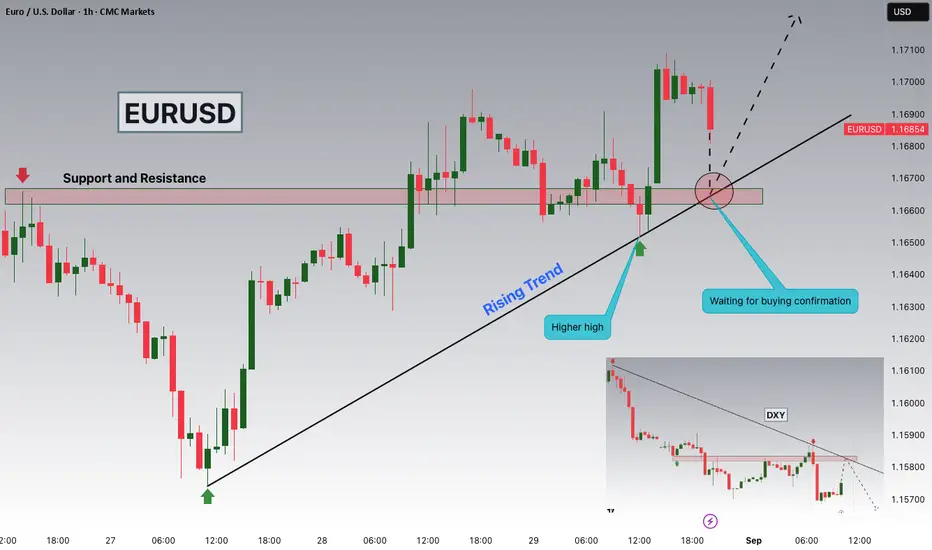
EURUSD Watching 1.16600 Support as Dollar Weakness PersistsHey Traders, in the coming week we are monitoring EURUSD for a buying opportunity around the 1.16600 zone. EURUSD remains in an uptrend and is currently undergoing a correction phase, approaching a key support/resistance level at 1.16600.
Meanwhile, the US Dollar Index (DXY) continues to trade in a downtrend and is nearing resistance around the 98.000 zone. The dovish stance from the Federal Reserve, coupled with growing expectations for potential rate cuts in September, is adding consistent selling pressure on the dollar — increasing the probability for further EURUSD upside.
Trade safe,
Joe.
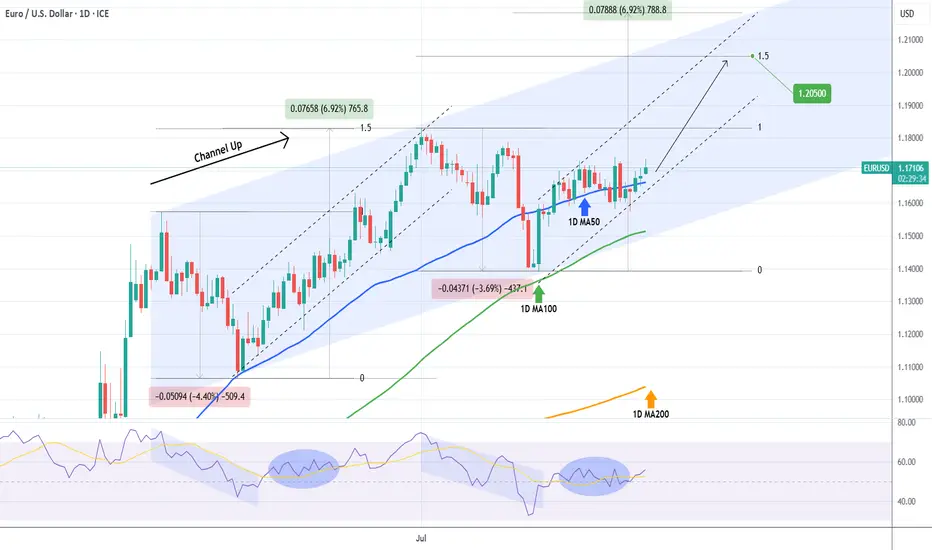
EURUSD Channel Up aiming at 1.20500The EURUSD pair has been trading within a Channel Up since the April 21 High and is on its new Bullish Leg since the Higher Low bottom on the 1D MA100 (green trend-line).
Having flipped the 1D MA50 (blue trend-line) into Support, the 1D RSI shows that we are on a symmetrical level similar to June 10 2025. We expect the Bullish Leg to reach the 1.5 Fibonacci extension (at least) just like the previous one did. Our Target is 1.20500.
-------------------------------------------------------------------------------
** Please LIKE 👍, FOLLOW ✅, SHARE 🙌 and COMMENT ✍ if you enjoy this idea! Also share your ideas and charts in the comments section below! This is best way to keep it relevant, support us, keep the content here free and allow the idea to reach as many people as possible. **
-------------------------------------------------------------------------------
💸💸💸💸💸💸
👇 👇 👇 👇 👇 👇
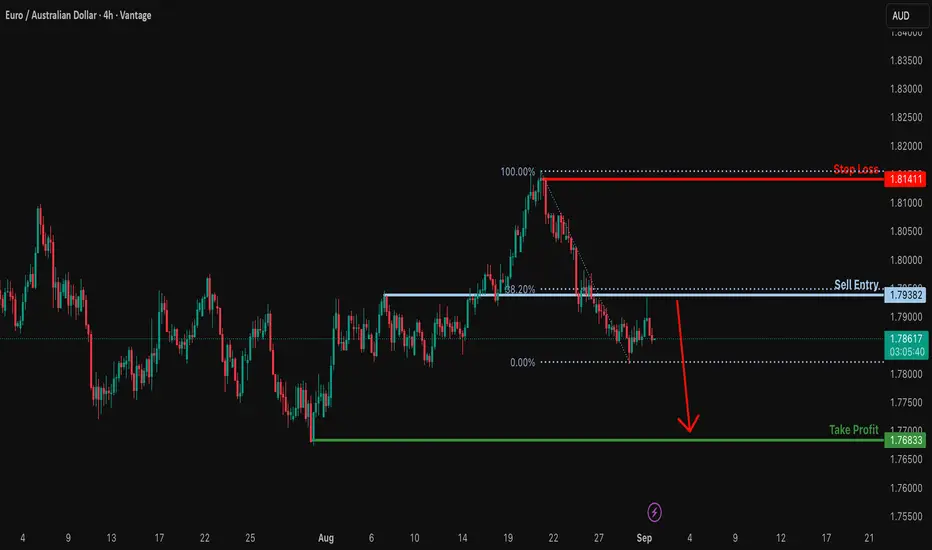
Potential bearish drop off?EUR/AUD has rejected off the resistance level, which is an overlap resistance that aligns with the 38.2% Fibonacci retracement, and could drop from this level to our take profit.
Entry: 1.7938
Why we like it:
There is an overlap resistance that aligns with the 38.2% Fibonacci retracement.
Stop loss: 1.8141
Why we like it:
There is a swing high resistance level.
Take profit: 1.7683
Why we like it:
There is a swing low support.
Enjoying your TradingView experience? Review us!
Please be advised that the information presented on TradingView is provided to Vantage (‘Vantage Global Limited’, ‘we’) by a third-party provider (‘Everest Fortune Group’). Please be reminded that you are solely responsible for the trading decisions on your account. There is a very high degree of risk involved in trading. Any information and/or content is intended entirely for research, educational and informational purposes only and does not constitute investment or consultation advice or investment strategy. The information is not tailored to the investment needs of any specific person and therefore does not involve a consideration of any of the investment objectives, financial situation or needs of any viewer that may receive it. Kindly also note that past performance is not a reliable indicator of future results. Actual results may differ materially from those anticipated in forward-looking or past performance statements. We assume no liability as to the accuracy or completeness of any of the information and/or content provided herein and the Company cannot be held responsible for any omission, mistake nor for any loss or damage including without limitation to any loss of profit which may arise from reliance on any information supplied by Everest Fortune Group.
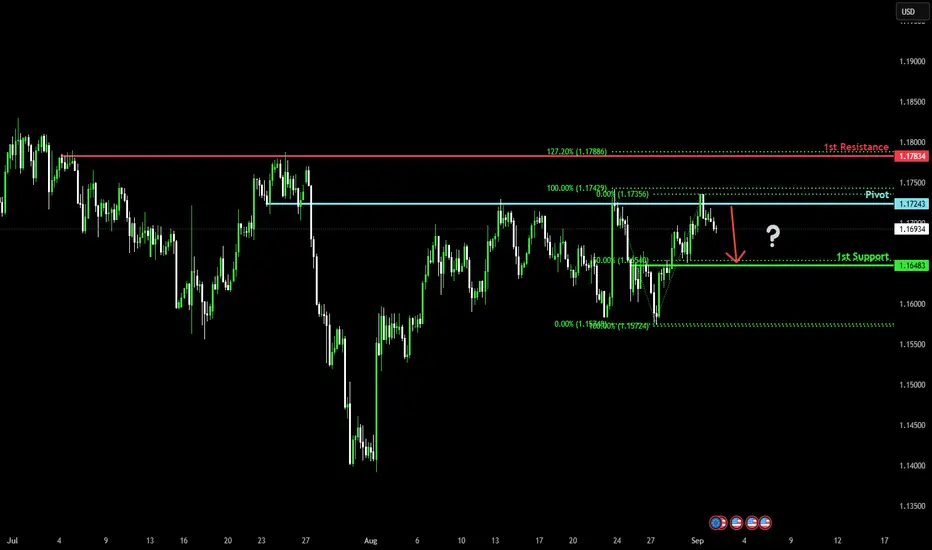
Bearish reversal in play: Key resistance holding strongThe Fiber (EUR/USD) has rejected off the pivot and could drop to the 1st support that aligns with the 50% Fibonacci retracement.
Pivot: 1.1724
1st Resistance: 1.1783
1st Support: 1.1648
Risk Warning:
Trading Forex and CFDs carries a high level of risk to your capital and you should only trade with money you can afford to lose. Trading Forex and CFDs may not be suitable for all investors, so please ensure that you fully understand the risks involved and seek independent advice if necessary.
Disclaimer:
The above opinions given constitute general market commentary, and do not constitute the opinion or advice of IC Markets or any form of personal or investment advice.
Any opinions, news, research, analyses, prices, other information, or links to third-party sites contained on this website are provided on an "as-is" basis, are intended only to be informative, is not an advice nor a recommendation, nor research, or a record of our trading prices, or an offer of, or solicitation for a transaction in any financial instrument and thus should not be treated as such. The information provided does not involve any specific investment objectives, financial situation and needs of any specific person who may receive it. Please be aware, that past performance is not a reliable indicator of future performance and/or results. Past Performance or Forward-looking scenarios based upon the reasonable beliefs of the third-party provider are not a guarantee of future performance. Actual results may differ materially from those anticipated in forward-looking or past performance statements. IC Markets makes no representation or warranty and assumes no liability as to the accuracy or completeness of the information provided, nor any loss arising from any investment based on a recommendation, forecast or any information supplied by any third-party.
EURCHF: Expecting Bearish Continuation! Here is Why:
The price of EURCHF will most likely collapse soon enough, due to the supply beginning to exceed demand which we can see by looking at the chart of the pair.
Disclosure: I am part of Trade Nation's Influencer program and receive a monthly fee for using their TradingView charts in my analysis.
❤️ Please, support our work with like & comment! ❤️
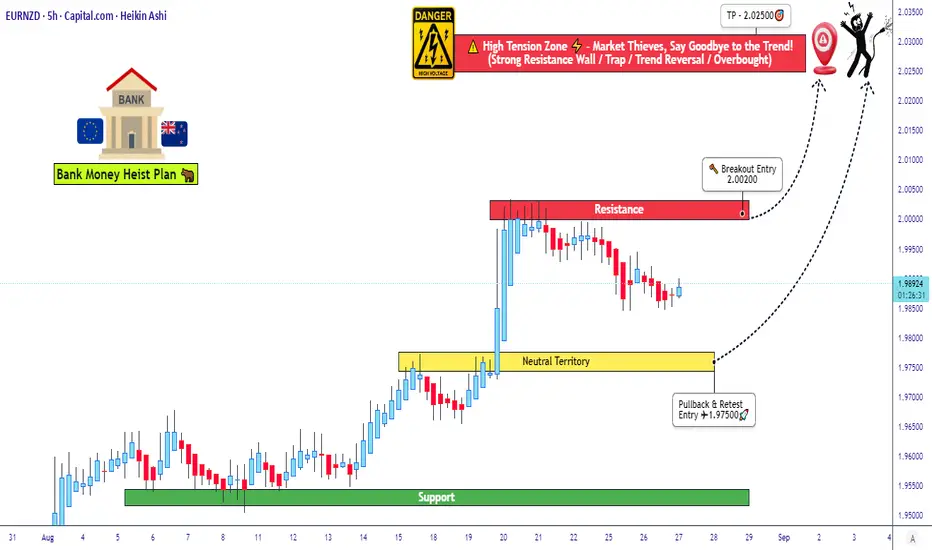
Ready To Raid This EUR/NZD Bullish Breakout With Me?🦹♂️⚡ HEIST ALERT: EUR/NZD BULLISH BREAKOUT INBOUND! ⚡🦹♂️
Asset: EUR/NZD "Euro vs Kiwi" Forex Bank (Swing/Day Heist)
Plan: BULLISH (Pending Order Layering Plan)
🎯 THE MASTER PLAN:
Dear Money Makers & Robbers! 🤑💰 Based on the 🔥Thief Trading Style Analysis🔥, we are plotting a BULLISH HEIST on the Euro vs Kiwi bank! Our intel suggests a major breakout is brewing. Time to load up and ride the lightning! ⚡
📍 ENTRY - THE HEIST IS ON!:
⚡ Phase 1: Breakout Entry @ 2.00200
Wait for the level to get SMASHED! Set a BUY STOP order to catch the explosive move.
♻️ Phase 2: Pullback & Layer Entry @ 1.97500 & ABOVE
True Thief style! We use LAYERS! After the breakout, place BUY LIMIT orders on any pullback toward 1.97500. This is how the pros stack the cash! 💵💵
📢 YO, LISTEN UP! 🗣️ Set a TRADINGVIEW ALARM 🔔 at 2.00200! Don't miss the breakout signal. A true thief is always prepared!
🛑 STOP LOSS - PROTECT THE BOOTY:
• Breakout Entry SL: This is the Thief's secret SL @ 1.99000
• Pullback/Layer Entry SL: Place your hideout @ 1.96000
📌IMPORTANT INSTRUCTION: Do NOT place your stop loss until AFTER the breakout or pullback entry is triggered! Place it only after you're in the trade. Adjust your final SL based on your own risk and strategy, you rebellious pirates! 🏴☠️⚠️
🎯 TARGET - ESCAPE WITH THE LOOT:
• Final Target: @ 2.02500 🎯
The top is a high-voltage area! ⚡ The market will be overbought and the guards will be alert. Take your stolen profits and ESCAPE before the trend reverses! Don't get greedy! Cash out and treat yourself, you deserve it! 🏆💸🍾
⚠️ GENERAL ORDERS:
• News Releases: Avoid new trades during high-impact news. Manage your running positions! 📰🗞️
• This is not personalized advice. This is our heist plan. Your risk is your own! 👊
• Boost this idea! 💥 Hit the Boost Button 💥 to support the crew and help us plot more profitable heists! 🚀🤝❤️
I'll see you at the target, thieves! Stay tuned for the next score! 🤑👊
#Forex #Trading #EURNZD #TradingPlan #PriceAction #SwingTrading #DayTrading #ForexSignals #Breakout #Bullish #Buy #TechnicalAnalysis #ThiefTrader #ForexLife #Profit #Investing #AlgorithmicTrading #SwingTrade
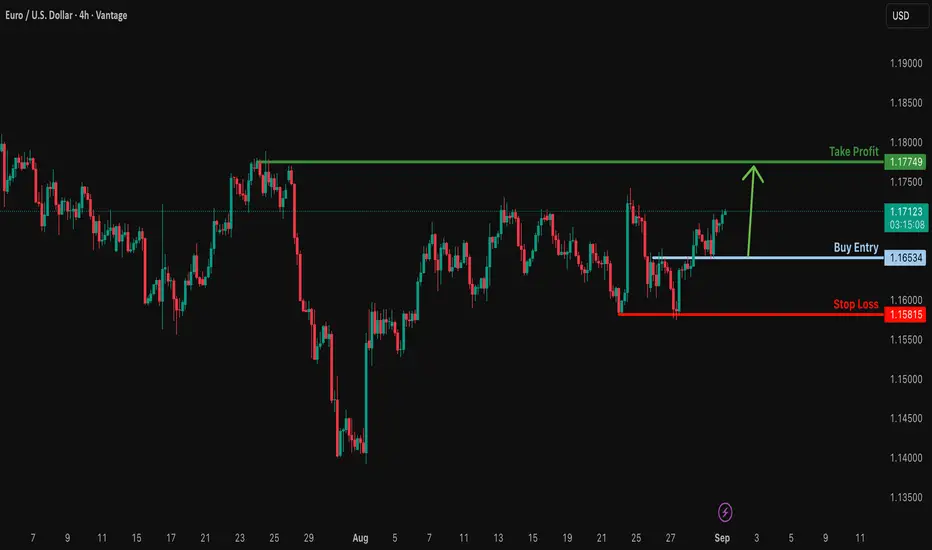
Bullish Rise on EUR/USD – Key Support Holding?EUR/USD has bounced off the support level which is a pullback support, and could potentially rise from this level to our take profit.
Entry: 1.1653
Why we like it:
There is a pullback support.
Stop loss: 1.1581
Why we like it:
There is a multi-swing low support.
Take profit: 1.1774
Why we like it:
There is a swing high resistance.
Enjoying your TradingView experience? Review us!
Please be advised that the information presented on TradingView is provided to Vantage (‘Vantage Global Limited’, ‘we’) by a third-party provider (‘Everest Fortune Group’). Please be reminded that you are solely responsible for the trading decisions on your account. There is a very high degree of risk involved in trading. Any information and/or content is intended entirely for research, educational and informational purposes only and does not constitute investment or consultation advice or investment strategy. The information is not tailored to the investment needs of any specific person and therefore does not involve a consideration of any of the investment objectives, financial situation or needs of any viewer that may receive it. Kindly also note that past performance is not a reliable indicator of future results. Actual results may differ materially from those anticipated in forward-looking or past performance statements. We assume no liability as to the accuracy or completeness of any of the information and/or content provided herein and the Company cannot be held responsible for any omission, mistake nor for any loss or damage including without limitation to any loss of profit which may arise from reliance on any information supplied by Everest Fortune Group.
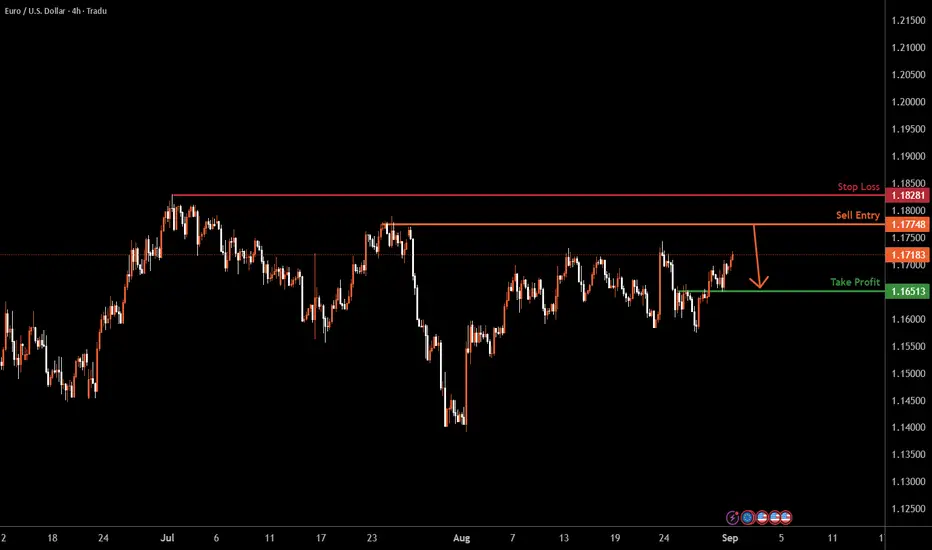
EURUSD H4 | Price approaching swing high resistanceBased on the H4 chart analysis, we could see the price rise to the sell entry, which acts as a swing high resistance and could reverse from this level to the take profit.
Sell entry is at 1.1774, which is a swing high resistance.
Stop loss is at 1.1828, which is also a swing high resistance.
Take profit is at 1.1651, which is a pullback support.
High Risk Investment Warning
Trading Forex/CFDs on margin carries a high level of risk and may not be suitable for all investors. Leverage can work against you.
Stratos Markets Limited (tradu.com ):
CFDs are complex instruments and come with a high risk of losing money rapidly due to leverage. 65% of retail investor accounts lose money when trading CFDs with this provider. You should consider whether you understand how CFDs work and whether you can afford to take the high risk of losing your money.
Stratos Europe Ltd (tradu.com ):
CFDs are complex instruments and come with a high risk of losing money rapidly due to leverage. 66% of retail investor accounts lose money when trading CFDs with this provider. You should consider whether you understand how CFDs work and whether you can afford to take the high risk of losing your money.
Stratos Global LLC (tradu.com ):
Losses can exceed deposits.
Please be advised that the information presented on TradingView is provided to Tradu (‘Company’, ‘we’) by a third-party provider (‘TFA Global Pte Ltd’). Please be reminded that you are solely responsible for the trading decisions on your account. There is a very high degree of risk involved in trading. Any information and/or content is intended entirely for research, educational and informational purposes only and does not constitute investment or consultation advice or investment strategy. The information is not tailored to the investment needs of any specific person and therefore does not involve a consideration of any of the investment objectives, financial situation or needs of any viewer that may receive it. Kindly also note that past performance is not a reliable indicator of future results. Actual results may differ materially from those anticipated in forward-looking or past performance statements. We assume no liability as to the accuracy or completeness of any of the information and/or content provided herein and the Company cannot be held responsible for any omission, mistake nor for any loss or damage including without limitation to any loss of profit which may arise from reliance on any information supplied by TFA Global Pte Ltd.
The speaker(s) is neither an employee, agent nor representative of Tradu and is therefore acting independently. The opinions given are their own, constitute general market commentary, and do not constitute the opinion or advice of Tradu or any form of personal or investment advice. Tradu neither endorses nor guarantees offerings of third-party speakers, nor is Tradu responsible for the content, veracity or opinions of third-party speakers, presenters or participants.
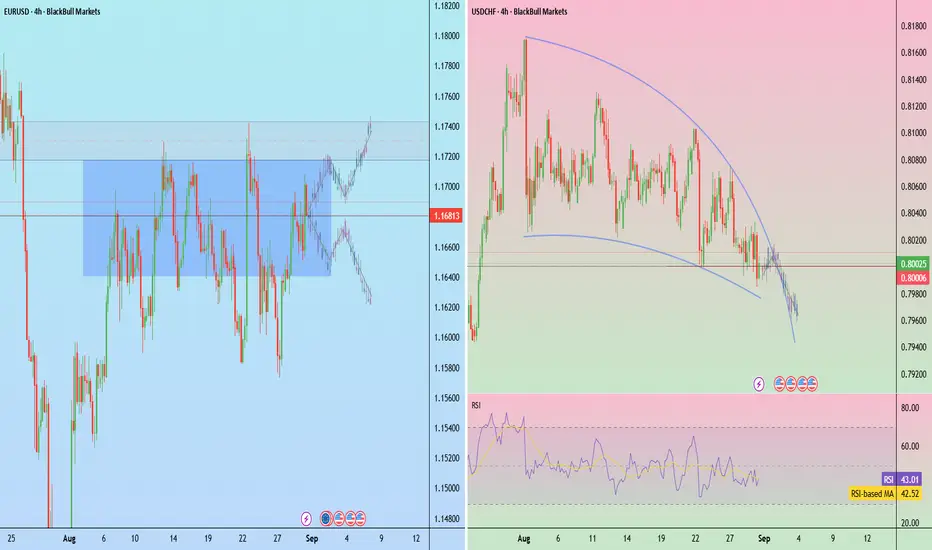
EUR/USD range and USD/CHF breakdown risk into payrollsIn a shortened US week, August jobs data will be the key event.
Nonfarm payrolls, the unemployment rate, wage growth, the ADP report, the JOLTS, and Challenger job cuts will all reveal whether the labour market continues the sharp slowdown seen in prior releases.
For Europe, attention will be on inflation prints from both the Eurozone and Switzerland, providing fresh direction for EUR- and CHF-linked pairs.
On the 4H chart, EUR/USD is trading around 1.1680, caught in a choppy sideways range. Price has repeatedly tested both support near 1.1640 and resistance. Strong jobs data could weigh on the pair and push it back below 1.1640, while weaker labour data may allow a breakout toward 1.1740–1.1780.
USD/CHF shows a rounding top pattern on the 4H timeframe, with price pressing the neckline near 0.8000. Sellers have steadily pushed lower highs since mid-August, and this pattern could hint at further downside momentum.
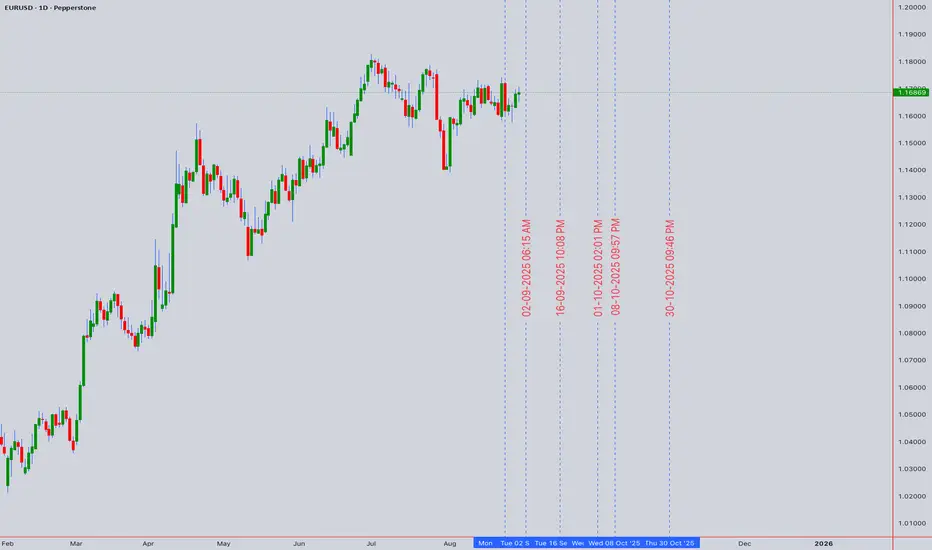
EUR/USD Technical Analysis & Trading Strategy Forecast# EUR/USD Technical Analysis & Trading Strategy Forecast - Comprehensive Multi-Timeframe Analysis
Asset Class: EUR/USD (Euro vs US Dollar)
Current Price: 1.16869 (as of August 30, 2025, 1:00 AM UTC+4)
Analysis Date: August 31, 2025
Market Context: Post-Jackson Hole consolidation phase with emerging bullish momentum
Executive Summary
The EUR/USD pair is currently trading at 1.16869, showing signs of consolidation following recent bullish momentum sparked by Fed Chair Powell's dovish tone at Jackson Hole. Our comprehensive multi-dimensional technical analysis reveals a critical juncture where multiple analytical frameworks converge, presenting compelling opportunities for both intraday scalping and swing trading strategies. The analysis incorporates advanced pattern recognition, wave theory, harmonic patterns, and momentum indicators to provide actionable trading insights for the world's most traded currency pair.
Current Market Landscape & Fundamental Context
Jay Powell's speech at Jackson Hole helped EURUSD bulls turn what was until then a weak performance into another weekly gain, marking a significant shift in market sentiment. The pair has demonstrated resilience despite ongoing economic uncertainties, with traders positioning for potential Federal Reserve policy adjustments.
Recent Elliott Wave analysis indicates an ongoing five-wave impulse structure from the August 1, 2025 low, with wave 1 peaking at 1.173, followed by a wave 2 pullback that concluded at 1.157. This structure suggests the pair is currently developing within a larger bullish framework, though short-term consolidation remains likely.
Market forecasters note that the 1.1650 level aligns with the 50 percent Fibonacci retracement drawn from the April high of 1.1900 to the July low near 1.1500, creating a significant resistance zone that will be crucial for determining the pair's next major directional move.
Multi-Timeframe Elliott Wave Analysis
Primary Wave Count Structure
Long-term Perspective (Monthly/Weekly):
Grand Supercycle: Currently in corrective Wave (B) from 2008 lows
Cycle Wave: Developing five-wave impulse from 2022 parity lows
Primary Wave: Wave III of larger degree cycle in progress
Intermediate Count: Currently in Wave (3) of III with subdivisions
Medium-term Count (Daily/4H):
From the August 1, 2025 low at 1.157, the pair has been developing a five-wave impulse structure:
Wave 1: Completed at 1.173 (160 pips)
Wave 2: Expanded Flat correction to 1.157 (38.2% retracement)
Wave 3: Currently in progress, targeting 1.180-1.185 zone
Wave 4: Expected pullback to 1.170-1.165 range
Wave 5: Ultimate target 1.190-1.200 region
Short-term Analysis (1H/15M):
EURUSD is currently developing an intraday three-wave pullback from recent highs, with ideal support area at 1.16146-1.15521 using Equal Legs technique.
Elliott Wave Targets & Projections
Immediate Targets:
Wave 3 Extension: 1.180-1.185 (1.618 x Wave 1)
Secondary Target: 1.188-1.192 (2.618 x Wave 1)
Major Resistance: 1.200-1.205 (Wave equality zone)
Support Levels (Wave 4 Correction):
Primary Support: 1.168-1.170 (23.6% retracement)
Secondary Support: 1.164-1.166 (38.2% retracement)
Critical Support: 1.160-1.162 (50% retracement)
Harmonic Pattern Analysis & Fibonacci Framework
Active Harmonic Formations
1. Bullish Gartley Pattern (4H-Daily Timeframe)
X to A Leg: 1.1900 to 1.1500 (400 pips decline)
A to B Retracement: 61.8% at 1.1747
B to C Projection: 78.6% of AB at 1.1553
Completion Zone (D): 1.1589-1.1620 (78.6% XA retracement)
Status: Pattern completed, currently in markup phase
2. Potential Bullish Bat Pattern (Daily-Weekly)
Formation Stage: B to C leg development
Critical Level: 1.1650 (B point validation)
Target Completion: 1.1520-1.1480 zone (88.6% XA)
Risk Assessment: Moderate probability (60%)
3. Crab Pattern Alert (Higher Timeframes)
Monitoring Level: Break below 1.1480 could trigger deeper Crab formation
Completion Zone: 1.1380-1.1320 (161.8% XA extension)
Strategic Implication: Major accumulation zone if activated
Fibonacci Confluence Analysis
Key Fibonacci Levels:
38.2% Retracement: 1.1652 (April-July range) - Current resistance
50% Retracement: 1.1700 (Major resistance confluence)
61.8% Golden Ratio: 1.1748 (Strong resistance barrier)
78.6% Level: 1.1796 (Ultimate bull target)
Extension Targets:
127.2% Extension: 1.1820 (From August correction)
161.8% Extension: 1.1895 (Major projection target)
200% Extension: 1.1965 (Extreme bull scenario)
Wyckoff Theory Market Structure Analysis
Current Market Phase Assessment
Phase Identification: Early Markup Phase (Spring Test Completed)
Wyckoff Characteristics Observed:
1. Accumulation Completed: May-July 2025 range (1.1500-1.1650)
2. Spring Test: August 1st low at 1.1570 (successful test)
3. Sign of Strength (SOS): August 5-8 rally to 1.1730
4. Last Point of Support (LPS): August 15-20 pullback to 1.1580
5. Current Phase: Early markup with backing and filling
Volume Analysis:
Accumulation Phase: Declining volume on pullbacks, expanding on rallies
Markup Confirmation: Volume expansion above 1.1650 resistance required
Distribution Warning: Watch for climactic volume at 1.1800+ levels
Wyckoff Price Targets:
Initial Objective: 1.1800-1.1850 (measured move from accumulation range)
Secondary Target: 1.1950-1.2000 (full range projection)
Long-term Goal: 1.2200-1.2300 (major Wyckoff projection)
W.D. Gann Theory & Sacred Geometry Analysis
Gann Square of 9 Analysis
Current Position: 1.16869 sits near critical Gann level
Key Gann Levels:
Natural Support: 1.1600 (perfect square root level)
Resistance: 1.1700 (next major Gann square)
Critical Resistance: 1.1881 (major Gann confluence)
Ultimate Target: 1.2100 (next significant square level)
Gann Time Theory & Cycles
Active Time Cycles:
90-Day Cycle: Due September 15, 2025 (±3 days)
Seasonal Tendency: September typically bearish for EUR/USD
Major Time Square: October 12, 2025 (144-day cycle)
Gann Angles Analysis:
1x1 Support Angle: Rising at 1.1620 (from August lows)
2x1 Resistance: 1.1720 (dynamic resistance line)
1x2 Support: 1.1580 (major support angle)
4x1 Resistance: 1.1840 (long-term target angle)
Price-Time Balance
Current Assessment: Price slightly ahead of time (bullish imbalance)
Equilibrium Zone: 1.1650-1.1680 (time-price balance)
Acceleration Level: Break above 1.1720 suggests time-price momentum shift
Ichimoku Kinko Hyo Cloud Analysis
Current Ichimoku Structure
Tenkan-sen (9): 1.1675 (immediate dynamic support)
Kijun-sen (26): 1.1635 (medium-term trend indicator)
Senkou Span A: 1.1655 (near-term cloud boundary)
Senkou Span B: 1.1590 (strong cloud support)
Chikou Span: Trading above price 26 periods ago (bullish signal)
Ichimoku Signals & Interpretation
Current Status: Price above cloud (bullish environment)
Key Signals:
1. TK Cross: Tenkan above Kijun (bullish short-term momentum)
2. Cloud Color: Green cloud ahead (bullish bias continues)
3. Price vs Cloud: Above cloud (trend confirmation)
4. Chikou Span: Clear of historical prices (momentum confirmation)
Ichimoku Targets:
Immediate Resistance: Tenkan-sen at 1.1675
Cloud Resistance: 1.1700-1.1720 (future cloud thickness)
Major Target: 1.1800+ (cloud projection upward)
Support Levels:
Immediate: Kijun-sen at 1.1635
Strong Support: Cloud base at 1.1590-1.1600
Critical Level: 1.1570 (cloud break would turn bearish)
Technical Indicators Deep Dive
Relative Strength Index (RSI) Analysis
Multi-Timeframe RSI Status:
Daily RSI: 58.5 (Neutral-bullish zone)
4H RSI: 62.3 (Approaching overbought but sustainable)
1H RSI: 45.2 (Oversold on recent pullback - buying opportunity)
RSI Signals & Divergences:
Bullish Divergence: Spotted on 4H chart (price lows vs RSI lows)
Support Level: RSI 50 holding as dynamic support
Resistance Zone: 70 level will indicate overbought condition
RSI Trading Levels:
Buy Signal: RSI below 40 on hourly charts
Sell Signal: RSI above 75 on daily timeframe
Trend Confirmation: RSI above 60 confirms bullish trend
Bollinger Bands (BB) Volatility Analysis
Current Band Position:
Upper Band: 1.1720 (immediate resistance)
Middle Band (SMA 20): 1.1655 (dynamic support)
Lower Band: 1.1590 (strong support)
Band Analysis:
Current Position: Upper third of bands (bullish bias)
Bandwidth: Expanding after recent contraction (volatility increase)
Band Walk: Potential for upper band walk if 1.1680 breaks
Bollinger Band Strategies:
Squeeze Play: Completed - expecting volatility expansion
Band Bounce: Look for bounces off middle band (1.1655)
Breakout Setup: Upper band break targets 1.1750+
Volume Weighted Average Price (VWAP) Analysis
Multi-Session VWAP Levels:
Daily VWAP: 1.1668 (immediate pivot)
Weekly VWAP: 1.1642 (medium-term anchor)
Monthly VWAP: 1.1595 (major support)
VWAP Trading Signals:
Above VWAP: Bullish institutional sentiment
VWAP Reclaim: 1.1668 break confirms bullish continuation
Volume Profile: Heavy volume at 1.1640-1.1660 (support zone)
Moving Average Convergence Analysis
Simple Moving Averages:
SMA 20: 1.1655 (immediate support)
SMA 50: 1.1618 (medium-term support)
SMA 100: 1.1585 (long-term support trend)
SMA 200: 1.1542 (major trend indicator)
Exponential Moving Averages:
EMA 12: 1.1672 (short-term trend)
EMA 26: 1.1651 (MACD baseline)
EMA 50: 1.1628 (medium-term trend)
Moving Average Signals:
Golden Cross Watch: EMA 12 crossing above EMA 26 (bullish)
Support Confluence: Multiple MAs clustering at 1.1620-1.1650
Resistance Zone: 1.1680-1.1700 (MA resistance cluster)
Advanced Candlestick Pattern Recognition
Recent Candlestick Formations
Weekly Chart Patterns:
1. Hammer Formation (Week of August 26) - Bullish reversal signal
2. Doji Sequence (Previous weeks) - Indecision resolved to upside
3. Bullish Engulfing potential for current week
Daily Chart Patterns:
1. Three White Soldiers (August 5-7) - Strong bullish momentum
2. Flag Pattern (August 15-20) - Consolidation before continuation
3. Morning Star formation developing (August 28-30)
4-Hour Chart Signals:
1. Bull Flag Breakout - Target 1.1750
2. Ascending Triangle - Apex at 1.1680
3. Cup and Handle pattern completing
Candlestick Strategy Integration
Reversal Patterns to Watch:
Evening Star at 1.1720+ (bearish reversal warning)
Shooting Star above 1.1700 (short-term top signal)
Hanging Man at current levels (continuation vs reversal)
Continuation Patterns:
Bullish Flag break above 1.1680 (measured move to 1.1750)
Pennant formation resolution (typically bullish in uptrend)
Rising Three Methods (bullish continuation pattern)
Market Structure & Key Levels
Critical Support & Resistance Framework
Major Resistance Levels:
1. 1.1680-1.1690: Immediate resistance (Bollinger upper band + previous highs)
2. 1.1720-1.1730: Intermediate resistance (August highs + Gann angle)
3. 1.1750-1.1760: Major resistance (Multiple harmonic confluences)
4. 1.1800-1.1820: Significant resistance (Fibonacci extensions + Wyckoff target)
5. 1.1880-1.1900: Ultimate resistance (April highs + major Gann level)
Critical Support Levels:
1. 1.1650-1.1660: Immediate support (VWAP + Fibonacci 38.2%)
2. 1.1620-1.1635: Intermediate support (Kijun-sen + SMA cluster)
3. 1.1590-1.1600: Major support (Cloud base + Gann square)
4. 1.1570-1.1580: Critical support (Elliott Wave invalidation)
5. 1.1520-1.1540: Ultimate support (Harmonic completion + major lows)
Market Structure Analysis
Current Structure: Higher highs and higher lows since August 1
Trend Definition: Bullish on all timeframes above 1.1580
Structure Break: Below 1.1570 would signal trend reversal
Impulse vs Corrective: Currently in impulsive bullish phase
Comprehensive Trading Strategies
Intraday Trading Strategy (5M - 4H Charts)
# Strategy 1: Bollinger Band Bounce (Success Rate: 65%)
Setup Requirements:
- Price approaching middle Bollinger Band (1.1655)
- RSI < 45 on 1H chart
- Volume above average on approach
Entry Criteria:
Long Entry: 1.1650-1.1658 (scale in approach)
Stop Loss: 1.1635 (below key support)
Target 1: 1.1680 (Upper Bollinger Band)
Target 2: 1.1720 (Previous resistance)
Risk-Reward: 1:2.5
# Strategy 2: Breakout Trading (Success Rate: 70%)
Bullish Breakout:
Entry: Break above 1.1680 with volume confirmation
Stop Loss: 1.1665 (back below breakout level)
Target 1: 1.1720 (measured move)
Target 2: 1.1750 (harmonic target)
Target 3: 1.1800 (major resistance)
Bearish Breakout:
Entry: Break below 1.1635 with volume
Stop Loss: 1.1655 (failed breakdown)
Target 1: 1.1600 (immediate support)
Target 2: 1.1570 (major support)
# Strategy 3: RSI Divergence Play (Success Rate: 75%)
Setup: RSI divergence on 1H-4H timeframes
Entry: Confirmation candle after divergence spotted
Management: Trail stops below key swing lows/highs
Targets: Previous swing extremes
Swing Trading Strategy (4H - Monthly Charts)
# Primary Swing Setup: Elliott Wave Continuation
Market Context: Currently in Wave 3 of larger degree impulse
Long Position Framework:
Accumulation Zone: 1.1620-1.1660 (on any pullbacks)
Entry Trigger: Hold above 1.1635 with bullish momentum
Stop Loss: 1.1570 (Elliott Wave invalidation)
Target 1: 1.1750-1.1800 (Wave 3 extension)
Target 2: 1.1850-1.1900 (Wave 3 completion)
Ultimate Target: 1.1950-1.2000 (Wave 5 projection)
Position Size: 2% account risk
Time Horizon: 4-8 weeks
Risk Management:
Initial Risk: 30-50 pips (tight stops on entries)
Position Scaling: Add on pullbacks to 1.1640-1.1650
Profit Taking: 25% at Target 1, 50% at Target 2, 25% runner
Trailing Stops: Implement after 1:1 risk-reward achieved
# Alternative Swing Setup: Range Trading
If Elliott Wave Fails:
Range: 1.1570-1.1720 (broad consolidation range)
Buy Zone: 1.1570-1.1600 (range lows with confirmation)
Sell Zone: 1.1680-1.1720 (range highs with reversal signals)
Stop Loss: Outside range boundaries
Strategy: Fade extremes, take profits at opposite boundaries
Weekly Trading Plan (September 2-6, 2025)
Monday September 2: Labor Day Impact
Expected Scenario: Thin liquidity due to US holiday
Strategy: Avoid major positions, focus on range trading
Key Levels: 1.1650-1.1680 range likely
Risk: Potential for fake breakouts due to low volume
Tuesday September 3: ISM Manufacturing PMI
Market Focus: US economic data release (10:00 AM ET)
Strategy: Position ahead of data if clear setup exists
Bullish Scenario: Weak PMI data (EUR/USD rally potential)
Bearish Scenario: Strong PMI data (USD strength)
Key Level: 1.1670 break determines direction
Wednesday September 4: ECB Rate Decision Watch
Major Event: ECB policy meeting preparation
Strategy: Volatility expansion expected
Pre-Event: Look for coiling patterns, reduced ranges
Post-Event: Breakout trading strategies
Risk Management: Reduce position sizes before announcement
Thursday September 5: US Initial Claims + Services PMI
Technical Focus: Mid-week momentum continuation
Morning Strategy: European session range trading
Afternoon Strategy: US data reaction plays
Key Confluence: 1.1680 resistance test likely
Friday September 6: Non-Farm Payrolls Preparation
Week-End Positioning: Major data preparation
Strategy: Reduce risk ahead of weekend
Technical Focus: Weekly close positioning
Target: Weekly close above 1.1660 (bullish) or below 1.1640 (bearish)
Advanced Pattern Recognition Alerts
Bull Trap Scenarios
Setup 1: False Breakout Above 1.1720
Warning Signs: Low volume breakout, immediate reversal
Response: Short on break back below 1.1700
Target: 1.1650-1.1620 (measured move down)
Stop Loss: Above 1.1730 (failed trap)
Setup 2: Failed Elliott Wave Extension
Scenario: Wave 3 fails to extend beyond 1.1750
Implication: Possible complex Wave 2 still developing
Strategy: Wait for deeper pullback to 1.1600 area
Bear Trap Alerts
Setup 1: False Break Below 1.1635
Characteristics: High volume break, quick recovery
Response: Long on reclaim of 1.1640-1.1645
Target: 1.1680-1.1700 (trapped bears covering)
Confirmation: RSI bullish divergence required
Setup 2: Harmonic Pattern Failure
Scenario: Break below harmonic support at 1.1590
Response: Wait for retest and rejection
Strategy: Strong long opportunity if support holds on retest
Risk Management & Position Sizing Framework
Account Risk Allocation
Single Trade Risk: Maximum 1% for intraday, 2% for swing trades
Currency Exposure: Total EUR/USD exposure not exceeding 5% of account
Correlation Risk: Monitor EUR/GBP, GBP/USD correlations
News Risk: Reduce positions by 50% ahead of major events
Stop Loss Methodology
Technical Stops:
Support/Resistance: 10-15 pips beyond key levels
Moving Average: Below/above significant MA levels
Volatility-Based: 1.5x Average True Range (ATR)
Time-Based Stops:
Intraday: Exit if no progress within 4-6 hours
Swing: Exit if no progress within 5 trading days
Event Risk: Flat before major announcements unless specifically trading the event
Profit Taking Protocols
Scaled Exit Strategy:
1. 25% at 1:1 Risk-Reward (secure break-even)
2. 50% at 1:2 Risk-Reward (lock in profits)
3. 25% runner with trailing stop (capture trends)
Trailing Stop Guidelines:
Activate: After reaching 1:1 risk-reward
Method: Trail below/above previous swing lows/highs
Minimum Trail: 15 pips for intraday, 30 pips for swing
Market Psychology & Sentiment Analysis
Current Sentiment Indicators
Positioning Data:
COT Report: Large speculators slightly long EUR
Retail Sentiment: 60% long EUR/USD (contrarian bearish)
Institutional Flow: Mixed signals, slight USD weakness
Fear & Greed Indicators:
VIX Level: Moderate (supportive of risk-on)
Currency Vol: EUR/USD implied volatility declining
Safe Haven Demand: USD demand moderating
Psychological Price Levels
Major Round Numbers:
1.1600: Psychological support (previous resistance)
1.1700: Major psychological resistance
1.1800: Significant psychological barrier
1.2000: Major psychological milestone (parity with 2020 levels)
External Factors & Macroeconomic Context
Central Bank Policy Divergence
Federal Reserve:
- Current stance: Data-dependent, potential pause in tightening
- Market expectations: 25bps cut possibility in Q4 2025
- Key speakers: Watch for Powell, Williams, and other Fed officials
European Central Bank:
- Current stance: Gradual normalization continues
- Inflation target: Progress toward 2% target ongoing
- Policy differential: EUR benefits from relative hawkishness
Geopolitical Risk Factors
European Union:
- Energy security concerns monitoring required
- Political stability in major EU economies
- Brexit-related trade impacts on EUR sentiment
Global Factors:
- China economic data impacts on risk sentiment
- Commodity price fluctuations affecting EUR
- Global supply chain normalization supporting EUR
Economic Calendar Priority Events
High Impact EUR Events:
- ECB Rate Decisions and Press Conferences
- Eurozone CPI and Core CPI readings
- German IFO Business Climate and ZEW indices
- European PMI manufacturing and services data
High Impact USD Events:
- Federal Reserve policy meetings and minutes
- US Non-Farm Payrolls and unemployment rate
- US CPI and Core CPI inflation readings
- US GDP and consumer confidence indicators
Technology Integration & Automation
Automated Alert Systems
Price Alerts:
Breakout Levels: 1.1680, 1.1720, 1.1635, 1.1600
Support/Resistance: All major levels identified
Pattern Completion: Harmonic pattern targets
Elliott Wave: Wave completion and invalidation levels
Indicator Alerts:
RSI: Oversold (<30) and Overbought (>70) conditions
Bollinger Bands: Band squeeze and expansion signals
MACD: Signal line crosses and divergences
Volume: Unusual volume spikes (2x average)
Trading Platform Integration
TradingView Setup:
Multi-timeframe dashboard: 15M, 1H, 4H, Daily, Weekly
Custom indicators: Harmonic scanner, Elliott Wave tools
Alert integration: Mobile and email notifications
Backtesting: Strategy performance validation
MetaTrader Integration:
Expert Advisor: Automated entry/exit based on confluences
Risk Management: Position sizing and stop-loss automation
News Integration: Economic calendar with impact levels
Statistics Tracking: Trade performance analytics
Advanced Strategy Combinations
Multi-Confluence Entry System
Tier 1 Signals (Highest Probability):
- Elliott Wave + Harmonic Pattern + RSI Divergence
- Wyckoff accumulation + Gann support + Volume confirmation
- Ichimoku bullish signals + Candlestick reversal patterns
Tier 2 Signals (Moderate Probability):
- Fibonacci confluence + Moving average support
- Bollinger Band bounce + VWAP reclaim
- Chart pattern breakout + momentum confirmation
Tier 3 Signals (Lower Probability):
- Single indicator signals without confluence
- Counter-trend trades without strong reversal signals
- News-based trades without technical confirmation
Scenario Planning & Contingency Strategies
Scenario 1: Strong Bull Market (40% Probability)
Trigger: Break above 1.1720 with strong volume
Targets: 1.1800, 1.1880, 1.1950
Strategy: Trend following, add on pullbacks
Risk: Overbought conditions, potential corrections
Scenario 2: Range-Bound Market (35% Probability)
Parameters: 1.1570-1.1720 trading range
Strategy: Fade extremes, take profits at boundaries
Duration: 4-6 weeks potential
Risk: False breakouts, whipsaw price action
Scenario 3: Bear Market Resumption (25% Probability)
Trigger: Break below 1.1570 with conviction
Targets: 1.1520, 1.1480, 1.1400
Strategy: Short rallies, trend following down
Risk: Central bank intervention, policy shifts
Performance Metrics & Success Indicators
Strategy Validation Metrics
Win Rate Targets:
- Intraday strategies: 60-65% win rate minimum
- Swing strategies: 55-60% win rate acceptable
- Overall portfolio: 58% win rate target
Risk-Reward Ratios:
- Minimum acceptable: 1:1.5 risk-reward
- Target average: 1:2.5 risk-reward
- Exceptional setups: 1:4+ risk-reward potential
Maximum Drawdown Limits:
- Daily drawdown: 2% maximum
- Weekly drawdown: 5% maximum
- Monthly drawdown: 8% maximum
Performance Tracking KPIs
Trading Efficiency:
- Average holding period for winning trades
- Average holding period for losing trades
- Profit factor (gross profit/gross loss)
- Sharpe ratio for trading performance
Market Timing Accuracy:
- Entry timing effectiveness
- Exit timing optimization
- Pattern recognition accuracy
- Economic event impact prediction
Conclusion & Strategic Outlook
The EUR/USD pair presents a compelling technical landscape with multiple analytical frameworks converging to suggest potential bullish continuation from current levels. MACD remains above the zero line, though momentum is fading, signaling a potential sideways phase. RSI holds near 60, reflecting the dominance of bullish sentiment, supporting our cautiously optimistic bias.
The confluence of Elliott Wave impulse structure, completed harmonic patterns, Wyckoff markup phase characteristics, and supportive Ichimoku cloud positioning creates a favorable risk-reward environment for both intraday and swing trading opportunities.
Key Strategic Themes:
1. Primary Bias: Bullish above 1.1570 invalidation level
2. Target Hierarchy: 1.1720 → 1.1800 → 1.1880 → 1.1950
3. Risk Management: Critical support at 1.1635-1.1650 cluster
4. Time Horizon: 4-8 week bullish campaign potential
Success Probability Assessment:
Bullish Continuation: 65% probability
Sideways Consolidation: 25% probability
Bearish Reversal: 10% probability
Critical Decision Points:
1. 1.1680 Resistance: Break confirms bullish acceleration
2. 1.1635 Support: Hold required for bullish structure integrity
3. 1.1720 Zone: Major resistance test will determine intermediate-term direction
The integration of advanced technical methodologies with comprehensive risk management protocols positions traders to capitalize on the EUR/USD pair's evolving price action while maintaining appropriate downside protection. Continuous monitoring of central bank policies, economic data releases, and global risk sentiment remains essential for strategy adaptation and optimal trade execution.
Trading Recommendation: Maintain bullish bias with defensive positioning, scale into strength above key resistance levels, and prepare for potential volatility expansion around major economic events and central bank communications.
EURNZD Daily Analysis: Watching Support for a Bullish Break💶🇳🇿 EURNZD on the daily timeframe is clearly in a bullish trend 📈.
Right now, price is experiencing a deep pullback 🔽, and I’ll be watching closely to see if it holds at the key support level 🛑📊.
If we get a bullish break of structure 🔓🟢 from here, it could open up a long opportunity 🎯🚀.
⚠️ This is for educational purposes only and not financial advice 📚

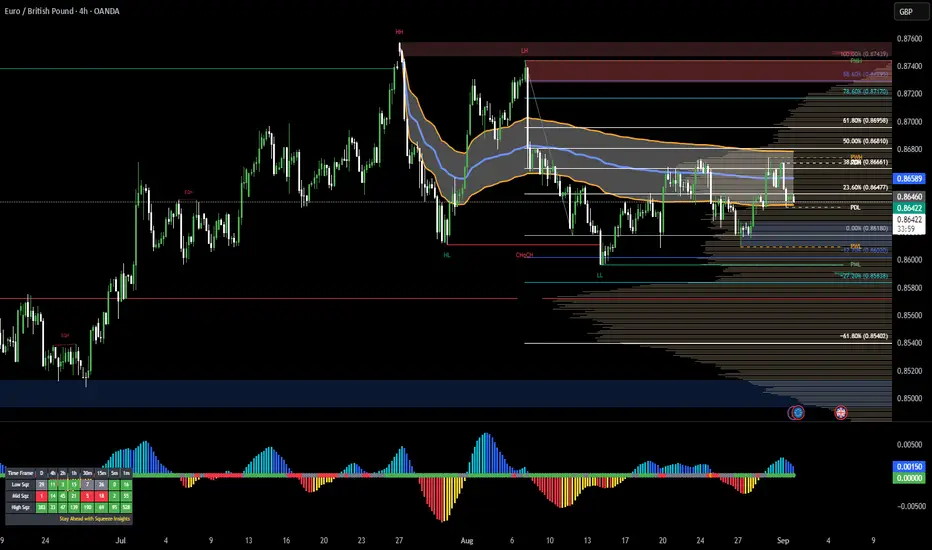
EURGBP should fall to 0.85The Euro/Pound is showing considerable weakness on the 4h timeframe. We are currently rejecting out of the anchored VWAP channel. A close above the channel would invalidate the trade.
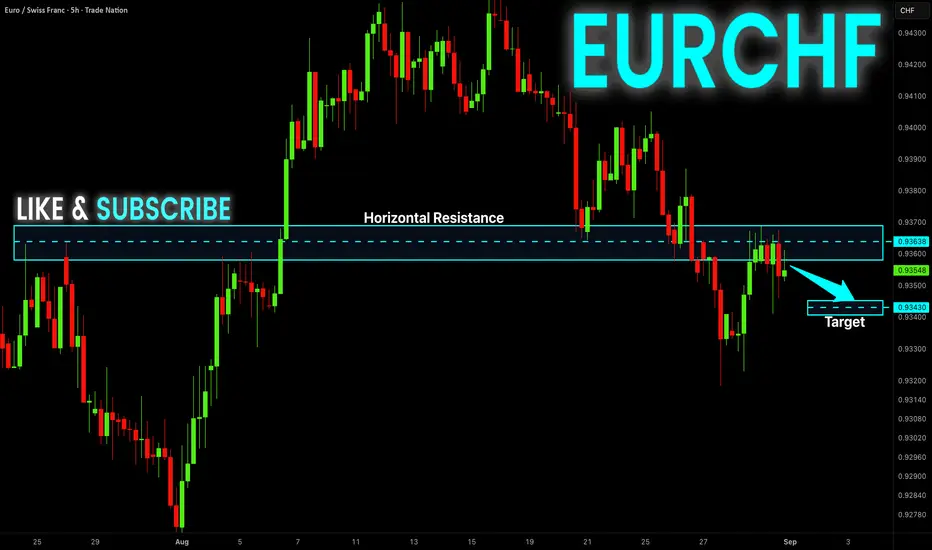
EUR-CHF Will Fall! Sell!
Hello,Traders!
EUR-CHF made a retest
Of the horizontal resistance
Of 0.9370 from where we
Are already seeing a local
Bearish correction and a
Further bearish move down
Is to be expected on Monday!
Sell!
Comment and subscribe to help us grow!
Check out other forecasts below too!
Disclosure: I am part of Trade Nation's Influencer program and receive a monthly fee for using their TradingView charts in my analysis.
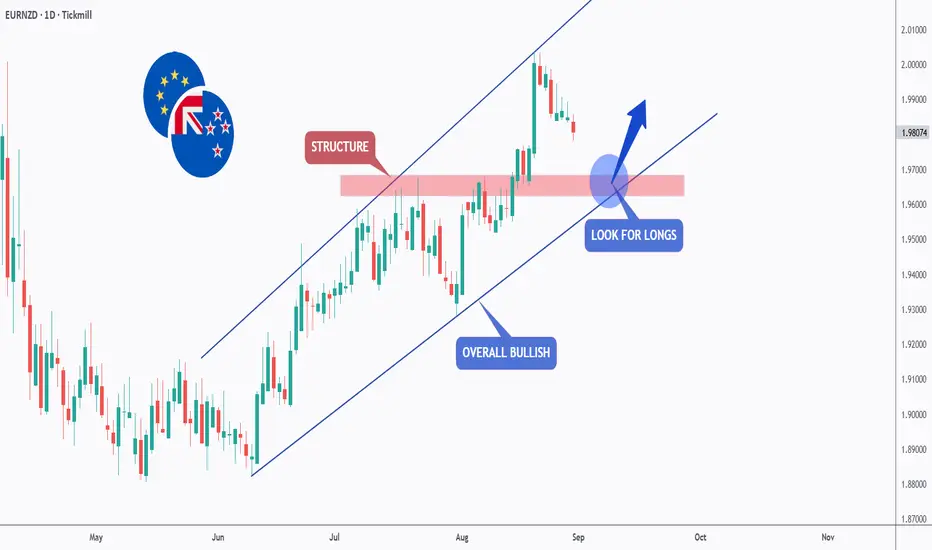
EURNZD - Bullish Control Ahead!Hello TradingView Family / Fellow Traders. This is Richard, also known as theSignalyst.
📈EURNZD has been overall bullish trading within the rising channel marked in blue.
This week, EURNZD has been retesting the lower bound of the channel.
Moreover, the red zone is a strong structure.
🏹 Thus, the highlighted blue circle is a strong area to look for buy setups as it is the intersection of the lower blue trendline and red structure.
📚 As per my trading style:
As #EURNZD approaches the blue circle zone, I will be looking for trend-following bullish reversal setups (like a double bottom pattern, trendline break , and so on...)
📚 Always follow your trading plan regarding entry, risk management, and trade management.
Good luck!
All Strategies Are Good; If Managed Properly!
~Richard Nasr
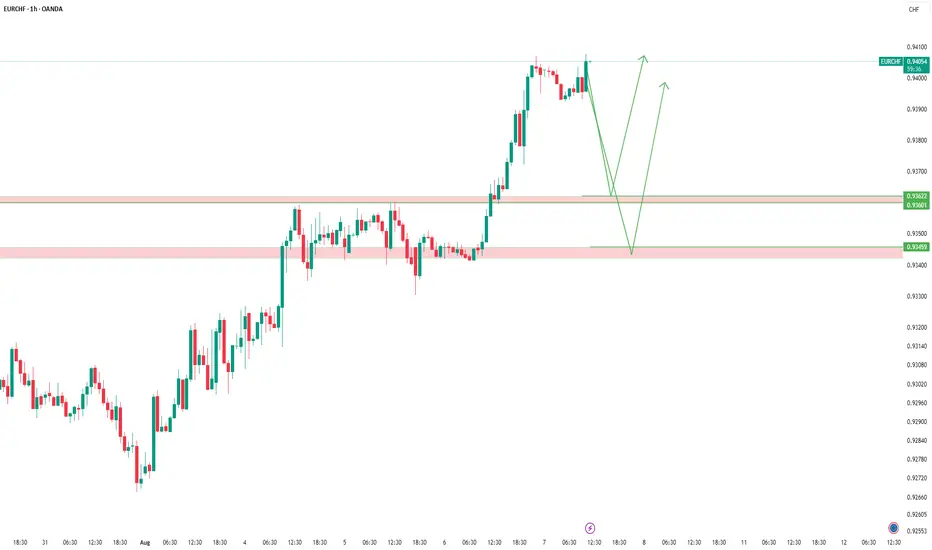
EURCHF – Pullback & New SetupIn my previous analysis (tagged below), I entered a short position. Price reached Reward 2, then pulled back and took me out at breakeven.
This is where you see the power of partial exit — it protects you from losses and keeps your risk low.
With this approach, I rarely see a 5% drawdown, but of course, nothing is guaranteed in trading.
The market broke my level strongly, and that’s okay. We don’t fight the market — we follow it.
Now I’m waiting for a pullback to the broken level, and I’ve also identified another nearby key zone.
If I get a valid signal at either level, I’ll enter a buy trade.
🧠 Remember: Trade with the market, not against it.
Drop the ego, drop the bias — let price lead.
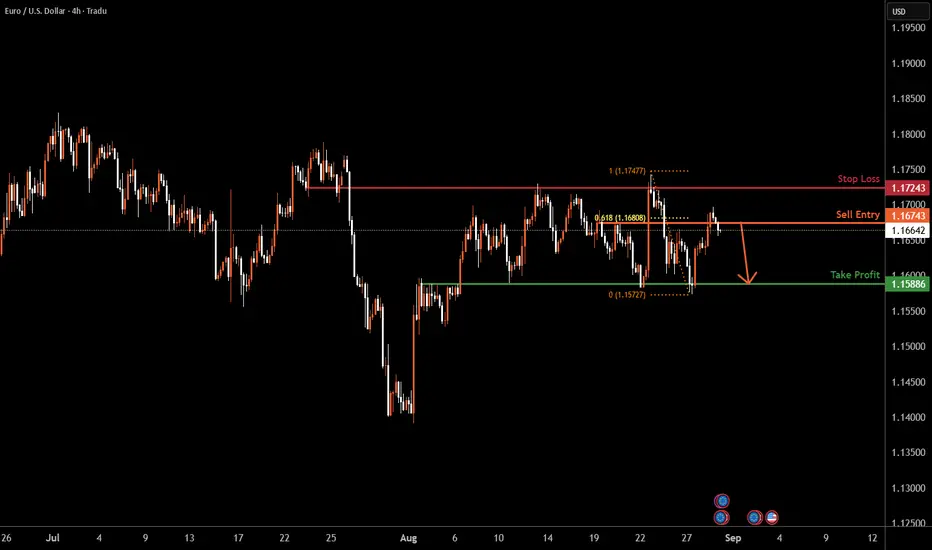
EURUSD H4 | 61.8% Fibonacci Retracement Signals Bearish ReversalThe Fiber (EUR/USD) is reacting off the sell entry which is a pullback resistance that aligns with the 61.8% Fibonacci retracement and could drop from this level to the downside.
Sell entry is at 1.16743, whihc is a pullback resistance that lines up with the 61.8% Fibonacci retracement.
Stop loss is at 1.1724, whihc is a pullback resistance.
Takeprofit is at 1.1588, which is an overlap support.
High Risk Investment Warning
Trading Forex/CFDs on margin carries a high level of risk and may not be suitable for all investors. Leverage can work against you.
Stratos Markets Limited (tradu.com ):
CFDs are complex instruments and come with a high risk of losing money rapidly due to leverage. 65% of retail investor accounts lose money when trading CFDs with this provider. You should consider whether you understand how CFDs work and whether you can afford to take the high risk of losing your money.
Stratos Europe Ltd (tradu.com ):
CFDs are complex instruments and come with a high risk of losing money rapidly due to leverage. 66% of retail investor accounts lose money when trading CFDs with this provider. You should consider whether you understand how CFDs work and whether you can afford to take the high risk of losing your money.
Stratos Global LLC (tradu.com ):
Losses can exceed deposits.
Please be advised that the information presented on TradingView is provided to Tradu (‘Company’, ‘we’) by a third-party provider (‘TFA Global Pte Ltd’). Please be reminded that you are solely responsible for the trading decisions on your account. There is a very high degree of risk involved in trading. Any information and/or content is intended entirely for research, educational and informational purposes only and does not constitute investment or consultation advice or investment strategy. The information is not tailored to the investment needs of any specific person and therefore does not involve a consideration of any of the investment objectives, financial situation or needs of any viewer that may receive it. Kindly also note that past performance is not a reliable indicator of future results. Actual results may differ materially from those anticipated in forward-looking or past performance statements. We assume no liability as to the accuracy or completeness of any of the information and/or content provided herein and the Company cannot be held responsible for any omission, mistake nor for any loss or damage including without limitation to any loss of profit which may arise from reliance on any information supplied by TFA Global Pte Ltd.
The speaker(s) is neither an employee, agent nor representative of Tradu and is therefore acting independently. The opinions given are their own, constitute general market commentary, and do not constitute the opinion or advice of Tradu or any form of personal or investment advice. Tradu neither endorses nor guarantees offerings of third-party speakers, nor is Tradu responsible for the content, veracity or opinions of third-party speakers, presenters or participants.
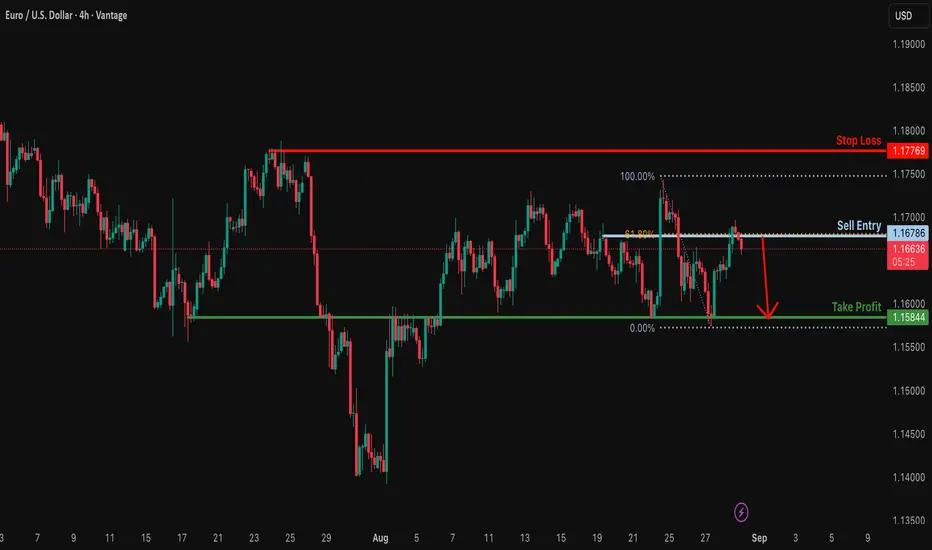
Bearish reversal?EUR/USD is reacting off the resistance level, which is a pullback resistance that aligns with the 61.8% Fibonacci retracement and could reverse from this level to our take profit.
Entry: 1.1678
Why we like it:
There is a pullback resistance level that lines up with the 61.8% Fibonacci retracement.
Stop loss: 1.1776
Why we like it:
There is a swing high resistance level,
Take profit: 1.1584
Why we like it:
There is an overlap support.
Enjoying your TradingView experience? Review us!
Please be advised that the information presented on TradingView is provided to Vantage (‘Vantage Global Limited’, ‘we’) by a third-party provider (‘Everest Fortune Group’). Please be reminded that you are solely responsible for the trading decisions on your account. There is a very high degree of risk involved in trading. Any information and/or content is intended entirely for research, educational and informational purposes only and does not constitute investment or consultation advice or investment strategy. The information is not tailored to the investment needs of any specific person and therefore does not involve a consideration of any of the investment objectives, financial situation or needs of any viewer that may receive it. Kindly also note that past performance is not a reliable indicator of future results. Actual results may differ materially from those anticipated in forward-looking or past performance statements. We assume no liability as to the accuracy or completeness of any of the information and/or content provided herein and the Company cannot be held responsible for any omission, mistake nor for any loss or damage including without limitation to any loss of profit which may arise from reliance on any information supplied by Everest Fortune Group.
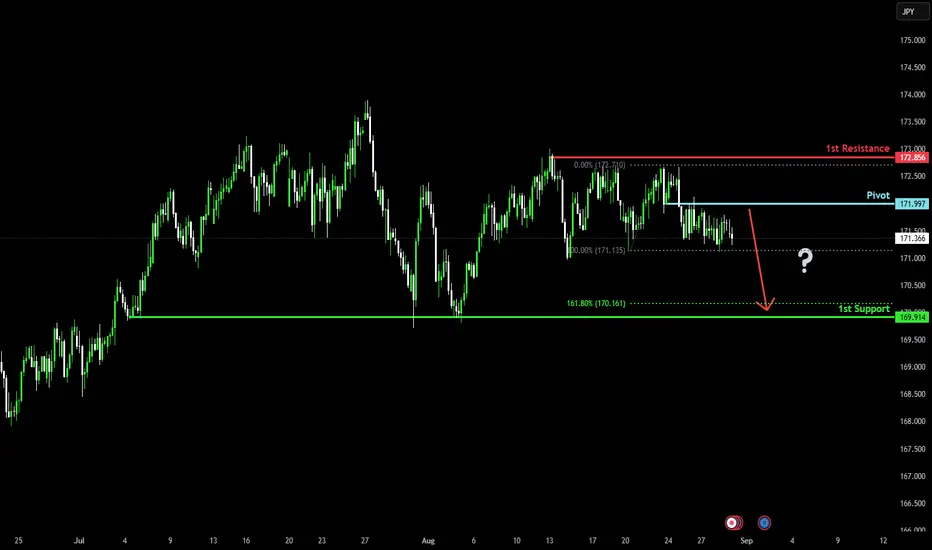
Bearish drop off pullback resistance?EUR/JPY has rejected off the pivot which has been identified as a pullback resistance and could drop to the major support.
Pivot: 171.99
1st Support: 169.91
1st Resistance: 172.85
Risk Warning:
Trading Forex and CFDs carries a high level of risk to your capital and you should only trade with money you can afford to lose. Trading Forex and CFDs may not be suitable for all investors, so please ensure that you fully understand the risks involved and seek independent advice if necessary.
Disclaimer:
The above opinions given constitute general market commentary, and do not constitute the opinion or advice of IC Markets or any form of personal or investment advice.
Any opinions, news, research, analyses, prices, other information, or links to third-party sites contained on this website are provided on an "as-is" basis, are intended only to be informative, is not an advice nor a recommendation, nor research, or a record of our trading prices, or an offer of, or solicitation for a transaction in any financial instrument and thus should not be treated as such. The information provided does not involve any specific investment objectives, financial situation and needs of any specific person who may receive it. Please be aware, that past performance is not a reliable indicator of future performance and/or results. Past Performance or Forward-looking scenarios based upon the reasonable beliefs of the third-party provider are not a guarantee of future performance. Actual results may differ materially from those anticipated in forward-looking or past performance statements. IC Markets makes no representation or warranty and assumes no liability as to the accuracy or completeness of the information provided, nor any loss arising from any investment based on a recommendation, forecast or any information supplied by any third-party.
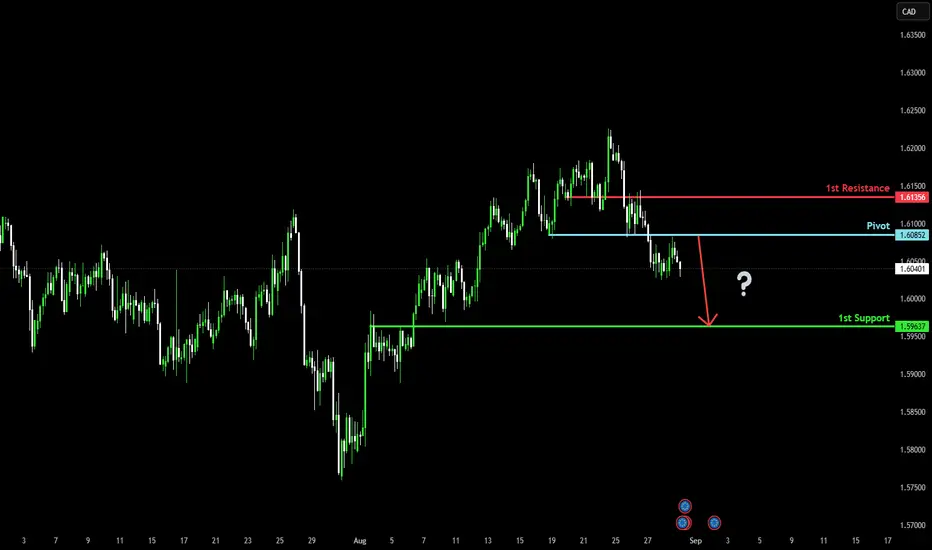
Bearish drop off?EUR/CAD has rejected off the pivot which acts as a pullback resistance and could drop to the 1st support.
Pivot: 1.60852
1st Support: 1.59637
1st Resistance: 1.61356
Risk Warning:
Trading Forex and CFDs carries a high level of risk to your capital and you should only trade with money you can afford to lose. Trading Forex and CFDs may not be suitable for all investors, so please ensure that you fully understand the risks involved and seek independent advice if necessary.
Disclaimer:
The above opinions given constitute general market commentary, and do not constitute the opinion or advice of IC Markets or any form of personal or investment advice.
Any opinions, news, research, analyses, prices, other information, or links to third-party sites contained on this website are provided on an "as-is" basis, are intended only to be informative, is not an advice nor a recommendation, nor research, or a record of our trading prices, or an offer of, or solicitation for a transaction in any financial instrument and thus should not be treated as such. The information provided does not involve any specific investment objectives, financial situation and needs of any specific person who may receive it. Please be aware, that past performance is not a reliable indicator of future performance and/or results. Past Performance or Forward-looking scenarios based upon the reasonable beliefs of the third-party provider are not a guarantee of future performance. Actual results may differ materially from those anticipated in forward-looking or past performance statements. IC Markets makes no representation or warranty and assumes no liability as to the accuracy or completeness of the information provided, nor any loss arising from any investment based on a recommendation, forecast or any information supplied by any third-party.
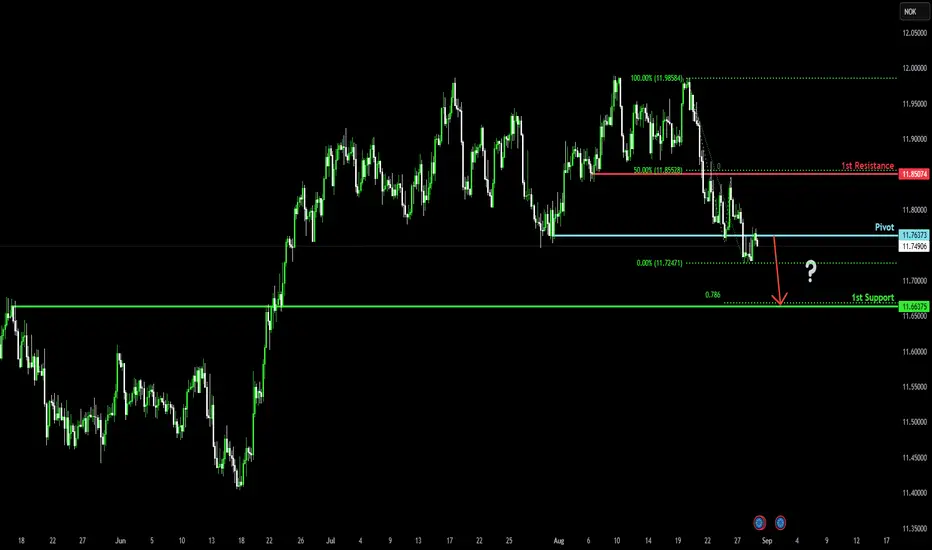
Bearish continuation?EUR/NOK is reacting off the pivot which acts as a pullback resistance and could drop to the pullback support that lines up with the 78.6% Fibonacci projection.
Pivot: 11.76373
1st Support: 11.66458
1st Resistance: 11.85074
Risk Warning:
Trading Forex and CFDs carries a high level of risk to your capital and you should only trade with money you can afford to lose. Trading Forex and CFDs may not be suitable for all investors, so please ensure that you fully understand the risks involved and seek independent advice if necessary.
Disclaimer:
The above opinions given constitute general market commentary, and do not constitute the opinion or advice of IC Markets or any form of personal or investment advice.
Any opinions, news, research, analyses, prices, other information, or links to third-party sites contained on this website are provided on an "as-is" basis, are intended only to be informative, is not an advice nor a recommendation, nor research, or a record of our trading prices, or an offer of, or solicitation for a transaction in any financial instrument and thus should not be treated as such. The information provided does not involve any specific investment objectives, financial situation and needs of any specific person who may receive it. Please be aware, that past performance is not a reliable indicator of future performance and/or results. Past Performance or Forward-looking scenarios based upon the reasonable beliefs of the third-party provider are not a guarantee of future performance. Actual results may differ materially from those anticipated in forward-looking or past performance statements. IC Markets makes no representation or warranty and assumes no liability as to the accuracy or completeness of the information provided, nor any loss arising from any investment based on a recommendation, forecast or any information supplied by any third-party.
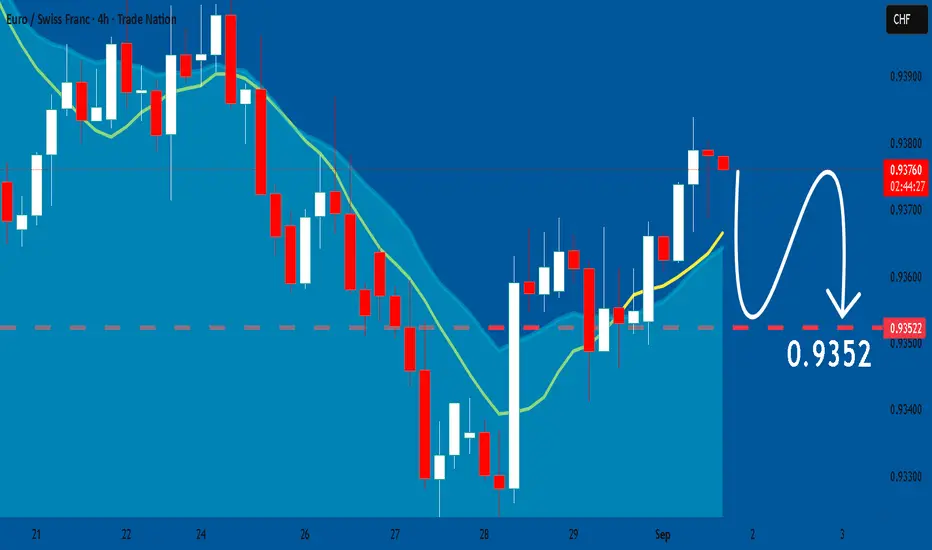
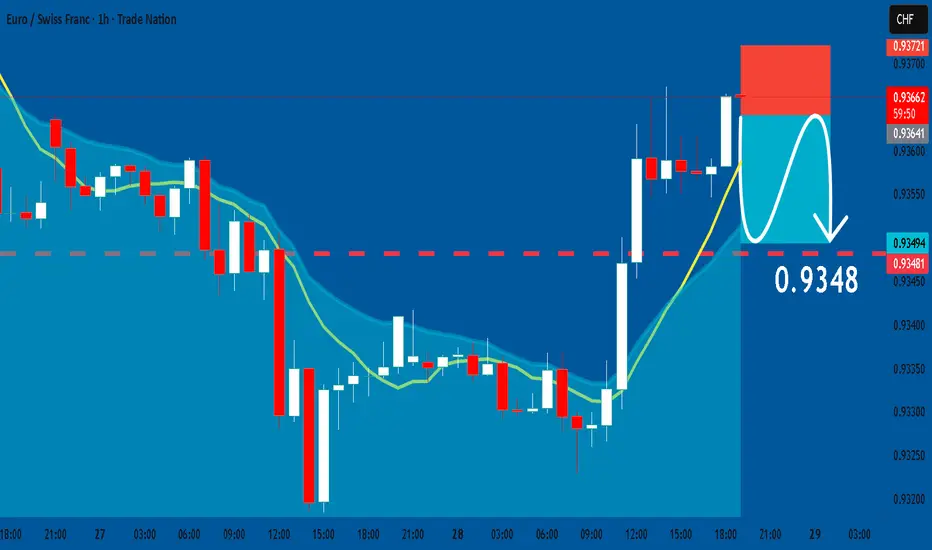
EURCHF: Bearish Continuation & Short Signal
EURCHF
- Classic bearish formation
- Our team expects fall
SUGGESTED TRADE:
Swing Trade
Sell EURCHF
Entry Level - 0.9364
Sl - 0.9372
Tp - 0.9348
Our Risk - 1%
Start protection of your profits from lower levels
Disclosure: I am part of Trade Nation's Influencer program and receive a monthly fee for using their TradingView charts in my analysis.
❤️ Please, support our work with like & comment! ❤️
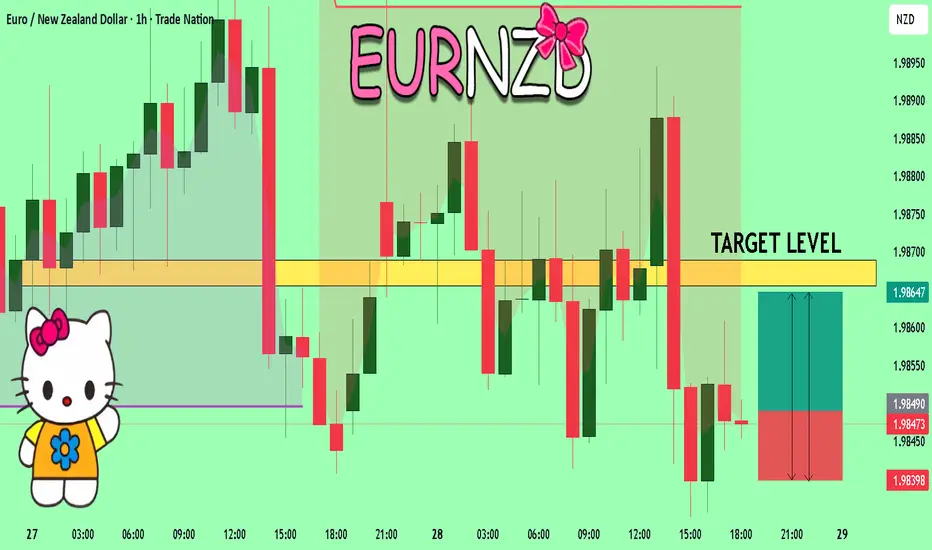
EURNZD On The Rise! BUY!
My dear friends,
Please, find my technical outlook for EURNZD below:
The instrument tests an important psychological level 1.9849
Bias - Bullish
Technical Indicators: Supper Trend gives a precise Bullish signal, while Pivot Point HL predicts price changes and potential reversals in the market.
Target - 1.9865
Recommended Stop Loss - 1.9839
About Used Indicators:
Super-trend indicator is more useful in trending markets where there are clear uptrends and downtrends in price.
Disclosure: I am part of Trade Nation's Influencer program and receive a monthly fee for using their TradingView charts in my analysis.
———————————
WISH YOU ALL LUCK